Regression and Correlation Analysis for DeVry Admissions Data
VerifiedAdded on 2022/12/01
|6
|1231
|456
Report
AI Summary
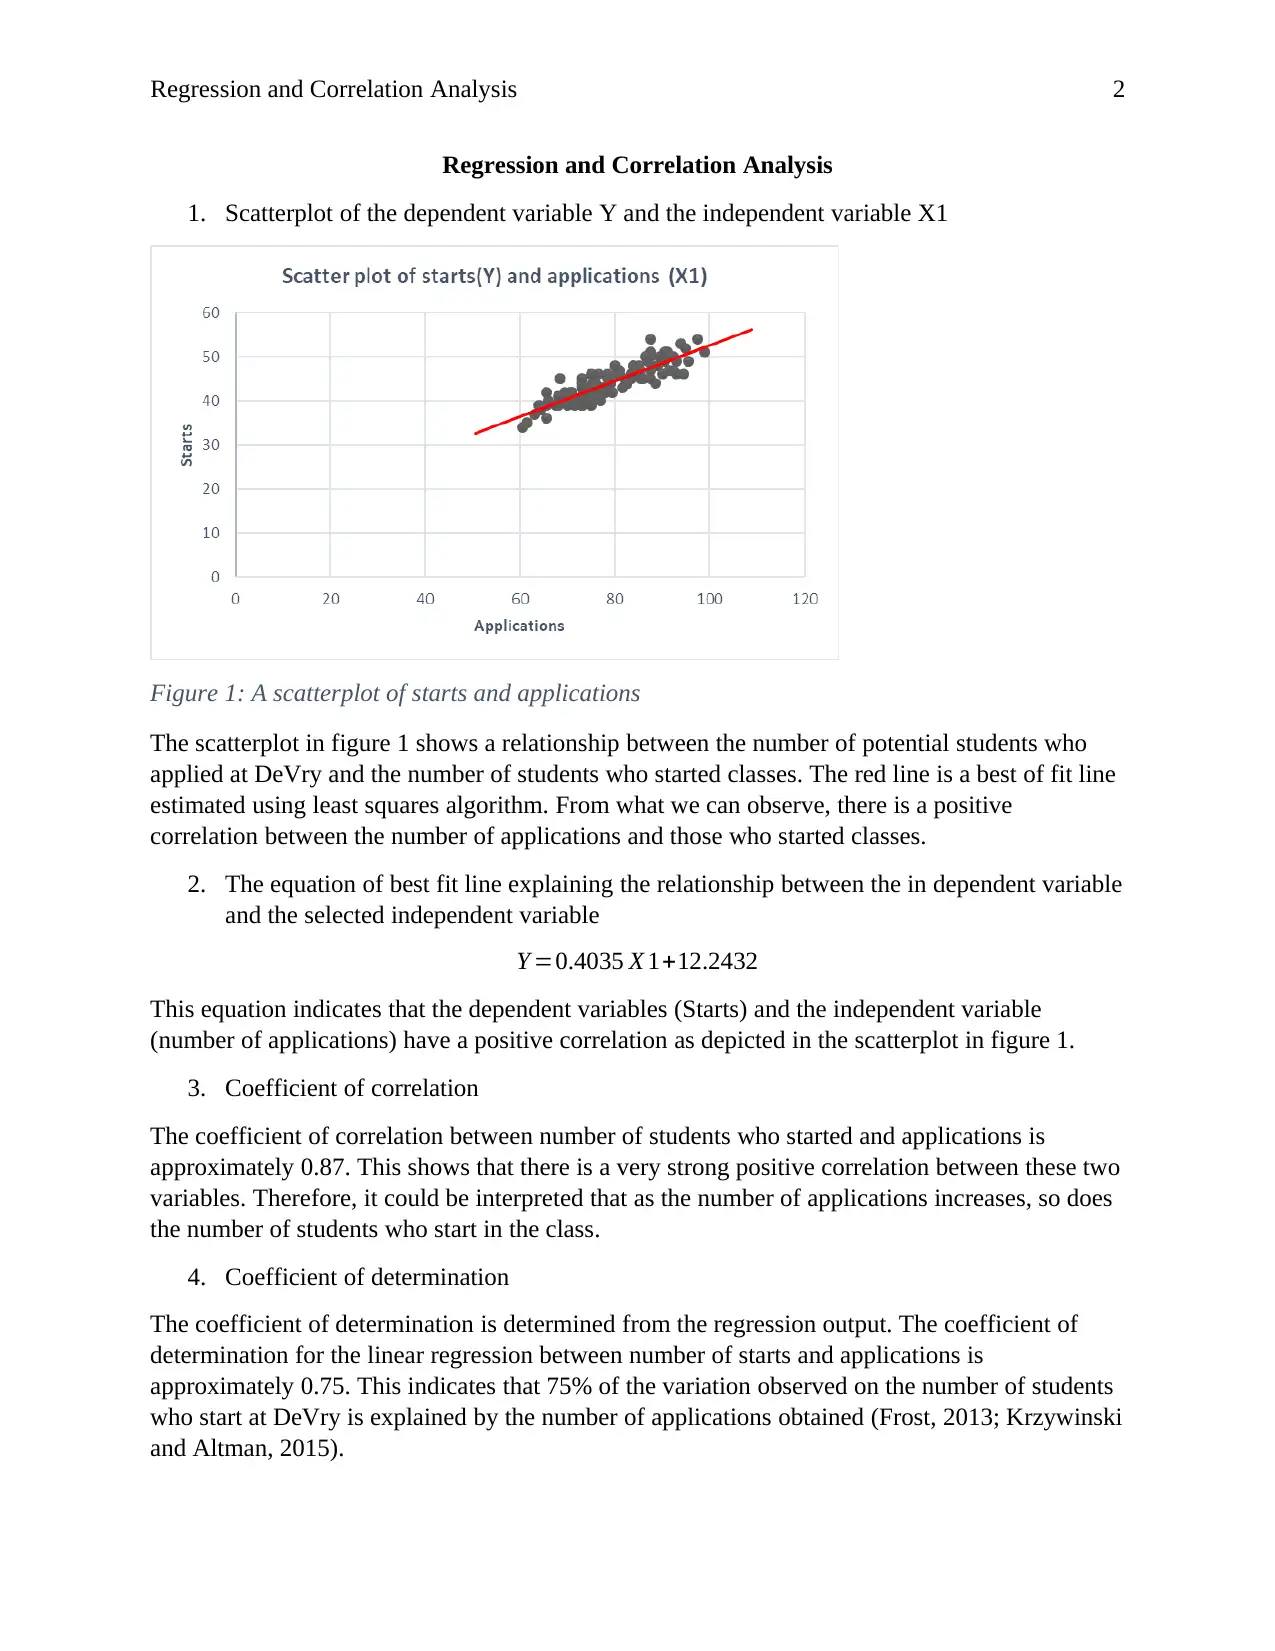
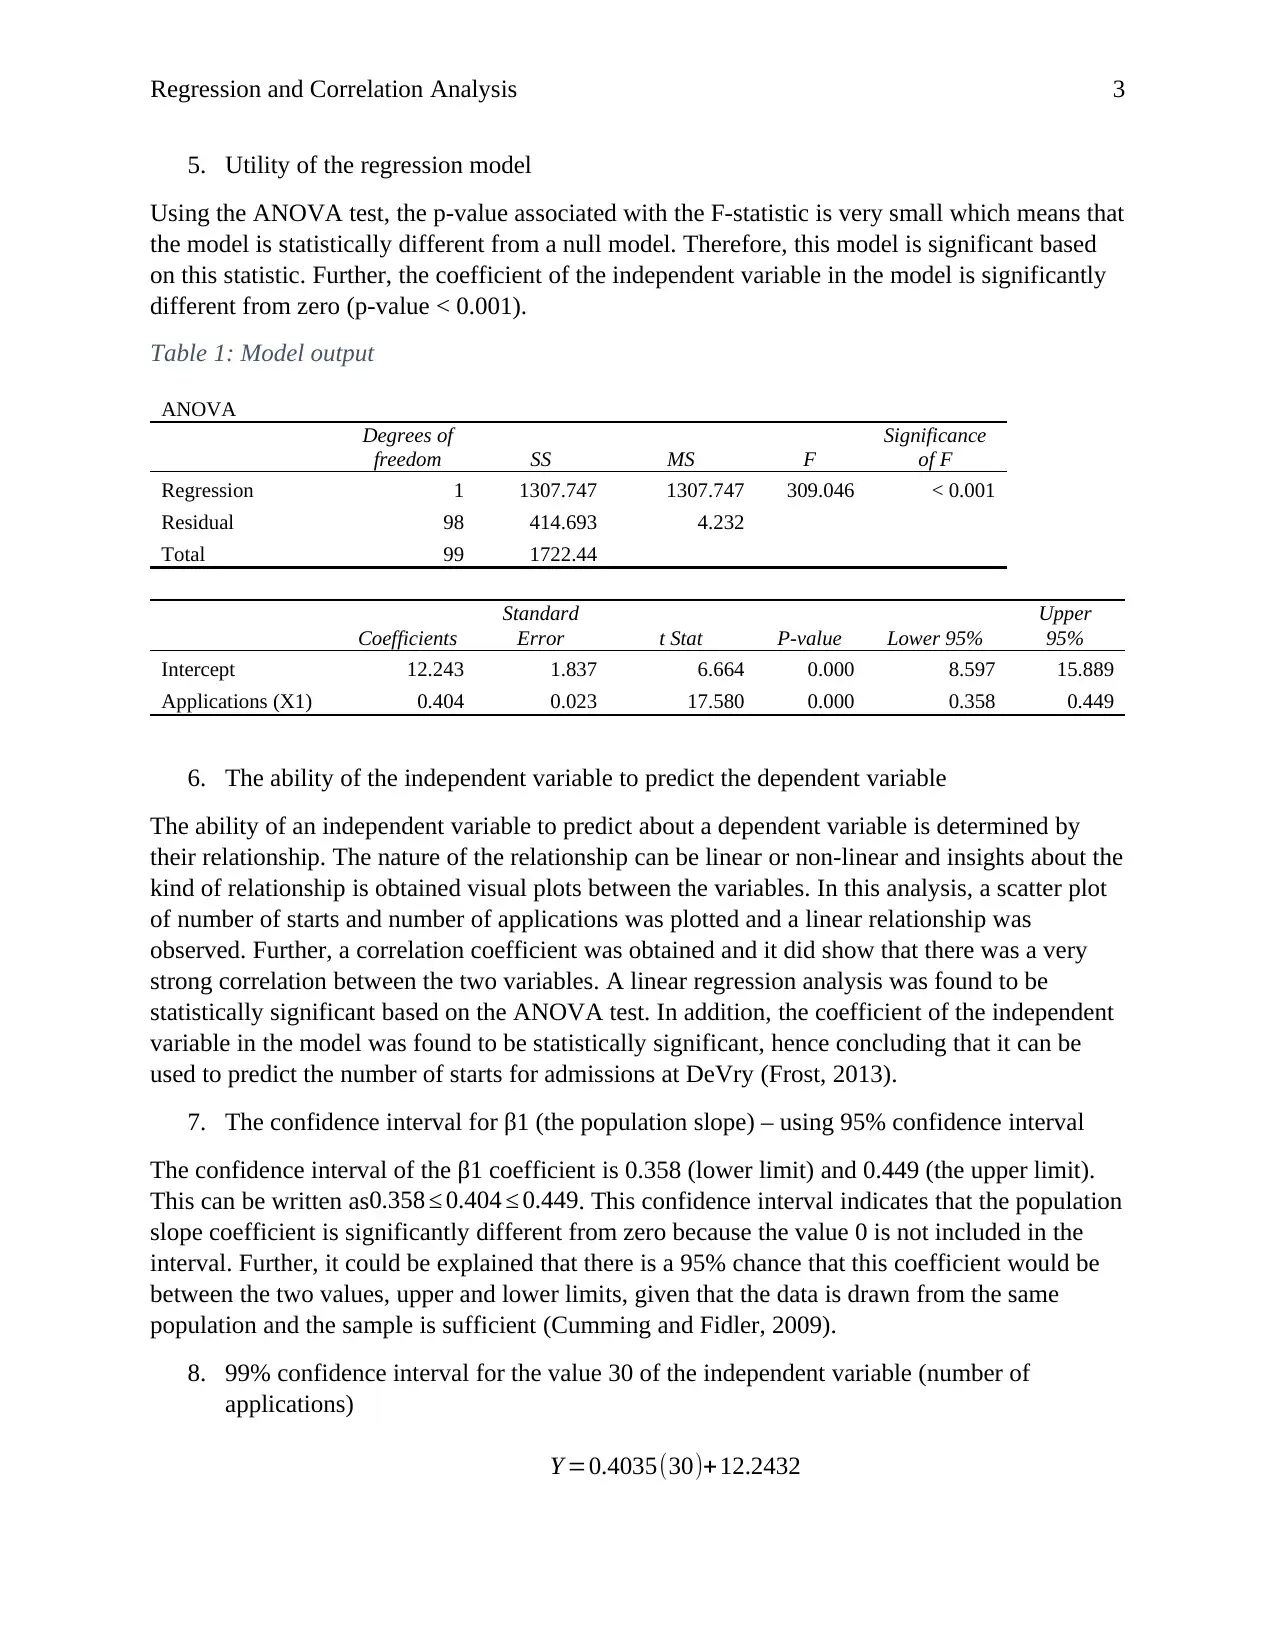
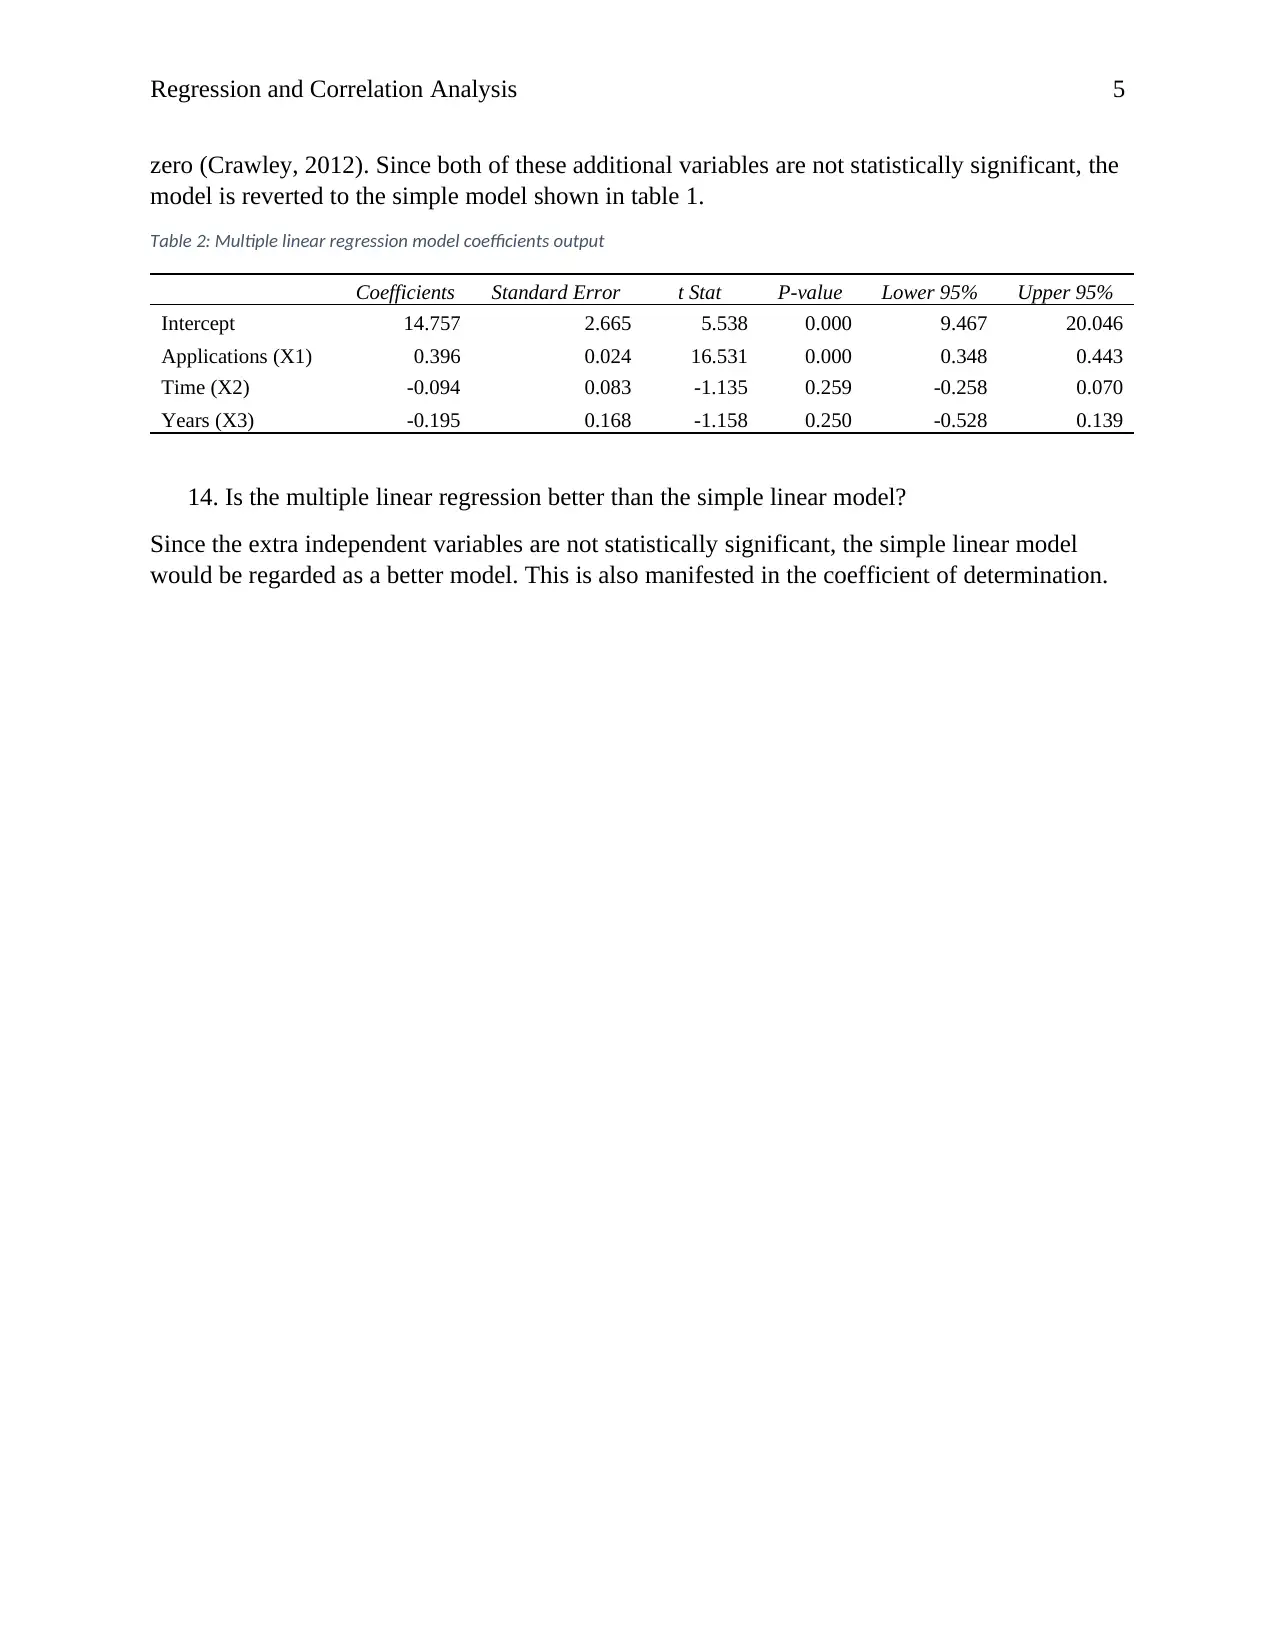
This report presents a regression and correlation analysis of DeVry admissions data, focusing on the relationship between the number of student applications and the number of students who started classes. The analysis includes a scatterplot visualization and the determination of the best-fit line equation. The coefficient of correlation and the coefficient of determination are calculated and interpreted to assess the strength and explanatory power of the relationship. The report also examines the utility of the regression model using ANOVA and t-tests, determining the statistical significance of the model and its independent variables. Confidence intervals for the slope coefficient and predicted values are calculated, providing insights into the reliability of the model's predictions. Furthermore, a multiple linear regression model is explored, comparing its performance to the simple linear model and assessing the significance of additional independent variables such as time spent with potential students and years of experience of the admissions advisors.
1 out of 6
Related Documents


Your All-in-One AI-Powered Toolkit for Academic Success.
+13062052269
info@desklib.com
Available 24*7 on WhatsApp / Email
![[object Object]](/_next/static/media/star-bottom.7253800d.svg)
Copyright © 2020–2026 A2Z Services. All Rights Reserved. Developed and managed by ZUCOL.