Decision Support Tools for Project Management - Desklib
VerifiedAdded on 2022/11/13
|8
|1604
|265
AI Summary
This document discusses decision support tools for project management, including activity-on-node, critical path, and project crashing. It provides a table of contents, figures, and tables, along with a brief summary of results. The document is relevant for students studying project management and related courses.
Contribute Materials
Your contribution can guide someone’s learning journey. Share your
documents today.
FIN5003
Major Assignment
Decision support tools
University Name:
Student Number:
Student Name:
Submission Date:
Major Assignment
Decision support tools
University Name:
Student Number:
Student Name:
Submission Date:
Secure Best Marks with AI Grader
Need help grading? Try our AI Grader for instant feedback on your assignments.
Table of Contents
A) Activity-on-node...................................................................................................................3
B) Identifying Critical Path, Early Start & Late Start, and Early Finish & Late Finish............4
C) Project crashing and Time-cost analysis...............................................................................5
Brief Summary of Results:.....................................................................................................7
List of Figures
Figure 1: Activity on node (AON) network diagram.................................................................3
Figure 2: Critical Path, Early Start & Late Start, and Early Finish & Late Finish....................5
List of Tables
Table 1: Manufacturer's estimations..........................................................................................3
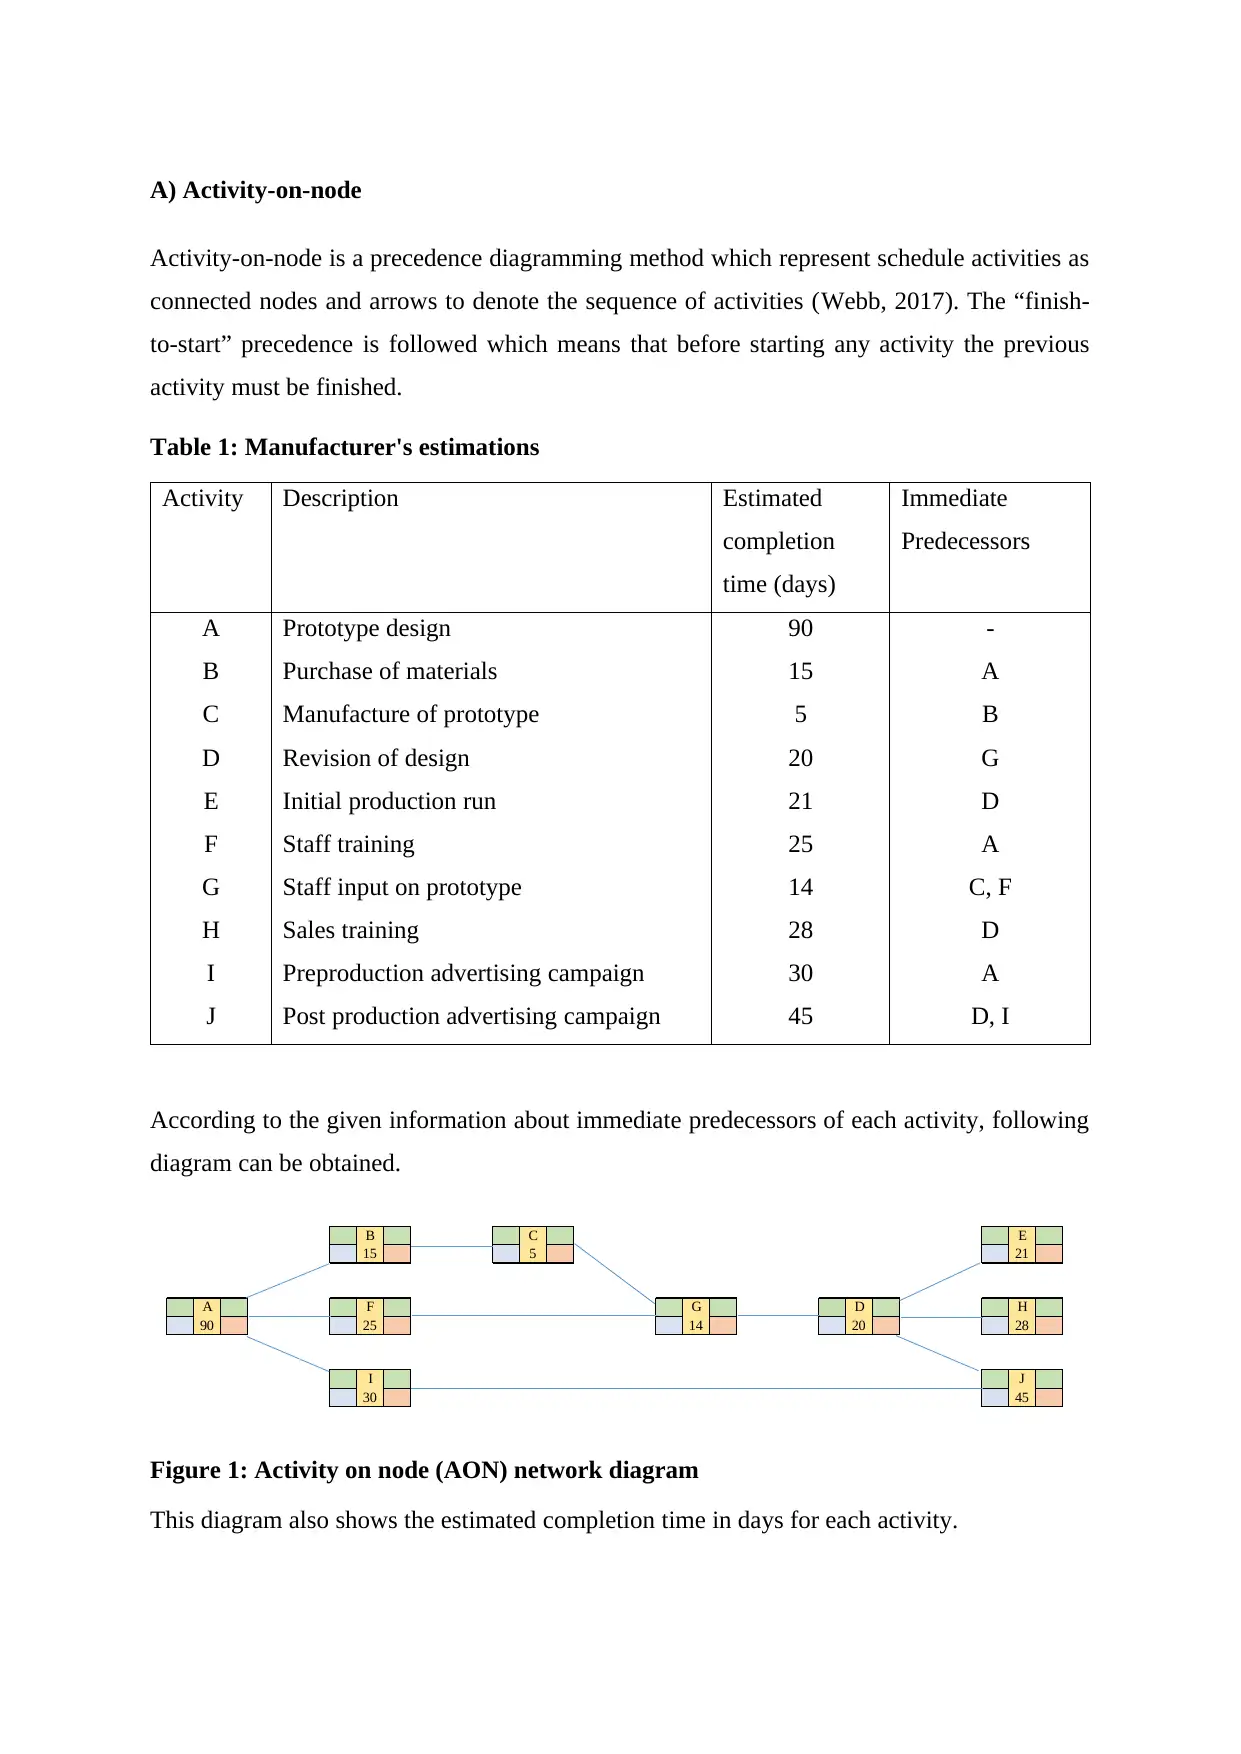
A) Activity-on-node
Activity-on-node is a precedence diagramming method which represent schedule activities as
connected nodes and arrows to denote the sequence of activities (Webb, 2017). The “finish-
to-start” precedence is followed which means that before starting any activity the previous
activity must be finished.
Table 1: Manufacturer's estimations
Activity Description Estimated
completion
time (days)
Immediate
Predecessors
A
B
C
D
E
F
G
H
I
J
Prototype design
Purchase of materials
Manufacture of prototype
Revision of design
Initial production run
Staff training
Staff input on prototype
Sales training
Preproduction advertising campaign
Post production advertising campaign
90
15
5
20
21
25
14
28
30
45
-
A
B
G
D
A
C, F
D
A
D, I
According to the given information about immediate predecessors of each activity, following
diagram can be obtained.
B C E
15 5 21
A F G D H
90 25 14 20 28
I J
30 45
Figure 1: Activity on node (AON) network diagram
This diagram also shows the estimated completion time in days for each activity.
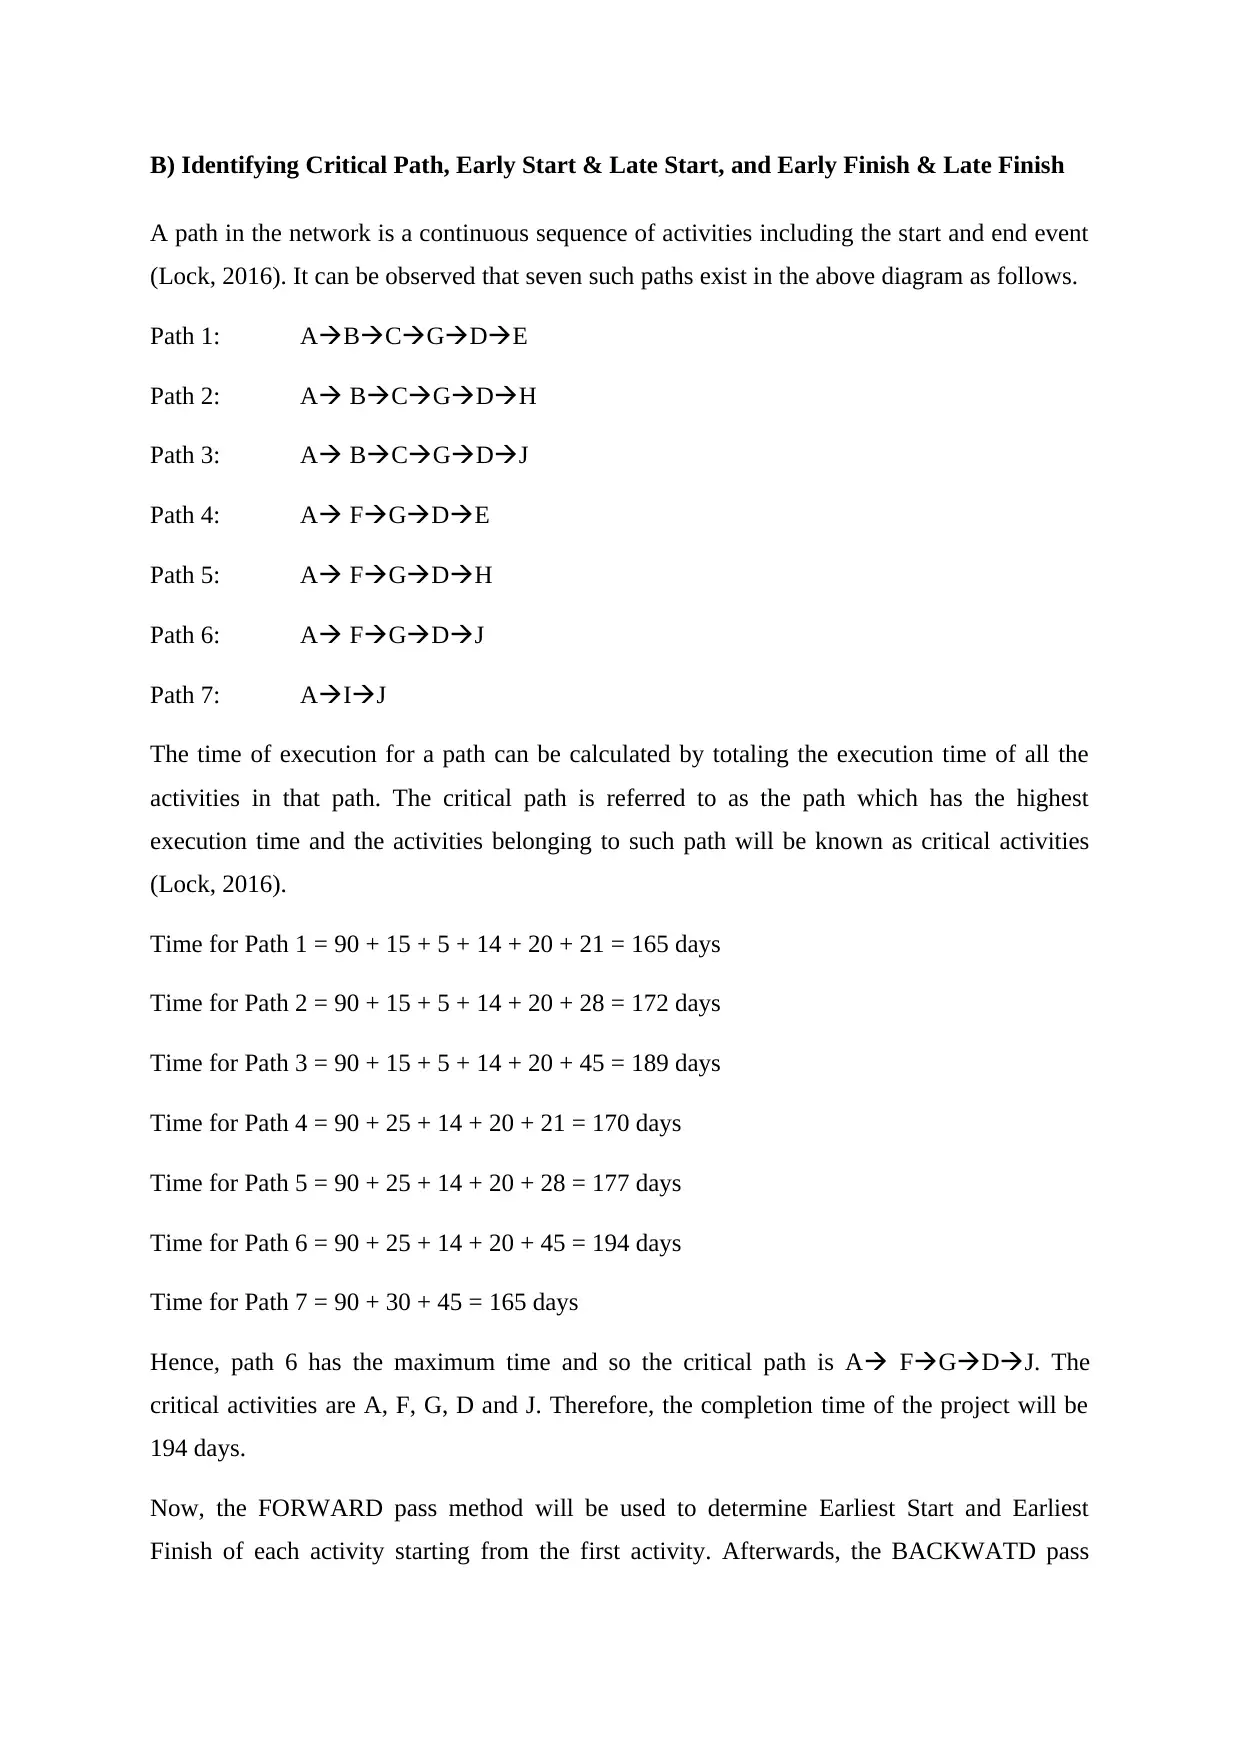
B) Identifying Critical Path, Early Start & Late Start, and Early Finish & Late Finish
A path in the network is a continuous sequence of activities including the start and end event
(Lock, 2016). It can be observed that seven such paths exist in the above diagram as follows.
Path 1: ABCGDE
Path 2: A BCGDH
Path 3: A BCGDJ
Path 4: A FGDE
Path 5: A FGDH
Path 6: A FGDJ
Path 7: AIJ
The time of execution for a path can be calculated by totaling the execution time of all the
activities in that path. The critical path is referred to as the path which has the highest
execution time and the activities belonging to such path will be known as critical activities
(Lock, 2016).
Time for Path 1 = 90 + 15 + 5 + 14 + 20 + 21 = 165 days
Time for Path 2 = 90 + 15 + 5 + 14 + 20 + 28 = 172 days
Time for Path 3 = 90 + 15 + 5 + 14 + 20 + 45 = 189 days
Time for Path 4 = 90 + 25 + 14 + 20 + 21 = 170 days
Time for Path 5 = 90 + 25 + 14 + 20 + 28 = 177 days
Time for Path 6 = 90 + 25 + 14 + 20 + 45 = 194 days
Time for Path 7 = 90 + 30 + 45 = 165 days
Hence, path 6 has the maximum time and so the critical path is A FGDJ. The
critical activities are A, F, G, D and J. Therefore, the completion time of the project will be
194 days.
Now, the FORWARD pass method will be used to determine Earliest Start and Earliest
Finish of each activity starting from the first activity. Afterwards, the BACKWATD pass
Secure Best Marks with AI Grader
Need help grading? Try our AI Grader for instant feedback on your assignments.
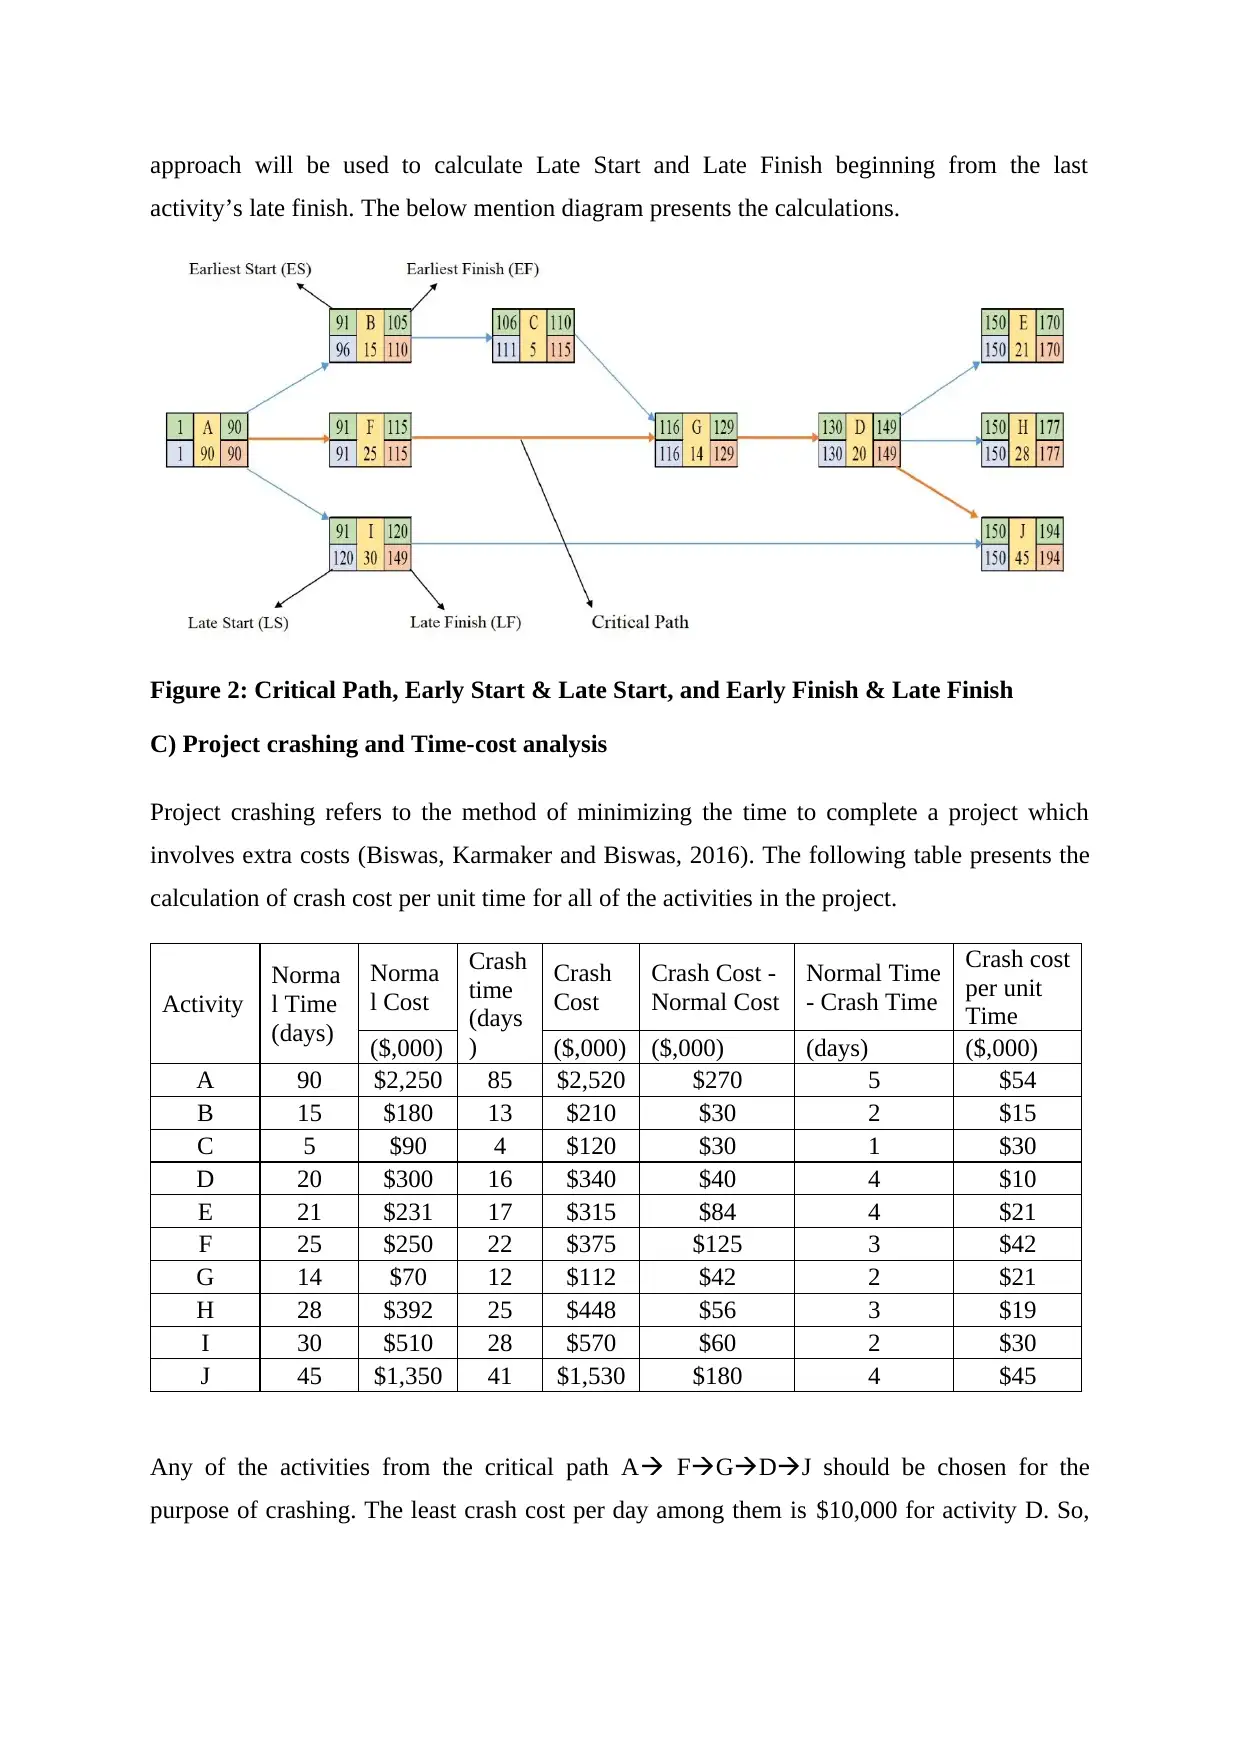
approach will be used to calculate Late Start and Late Finish beginning from the last
activity’s late finish. The below mention diagram presents the calculations.
Figure 2: Critical Path, Early Start & Late Start, and Early Finish & Late Finish
C) Project crashing and Time-cost analysis
Project crashing refers to the method of minimizing the time to complete a project which
involves extra costs (Biswas, Karmaker and Biswas, 2016). The following table presents the
calculation of crash cost per unit time for all of the activities in the project.
Activity
Norma
l Time
(days)
Norma
l Cost
Crash
time
(days
)
Crash
Cost
Crash Cost -
Normal Cost
Normal Time
- Crash Time
Crash cost
per unit
Time
($,000) ($,000) ($,000) (days) ($,000)
A 90 $2,250 85 $2,520 $270 5 $54
B 15 $180 13 $210 $30 2 $15
C 5 $90 4 $120 $30 1 $30
D 20 $300 16 $340 $40 4 $10
E 21 $231 17 $315 $84 4 $21
F 25 $250 22 $375 $125 3 $42
G 14 $70 12 $112 $42 2 $21
H 28 $392 25 $448 $56 3 $19
I 30 $510 28 $570 $60 2 $30
J 45 $1,350 41 $1,530 $180 4 $45
Any of the activities from the critical path A FGDJ should be chosen for the
purpose of crashing. The least crash cost per day among them is $10,000 for activity D. So,
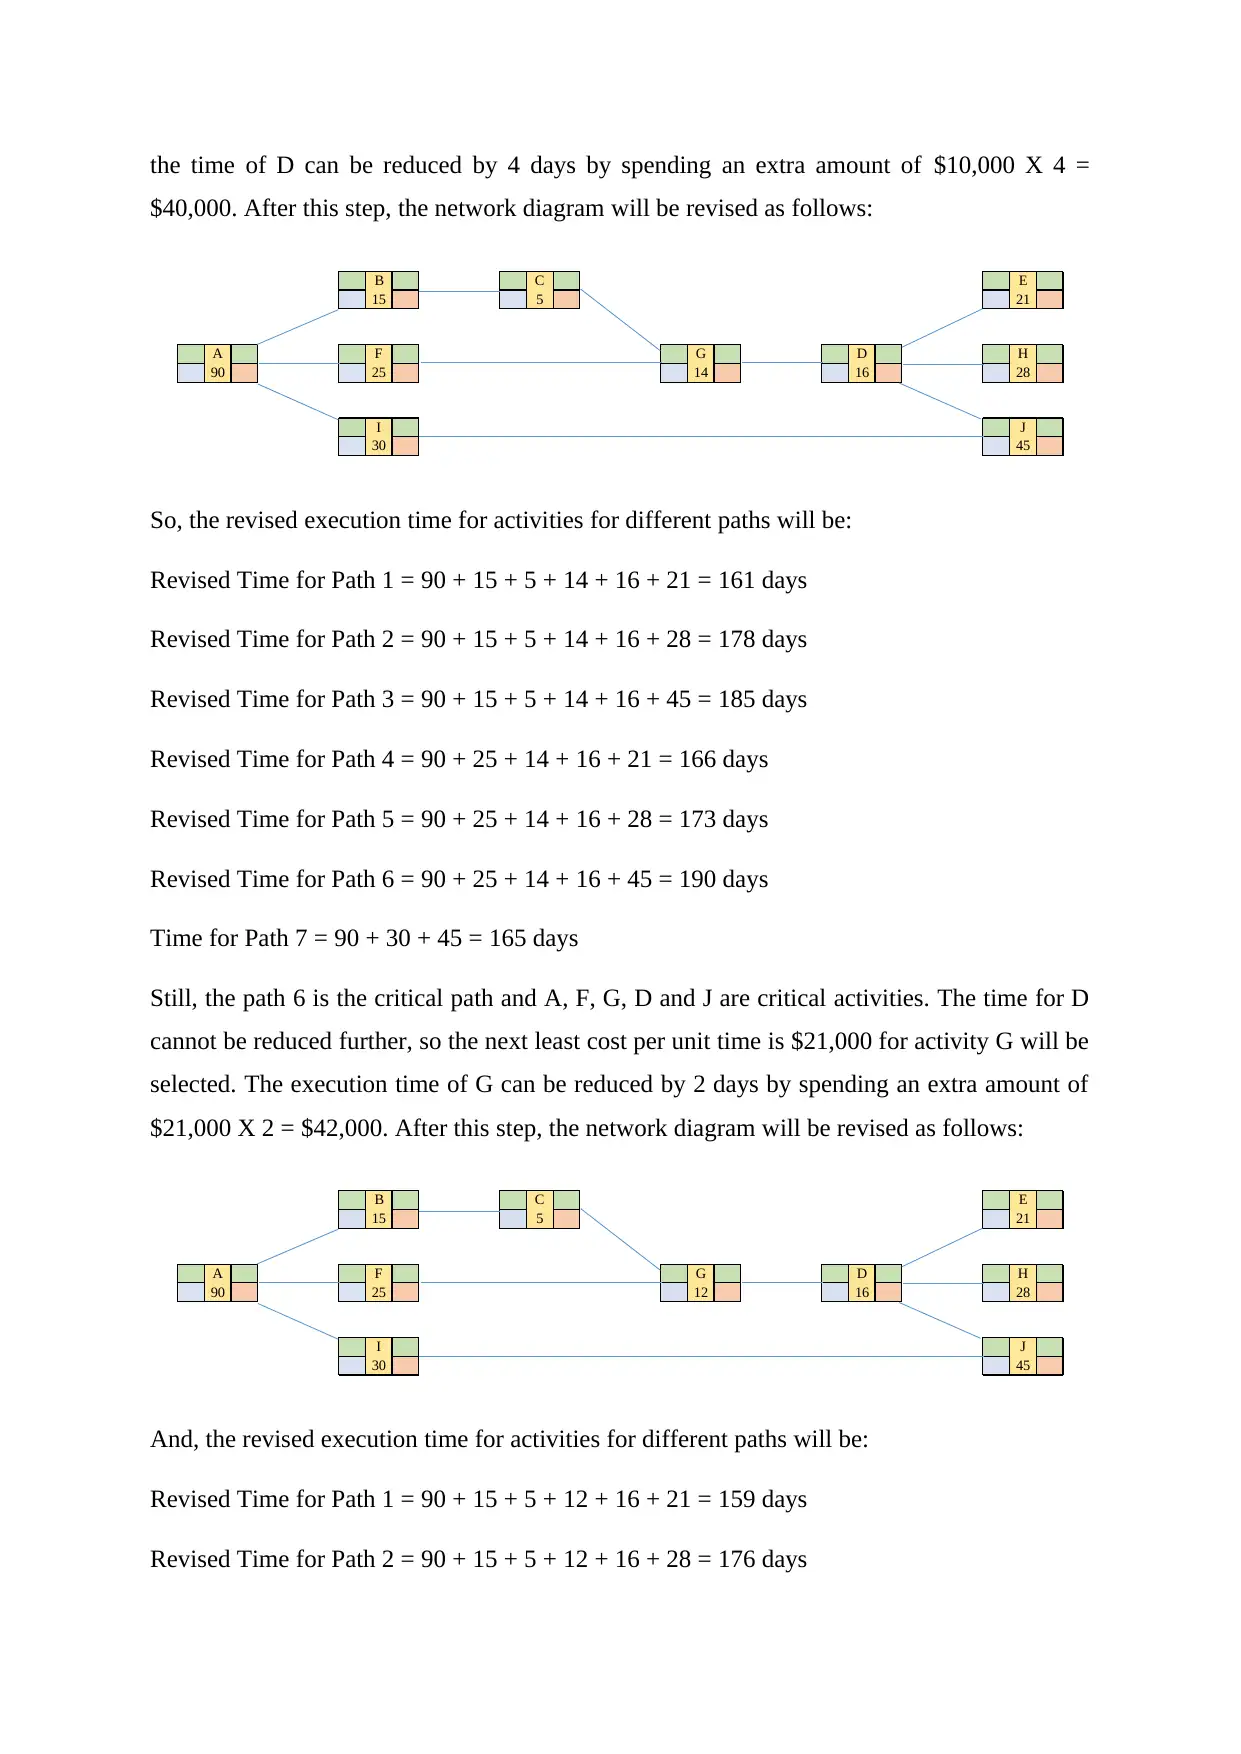
the time of D can be reduced by 4 days by spending an extra amount of $10,000 X 4 =
$40,000. After this step, the network diagram will be revised as follows:
B C E
15 5 21
A F G D H
90 25 14 16 28
I J
30 45
So, the revised execution time for activities for different paths will be:
Revised Time for Path 1 = 90 + 15 + 5 + 14 + 16 + 21 = 161 days
Revised Time for Path 2 = 90 + 15 + 5 + 14 + 16 + 28 = 178 days
Revised Time for Path 3 = 90 + 15 + 5 + 14 + 16 + 45 = 185 days
Revised Time for Path 4 = 90 + 25 + 14 + 16 + 21 = 166 days
Revised Time for Path 5 = 90 + 25 + 14 + 16 + 28 = 173 days
Revised Time for Path 6 = 90 + 25 + 14 + 16 + 45 = 190 days
Time for Path 7 = 90 + 30 + 45 = 165 days
Still, the path 6 is the critical path and A, F, G, D and J are critical activities. The time for D
cannot be reduced further, so the next least cost per unit time is $21,000 for activity G will be
selected. The execution time of G can be reduced by 2 days by spending an extra amount of
$21,000 X 2 = $42,000. After this step, the network diagram will be revised as follows:
B C E
15 5 21
A F G D H
90 25 12 16 28
I J
30 45
And, the revised execution time for activities for different paths will be:
Revised Time for Path 1 = 90 + 15 + 5 + 12 + 16 + 21 = 159 days
Revised Time for Path 2 = 90 + 15 + 5 + 12 + 16 + 28 = 176 days
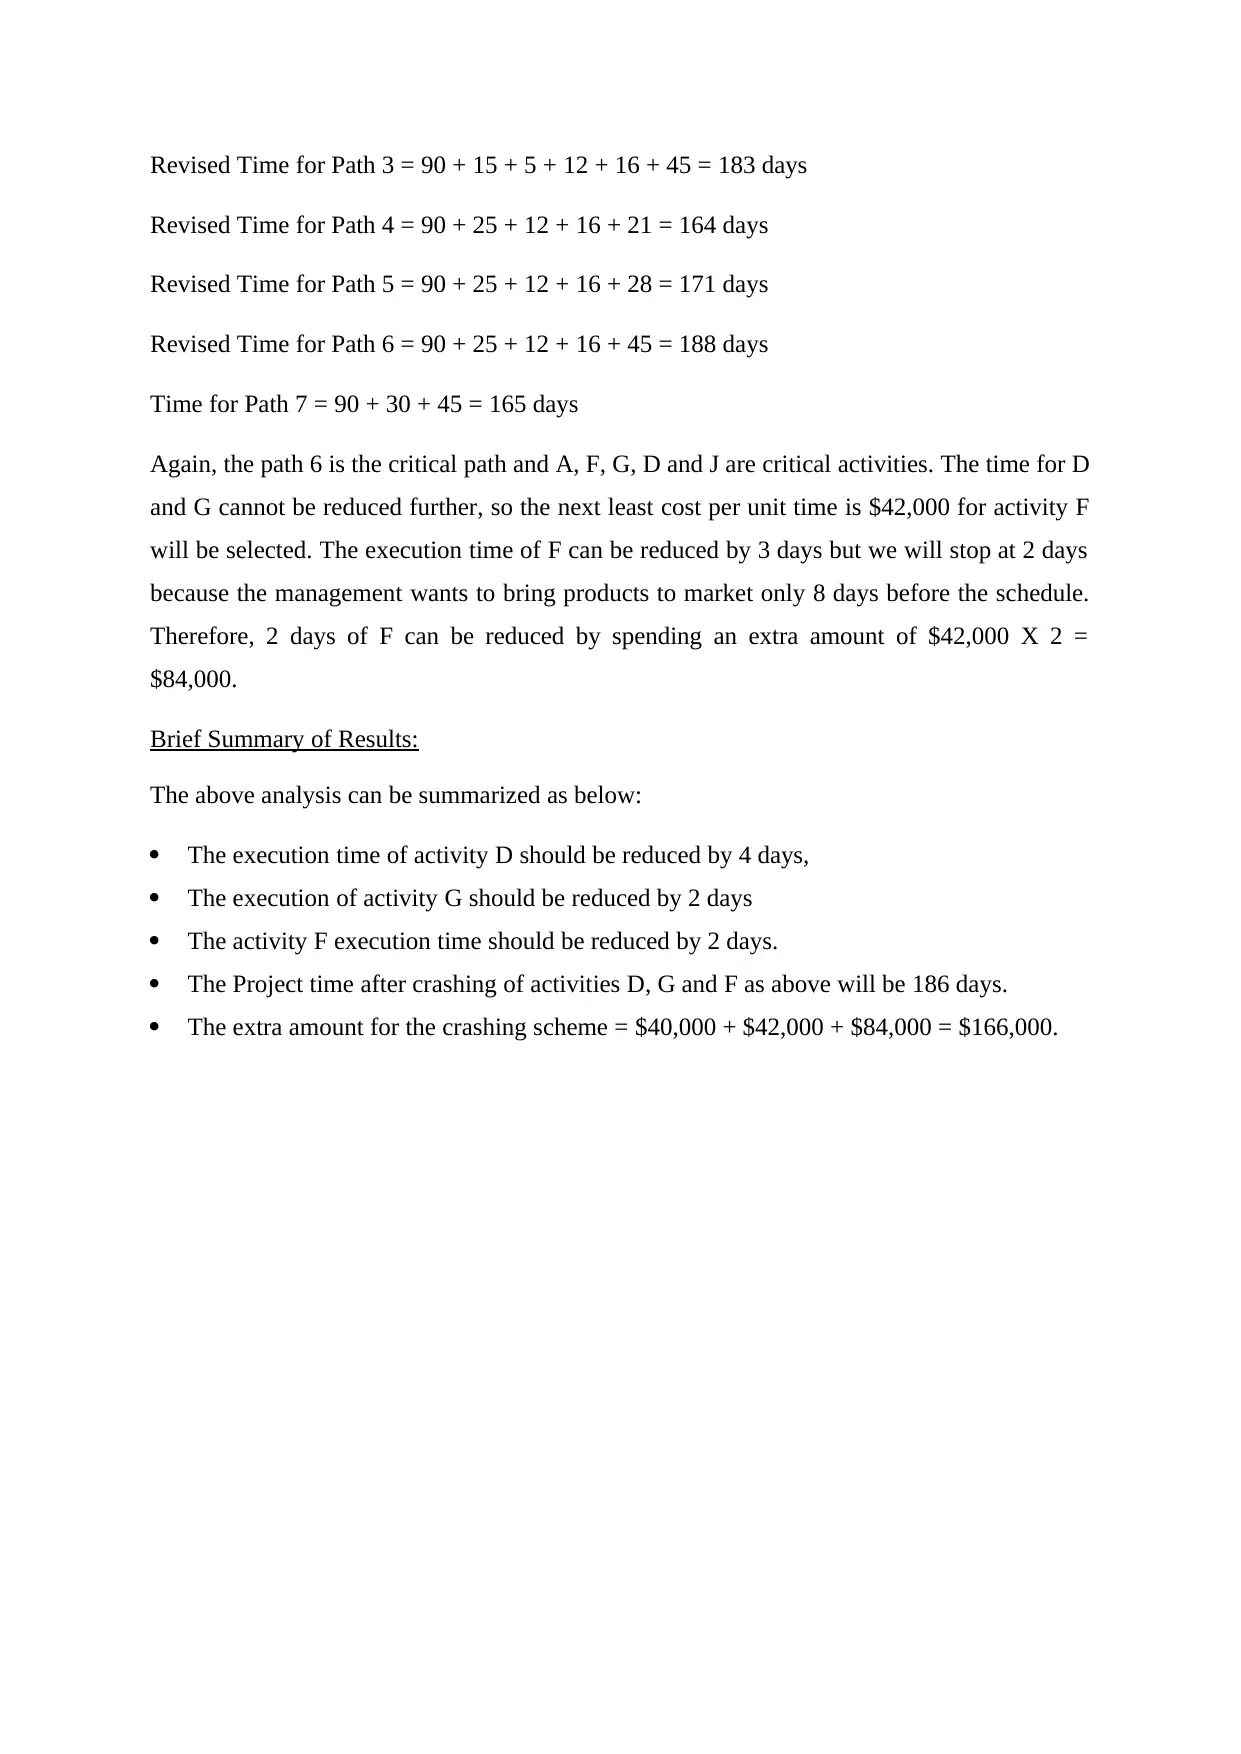
Revised Time for Path 3 = 90 + 15 + 5 + 12 + 16 + 45 = 183 days
Revised Time for Path 4 = 90 + 25 + 12 + 16 + 21 = 164 days
Revised Time for Path 5 = 90 + 25 + 12 + 16 + 28 = 171 days
Revised Time for Path 6 = 90 + 25 + 12 + 16 + 45 = 188 days
Time for Path 7 = 90 + 30 + 45 = 165 days
Again, the path 6 is the critical path and A, F, G, D and J are critical activities. The time for D
and G cannot be reduced further, so the next least cost per unit time is $42,000 for activity F
will be selected. The execution time of F can be reduced by 3 days but we will stop at 2 days
because the management wants to bring products to market only 8 days before the schedule.
Therefore, 2 days of F can be reduced by spending an extra amount of $42,000 X 2 =
$84,000.
Brief Summary of Results:
The above analysis can be summarized as below:
The execution time of activity D should be reduced by 4 days,
The execution of activity G should be reduced by 2 days
The activity F execution time should be reduced by 2 days.
The Project time after crashing of activities D, G and F as above will be 186 days.
The extra amount for the crashing scheme = $40,000 + $42,000 + $84,000 = $166,000.
Paraphrase This Document
Need a fresh take? Get an instant paraphrase of this document with our AI Paraphraser

References
Webb, A. (2017) Project management for successful product innovation. Routledge.
Lock, D. (2016) Project Management in Construction. Routledge.
Biswas, S.K., Karmaker, C.L. and Biswas, T.K. (2016) Time-Cost Trade-Off Analysis in a
Construction Project Problem: Case Study. International Journal of Computational
Engineering Research (IJCER), 6(10).
1 out of 8
Related Documents


Your All-in-One AI-Powered Toolkit for Academic Success.
+13062052269
info@desklib.com
Available 24*7 on WhatsApp / Email
![[object Object]](/_next/static/media/star-bottom.7253800d.svg)
Unlock your academic potential
© 2024 | Zucol Services PVT LTD | All rights reserved.