finance and ratio analysis
VerifiedAdded on 2022/12/16
|15
|2795
|2
AI Summary
Contribute Materials
Your contribution can guide someone’s learning journey. Share your
documents today.
FINANCE AND RATIO ANALYSIS
Secure Best Marks with AI Grader
Need help grading? Try our AI Grader for instant feedback on your assignments.
Table of Contents
Introduction......................................................................................................................................3
a. Financial analysis of both companies..........................................................................................4
b. Industry Analysis.......................................................................................................................12
c. Recommendation.......................................................................................................................12
Conclusion.....................................................................................................................................13
References......................................................................................................................................14
Appendices....................................................................................................................................15
Introduction
Financial ratios are made using mathematical attributes subtracted from tax summaries to obtain
important data about an organization. The figures obtained on an organization's budget
summaries - cash flow, payroll description and revenue breakdown - are used to quantify and
analyze liquidity, impact, development, margins, profitability, production, evaluation and this is
just the beginning. .
Various cash allocations and significant concessions from competitors are planned to recognize
whether an organization is performing better or worse than the business norm. For example, the
inter-agency resource profit comparison helps an auditor or financial assistant find out which
organization is making the most of its resources.
a. Financial analysis of both companies
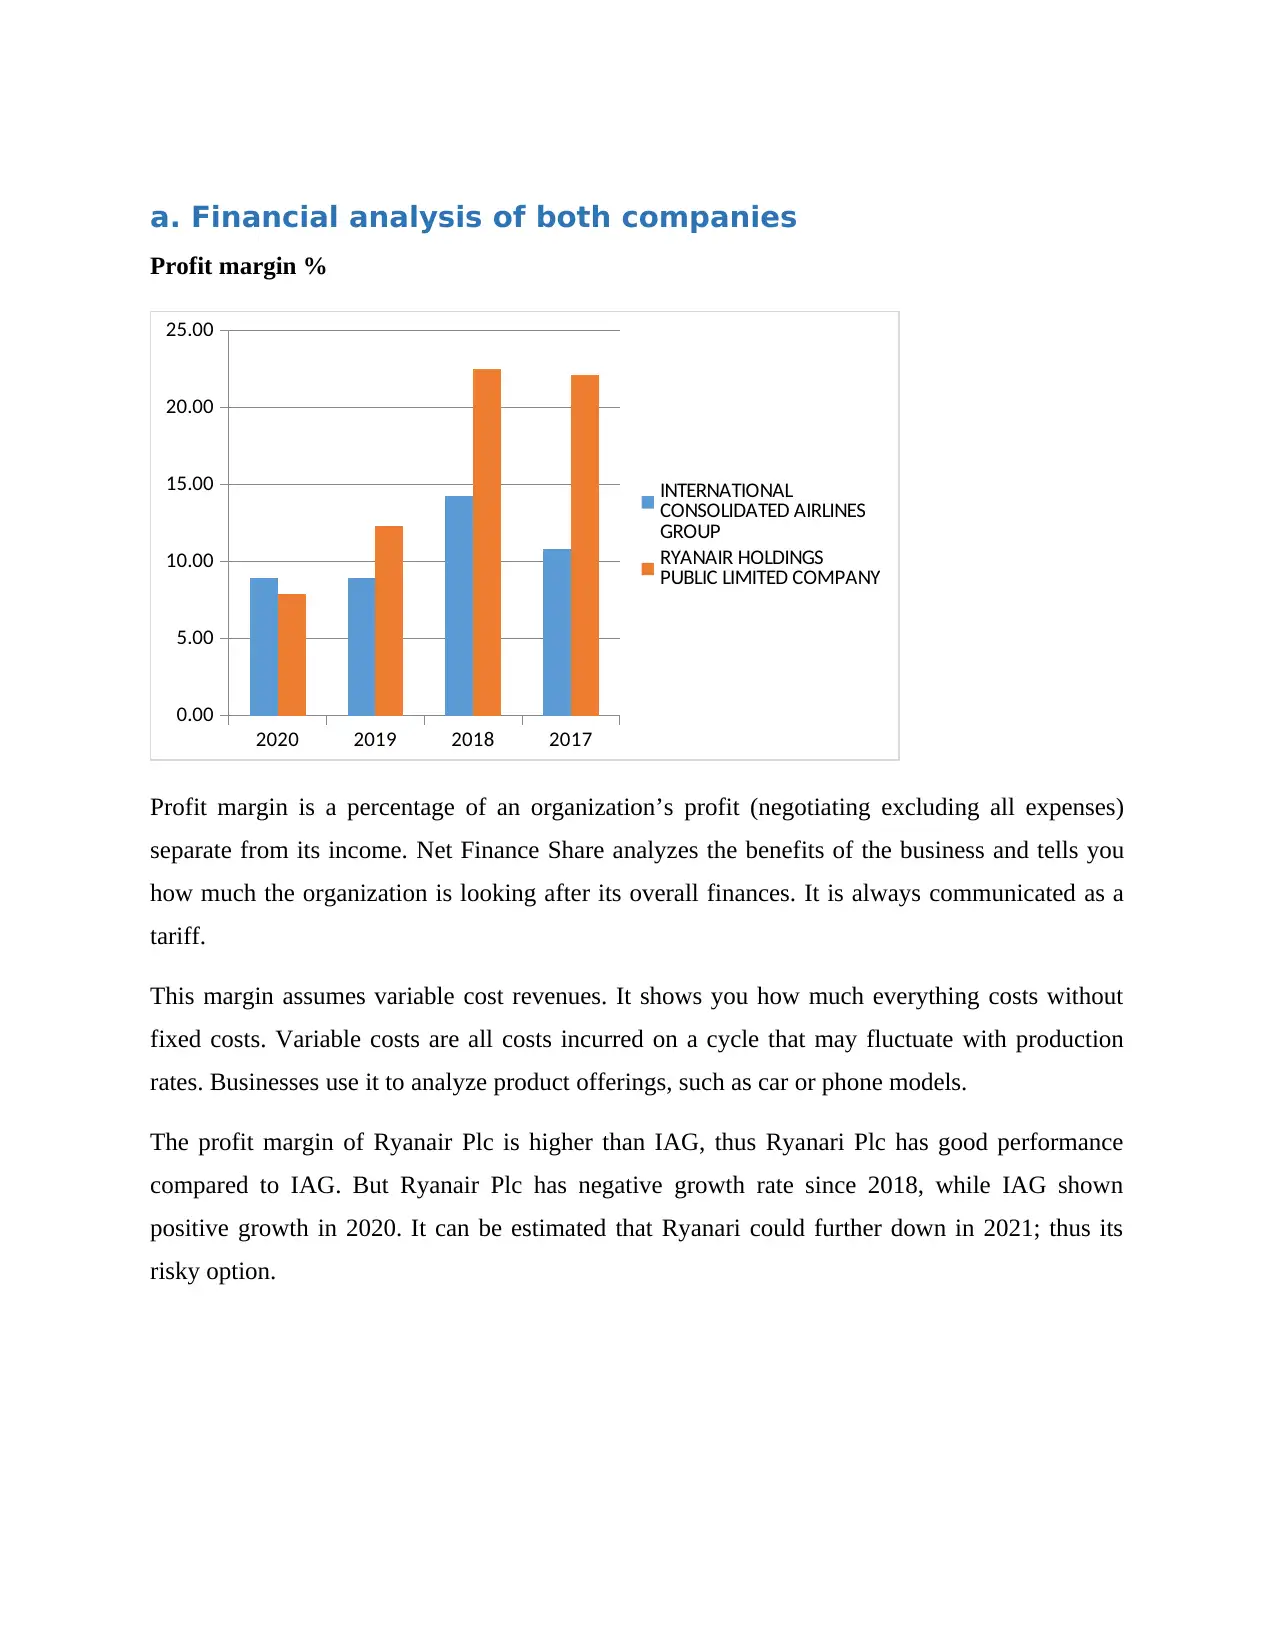
Profit margin %
2020 2019 2018 2017
0.00
5.00
10.00
15.00
20.00
25.00
INTERNATIONAL
CONSOLIDATED AIRLINES
GROUP
RYANAIR HOLDINGS
PUBLIC LIMITED COMPANY
Profit margin is a percentage of an organization’s profit (negotiating excluding all expenses)
separate from its income. Net Finance Share analyzes the benefits of the business and tells you
how much the organization is looking after its overall finances. It is always communicated as a
tariff.
This margin assumes variable cost revenues. It shows you how much everything costs without
fixed costs. Variable costs are all costs incurred on a cycle that may fluctuate with production
rates. Businesses use it to analyze product offerings, such as car or phone models.
The profit margin of Ryanair Plc is higher than IAG, thus Ryanari Plc has good performance
compared to IAG. But Ryanair Plc has negative growth rate since 2018, while IAG shown
positive growth in 2020. It can be estimated that Ryanari could further down in 2021; thus its
risky option.
Secure Best Marks with AI Grader
Need help grading? Try our AI Grader for instant feedback on your assignments.
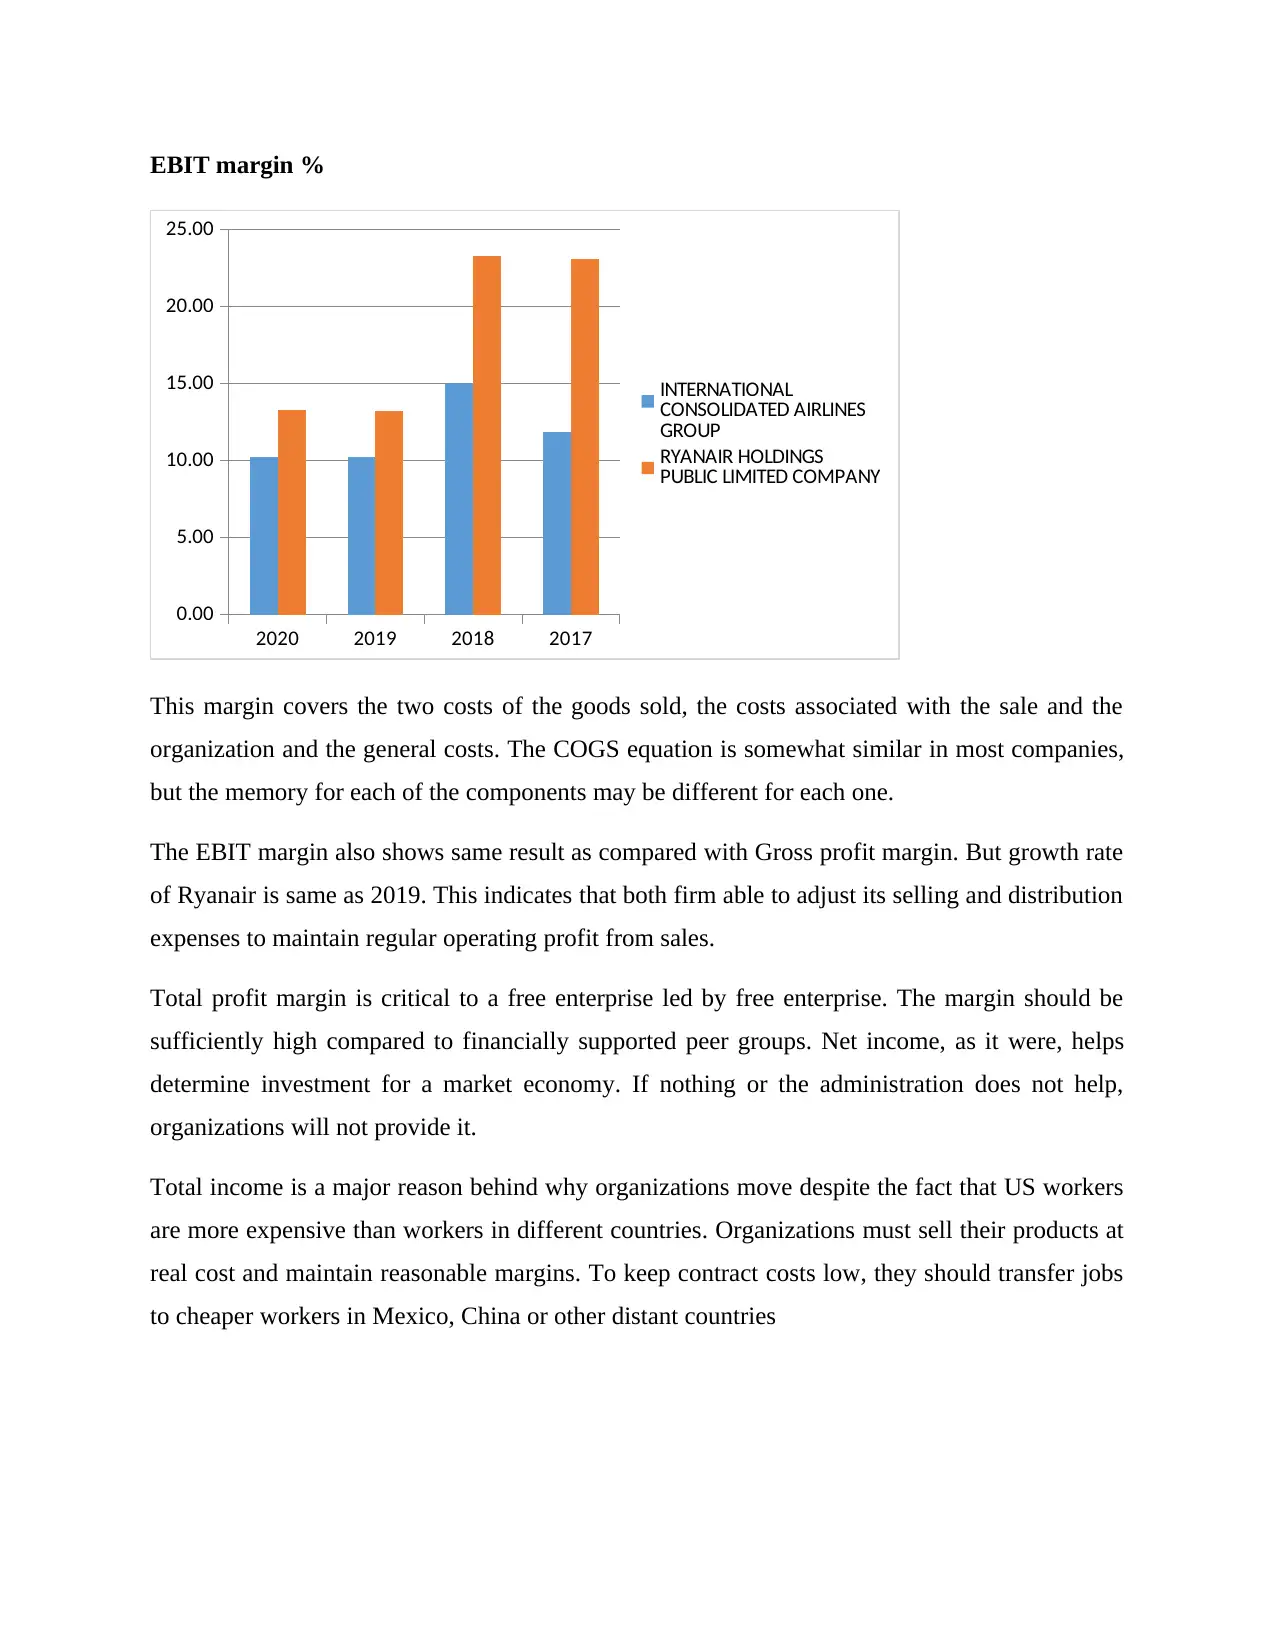
EBIT margin %
2020 2019 2018 2017
0.00
5.00
10.00
15.00
20.00
25.00
INTERNATIONAL
CONSOLIDATED AIRLINES
GROUP
RYANAIR HOLDINGS
PUBLIC LIMITED COMPANY
This margin covers the two costs of the goods sold, the costs associated with the sale and the
organization and the general costs. The COGS equation is somewhat similar in most companies,
but the memory for each of the components may be different for each one.
The EBIT margin also shows same result as compared with Gross profit margin. But growth rate
of Ryanair is same as 2019. This indicates that both firm able to adjust its selling and distribution
expenses to maintain regular operating profit from sales.
Total profit margin is critical to a free enterprise led by free enterprise. The margin should be
sufficiently high compared to financially supported peer groups. Net income, as it were, helps
determine investment for a market economy. If nothing or the administration does not help,
organizations will not provide it.
Total income is a major reason behind why organizations move despite the fact that US workers
are more expensive than workers in different countries. Organizations must sell their products at
real cost and maintain reasonable margins. To keep contract costs low, they should transfer jobs
to cheaper workers in Mexico, China or other distant countries
This total revenue can help organizations perform evaluation procedures for items or
administrations. Organizations base their costs on the cost of delivering their items and the
amount of profit they are trying to transform.
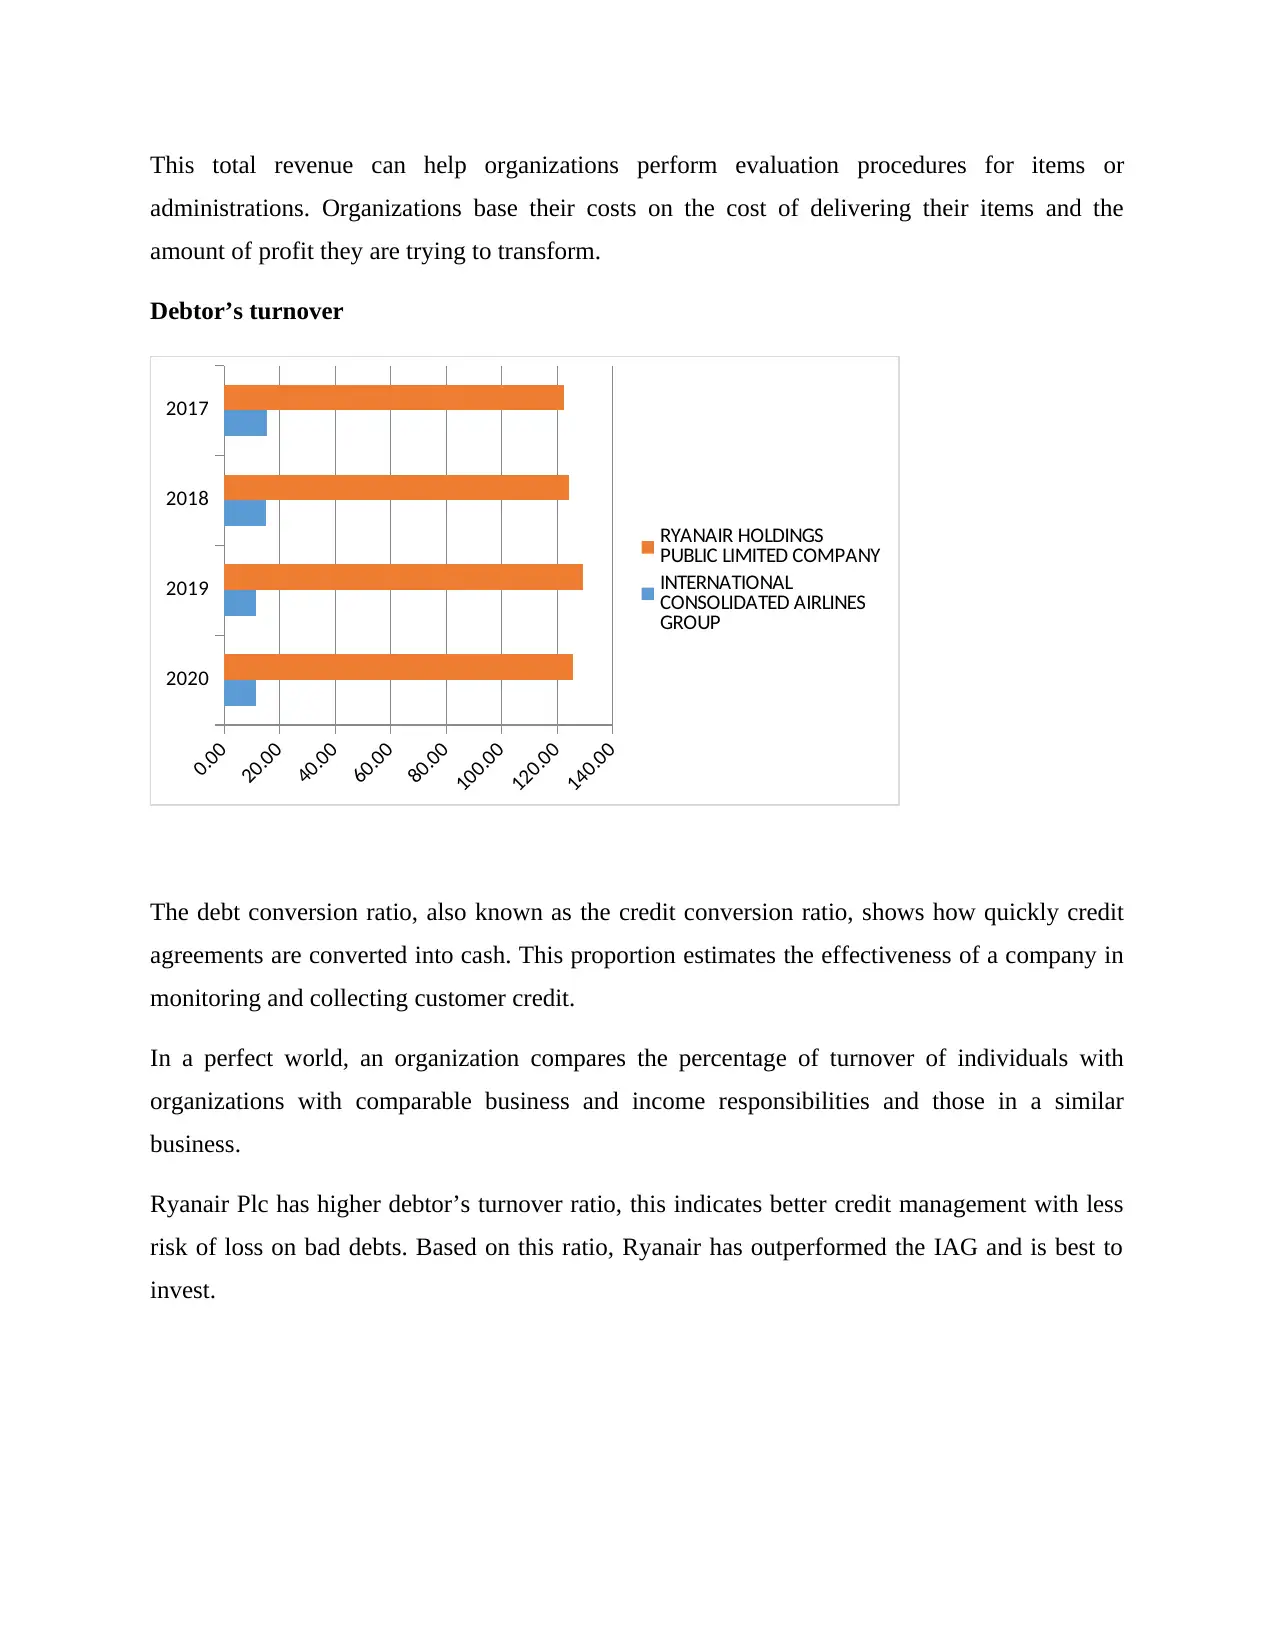
Debtor’s turnover
2020
2019
2018
2017
0.00
20.00
40.00
60.00
80.00
100.00
120.00
140.00
RYANAIR HOLDINGS
PUBLIC LIMITED COMPANY
INTERNATIONAL
CONSOLIDATED AIRLINES
GROUP
The debt conversion ratio, also known as the credit conversion ratio, shows how quickly credit
agreements are converted into cash. This proportion estimates the effectiveness of a company in
monitoring and collecting customer credit.
In a perfect world, an organization compares the percentage of turnover of individuals with
organizations with comparable business and income responsibilities and those in a similar
business.
Ryanair Plc has higher debtor’s turnover ratio, this indicates better credit management with less
risk of loss on bad debts. Based on this ratio, Ryanair has outperformed the IAG and is best to
invest.
administrations. Organizations base their costs on the cost of delivering their items and the
amount of profit they are trying to transform.
Debtor’s turnover
2020
2019
2018
2017
0.00
20.00
40.00
60.00
80.00
100.00
120.00
140.00
RYANAIR HOLDINGS
PUBLIC LIMITED COMPANY
INTERNATIONAL
CONSOLIDATED AIRLINES
GROUP
The debt conversion ratio, also known as the credit conversion ratio, shows how quickly credit
agreements are converted into cash. This proportion estimates the effectiveness of a company in
monitoring and collecting customer credit.
In a perfect world, an organization compares the percentage of turnover of individuals with
organizations with comparable business and income responsibilities and those in a similar
business.
Ryanair Plc has higher debtor’s turnover ratio, this indicates better credit management with less
risk of loss on bad debts. Based on this ratio, Ryanair has outperformed the IAG and is best to
invest.
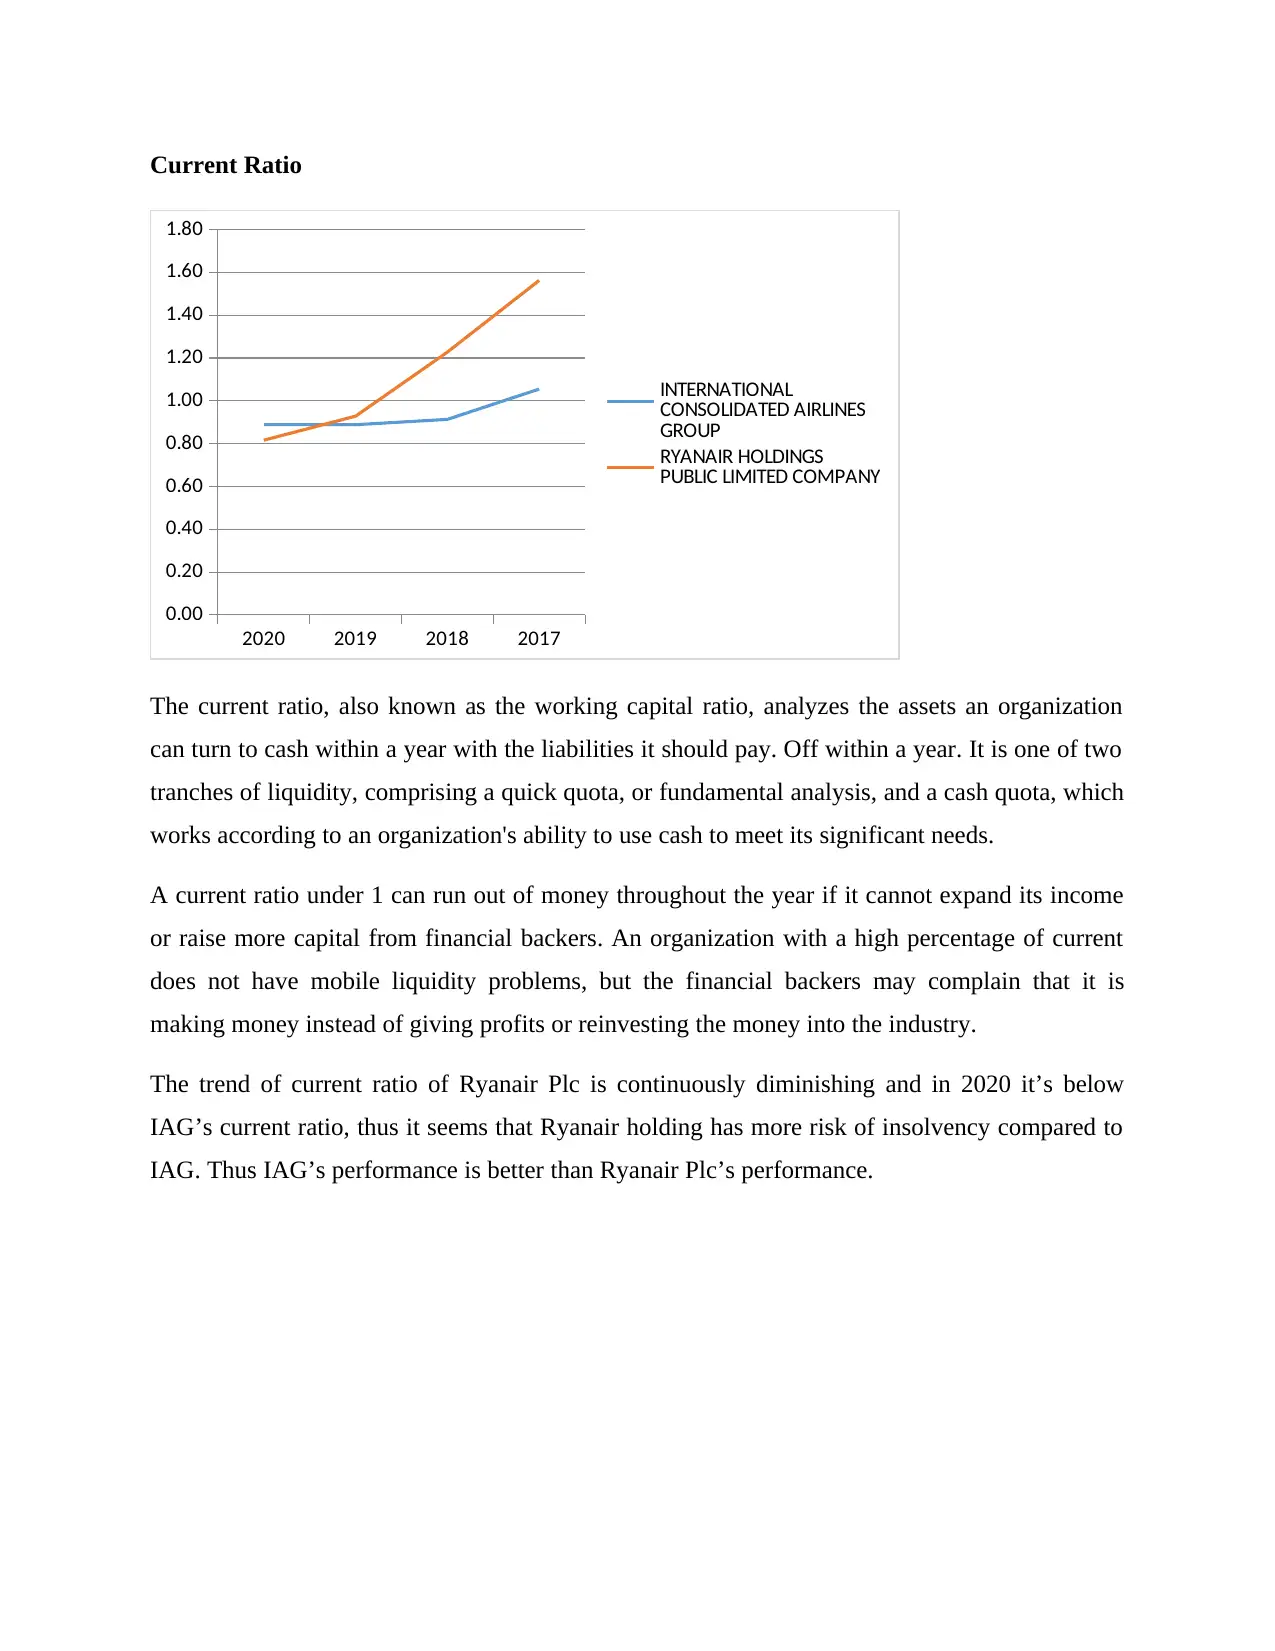
Current Ratio
2020 2019 2018 2017
0.00
0.20
0.40
0.60
0.80
1.00
1.20
1.40
1.60
1.80
INTERNATIONAL
CONSOLIDATED AIRLINES
GROUP
RYANAIR HOLDINGS
PUBLIC LIMITED COMPANY
The current ratio, also known as the working capital ratio, analyzes the assets an organization
can turn to cash within a year with the liabilities it should pay. Off within a year. It is one of two
tranches of liquidity, comprising a quick quota, or fundamental analysis, and a cash quota, which
works according to an organization's ability to use cash to meet its significant needs.
A current ratio under 1 can run out of money throughout the year if it cannot expand its income
or raise more capital from financial backers. An organization with a high percentage of current
does not have mobile liquidity problems, but the financial backers may complain that it is
making money instead of giving profits or reinvesting the money into the industry.
The trend of current ratio of Ryanair Plc is continuously diminishing and in 2020 it’s below
IAG’s current ratio, thus it seems that Ryanair holding has more risk of insolvency compared to
IAG. Thus IAG’s performance is better than Ryanair Plc’s performance.
Paraphrase This Document
Need a fresh take? Get an instant paraphrase of this document with our AI Paraphraser
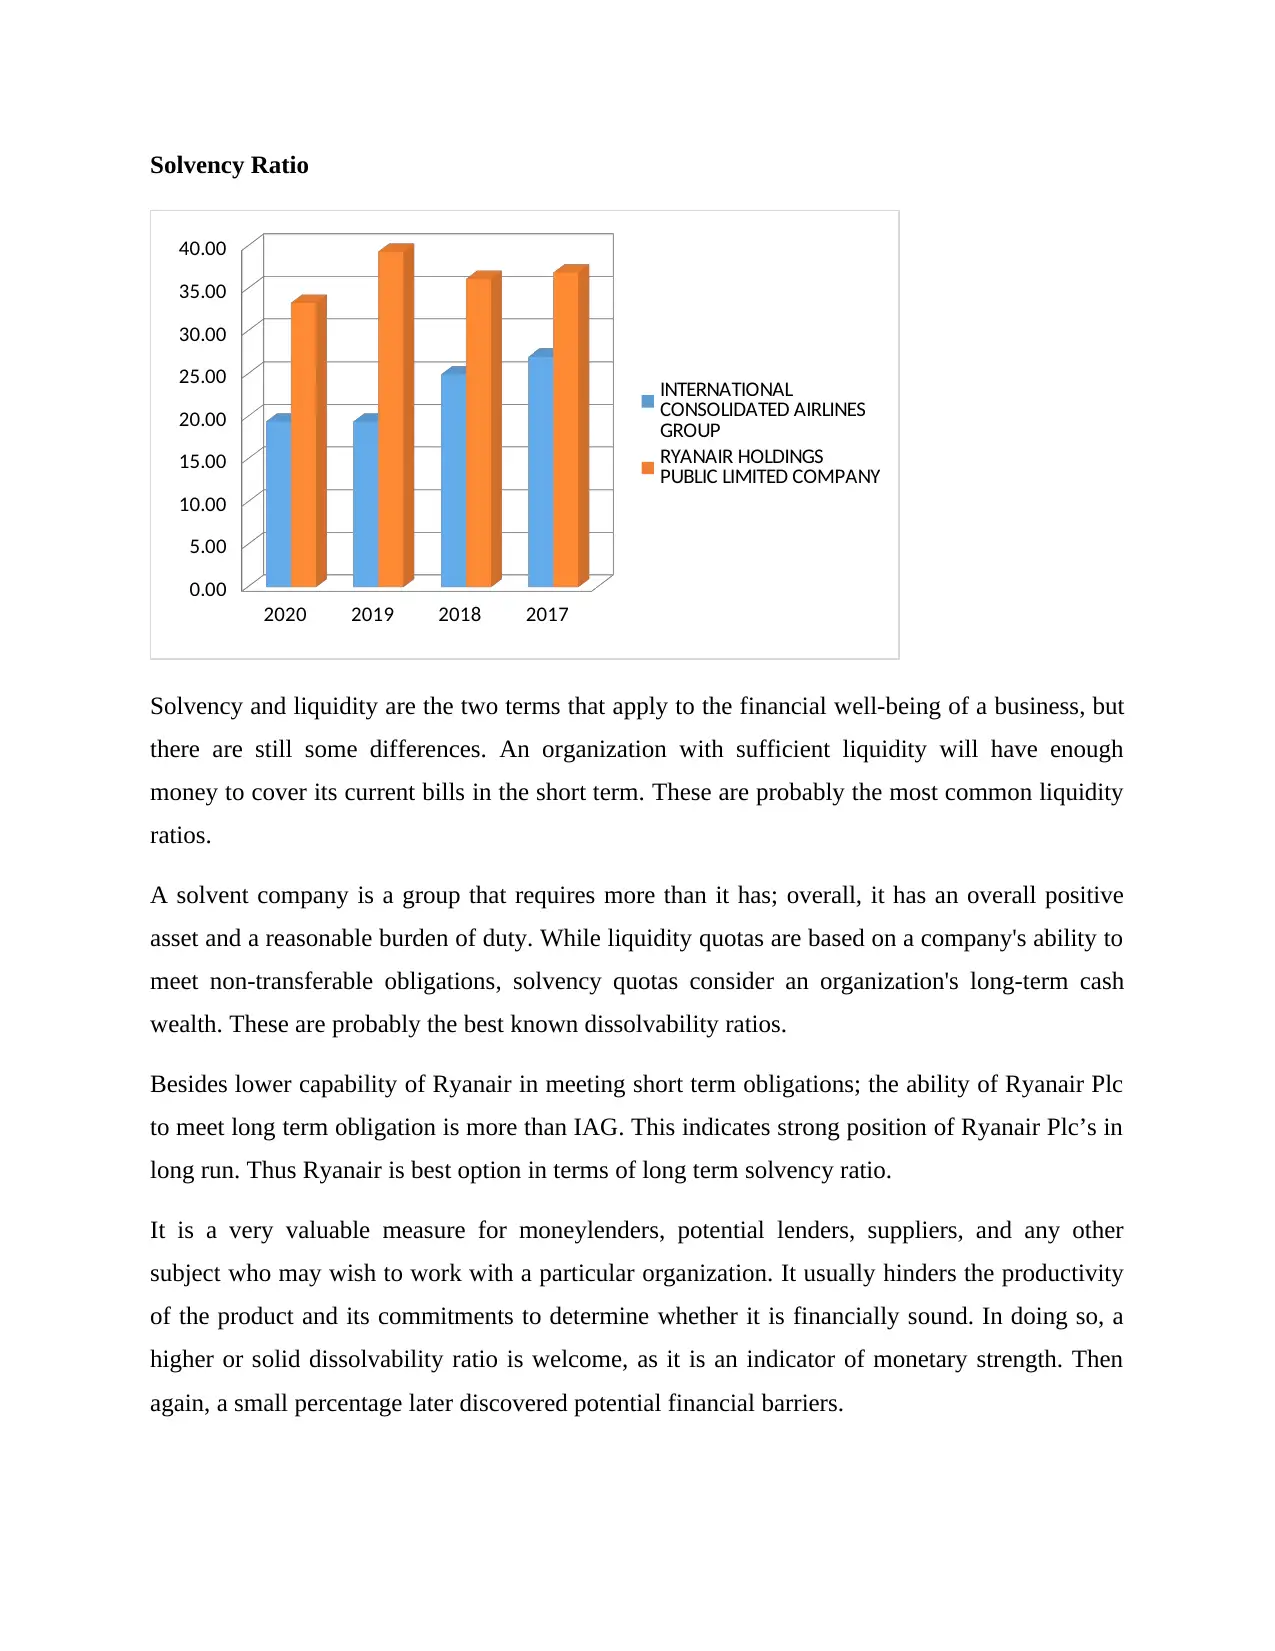
Solvency Ratio
2020 2019 2018 2017
0.00
5.00
10.00
15.00
20.00
25.00
30.00
35.00
40.00
INTERNATIONAL
CONSOLIDATED AIRLINES
GROUP
RYANAIR HOLDINGS
PUBLIC LIMITED COMPANY
Solvency and liquidity are the two terms that apply to the financial well-being of a business, but
there are still some differences. An organization with sufficient liquidity will have enough
money to cover its current bills in the short term. These are probably the most common liquidity
ratios.
A solvent company is a group that requires more than it has; overall, it has an overall positive
asset and a reasonable burden of duty. While liquidity quotas are based on a company's ability to
meet non-transferable obligations, solvency quotas consider an organization's long-term cash
wealth. These are probably the best known dissolvability ratios.
Besides lower capability of Ryanair in meeting short term obligations; the ability of Ryanair Plc
to meet long term obligation is more than IAG. This indicates strong position of Ryanair Plc’s in
long run. Thus Ryanair is best option in terms of long term solvency ratio.
It is a very valuable measure for moneylenders, potential lenders, suppliers, and any other
subject who may wish to work with a particular organization. It usually hinders the productivity
of the product and its commitments to determine whether it is financially sound. In doing so, a
higher or solid dissolvability ratio is welcome, as it is an indicator of monetary strength. Then
again, a small percentage later discovered potential financial barriers.
While percentage dissolvability is a useful measure, there is one category where the signal is
missing. It does not take into account an organization's ability to access new sources of long-term
funding, such as funds or equity bonds. For such an explanation, it should be used closely with
various types of analysis to give a complete picture of company confidentiality.
Before a person or association donates or lends money to an organization, it should be ensured
that the material in question can be distributed in the long term. In this way, interesting
participants use dissolvability ratios to measure an organization’s ability to focus on its long-
term responsibilities.
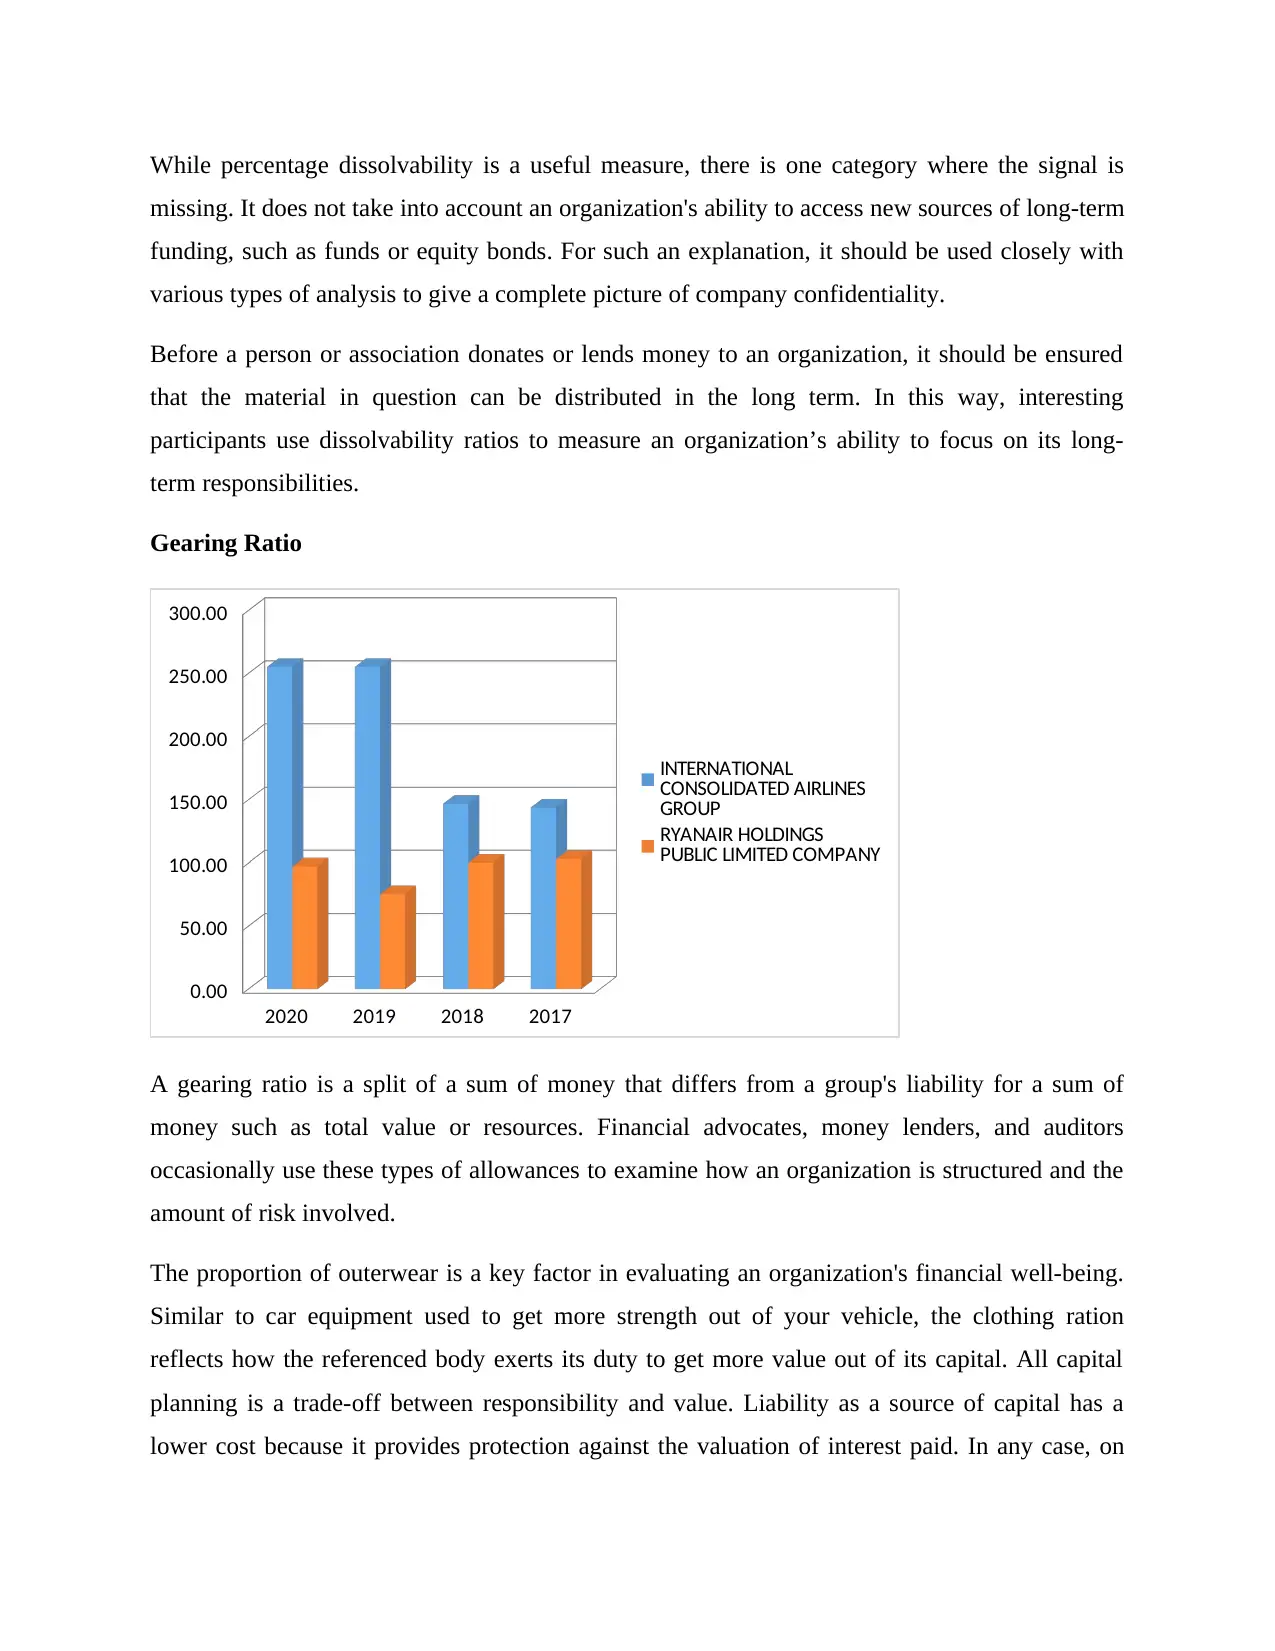
Gearing Ratio
2020 2019 2018 2017
0.00
50.00
100.00
150.00
200.00
250.00
300.00
INTERNATIONAL
CONSOLIDATED AIRLINES
GROUP
RYANAIR HOLDINGS
PUBLIC LIMITED COMPANY
A gearing ratio is a split of a sum of money that differs from a group's liability for a sum of
money such as total value or resources. Financial advocates, money lenders, and auditors
occasionally use these types of allowances to examine how an organization is structured and the
amount of risk involved.
The proportion of outerwear is a key factor in evaluating an organization's financial well-being.
Similar to car equipment used to get more strength out of your vehicle, the clothing ration
reflects how the referenced body exerts its duty to get more value out of its capital. All capital
planning is a trade-off between responsibility and value. Liability as a source of capital has a
lower cost because it provides protection against the valuation of interest paid. In any case, on
missing. It does not take into account an organization's ability to access new sources of long-term
funding, such as funds or equity bonds. For such an explanation, it should be used closely with
various types of analysis to give a complete picture of company confidentiality.
Before a person or association donates or lends money to an organization, it should be ensured
that the material in question can be distributed in the long term. In this way, interesting
participants use dissolvability ratios to measure an organization’s ability to focus on its long-
term responsibilities.
Gearing Ratio
2020 2019 2018 2017
0.00
50.00
100.00
150.00
200.00
250.00
300.00
INTERNATIONAL
CONSOLIDATED AIRLINES
GROUP
RYANAIR HOLDINGS
PUBLIC LIMITED COMPANY
A gearing ratio is a split of a sum of money that differs from a group's liability for a sum of
money such as total value or resources. Financial advocates, money lenders, and auditors
occasionally use these types of allowances to examine how an organization is structured and the
amount of risk involved.
The proportion of outerwear is a key factor in evaluating an organization's financial well-being.
Similar to car equipment used to get more strength out of your vehicle, the clothing ration
reflects how the referenced body exerts its duty to get more value out of its capital. All capital
planning is a trade-off between responsibility and value. Liability as a source of capital has a
lower cost because it provides protection against the valuation of interest paid. In any case, on
the other hand, an additional obligation entails liabilities that have been included in books and is
also an urgent source of the so-called monetary or liquid risk. Part of the outerwear estimates this
impact of tariffs on the capital structure and also attempts to examine the monetary risk posed by
the additional burden.
Lenders can use equipment ratios to choose whether or not to extend credit, and lenders can use
them to decide whether to invest resources in a business. A higher percentage for most indicates
a higher monetary risk.
While there is no fixed proportion of equipment that reflects a positive or negative organized
group, the general rules suggest that somewhere in the range of 25% and a half is best, unless the
need arises group on more compliance obligations.
The impact of changing the survey can increase a group’s cash group value allowances if you
look in the long run. In any case, as a one-time account, the proportions of the establishment may
not be of any real importance.
Similarly, it is important to remember that while results from high equipment ratios show a high
financial impact, they do not usually mean that an organization is in financial trouble. While
companies with higher proportions of equipment tend to distribute more dangerous and
controlled products, for example, service organizations tend to operate with higher levels of
responsibility.
Monopoly organizations will consistently have a higher percentage of equipment because the
monetary risk is measured by their strong position in the industry. In addition, capital-focused
businesses, such as assembly, routinely spend expensive and expensive hardware, which requires
higher proportions of equipment.
Hence, it's critical to consider the business that the organization is working in while dissecting its
outfitting proportion, on the grounds that various enterprises have various norms.
The gearing ratio indicates that IAG has raised majority of funds through taking loan from banks
or any other sources. This indicates that potential risk of IAG is more than Ryanair Plc.
Additional to this; tax benefit of IAG is more than that of Ryanair. Thus, if investor is risk taker,
than IAG is no doubt best option for him.
Secure Best Marks with AI Grader
Need help grading? Try our AI Grader for instant feedback on your assignments.
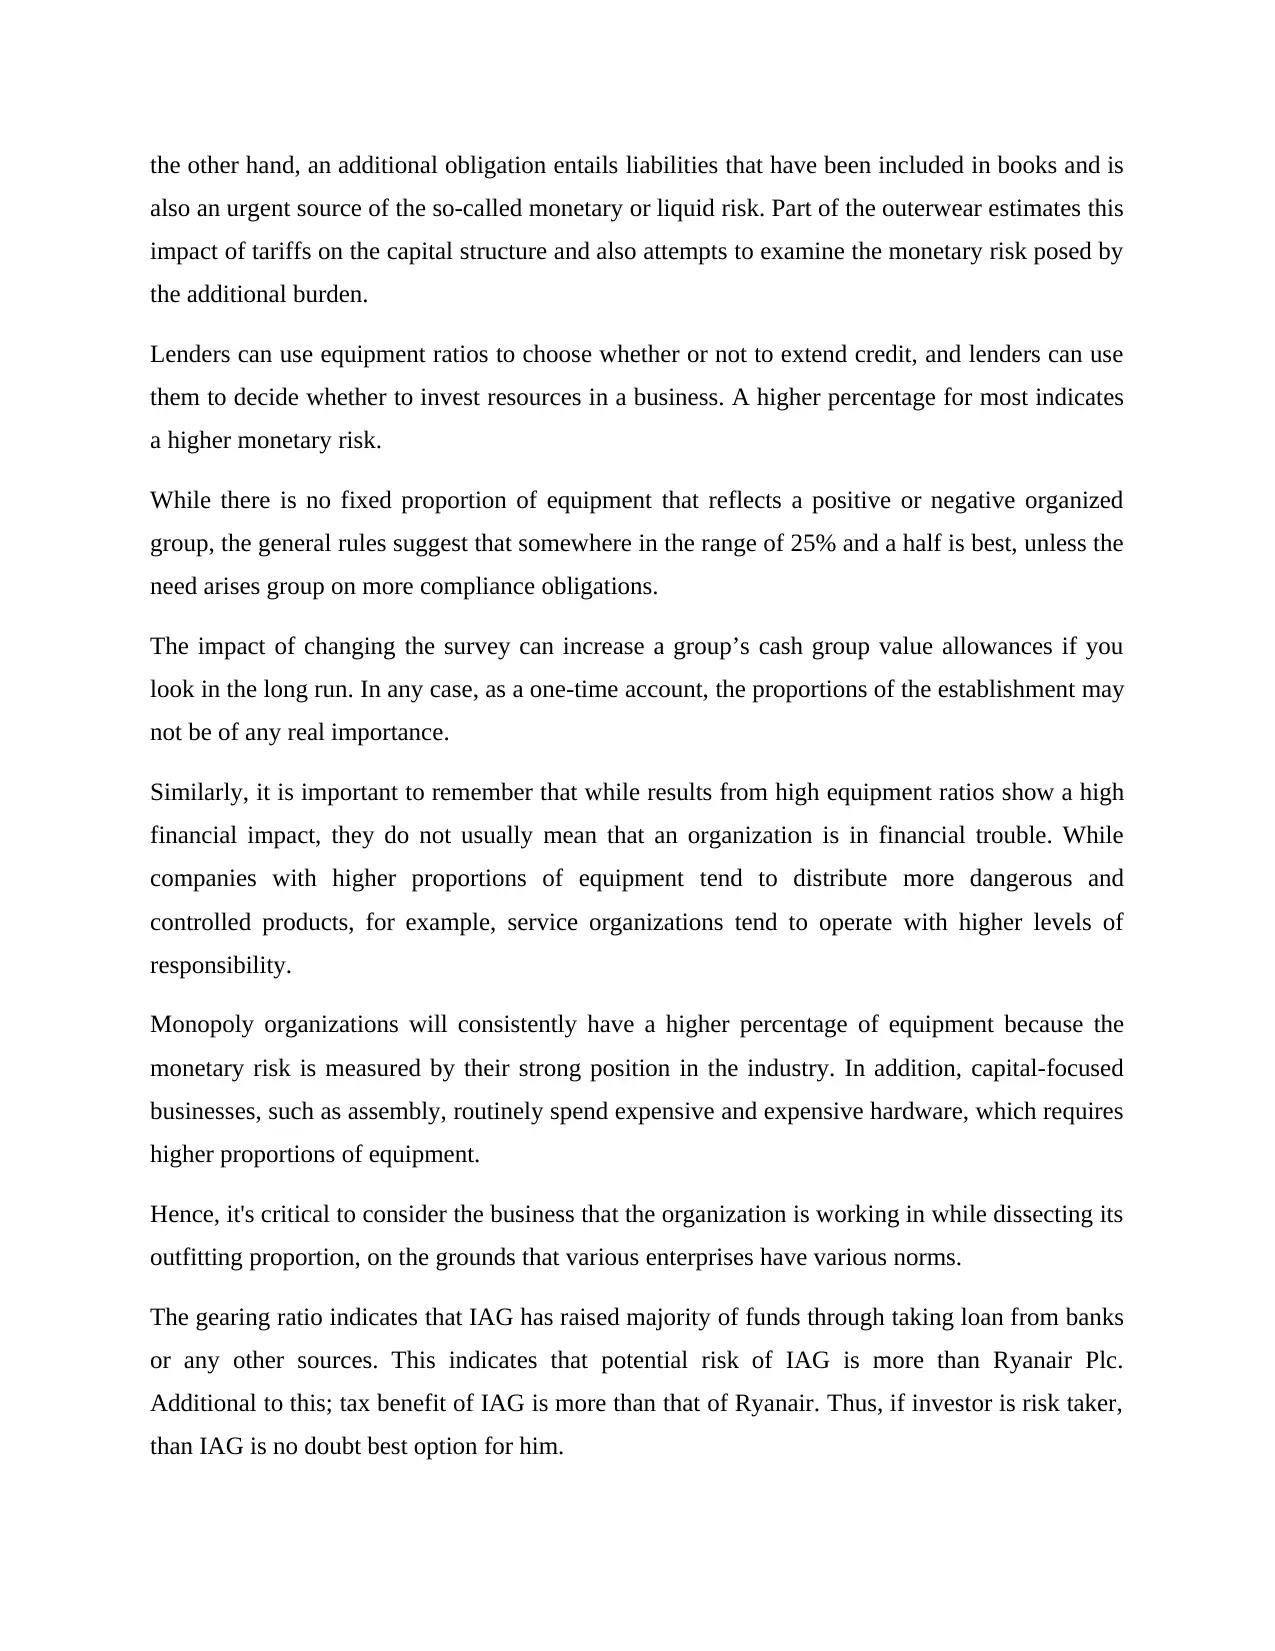
Fixed assets turnover ratio
2020 2019 2018 2017
0.00
0.20
0.40
0.60
0.80
1.00
1.20
1.40
1.60
INTERNATIONAL
CONSOLIDATED AIRLINES
GROUP
RYANAIR HOLDINGS
PUBLIC LIMITED COMPANY
The fixed assets turnover ratio of IAG is comparatively higher than Ryanair, this indicates IAG’s
proportion of sales turnover with fixed assets is higher than Ryanair. This also means that IAG
utilizes its fixed assets better than Ryanair.
b. Industry Analysis
Airlines in the UK corporate image provide thematic and quantitative summary data including:
market size (2016-20 value and size and estimate up to 2021). In the same picture are the images
of the main players, including the main liquidity metrics and the analysis of the key elements
within the market.
The aviation industry includes the air transport of passengers, including reserved and authorized
ones, but prohibits the transport of air cargo. Business volumes are defined as the total number of
passengers carried / picked up (take-offs) at all fixed internal or pre-local airports, which prevent
passengers from appearing and departing with a similar flight code. For the United States and
Canada, cross-border passengers towing from each country are considered part of the global
share. Corporate valuation is defined as the total income generated by aircraft from the
movement of these passengers. This avoids double checking of passengers. All currency
exchanges in this profile were done using the regular annual exchange rates of 2020.
- The UK's carrier industry posted total revenue of $ 16,545.6 million in 2020, approaching an
annual construction development rate (CAGR) of 1.6% somewhere in the 2012 range and of
2016.
- Company size expanded with a CAGR of 3.5% somewhere in the range of 2016 and 2020, to
reach a total of 126,781.9 thousand passengers in 2016.
- Fluctuations in UK industry estimates are not to be seen in passenger traffic, which has been
steadily improving since 2017, but despite the actual conflict between air carriers which has
reduced costs.
c. Recommendation
Based on above ratio analyses and comparing it with industrial analyses, Eyad is recommended
to invest in Ryanair Plc due to following reasons:
1. Best for regular return from investment
2. Less risk of insolvency
3. Has high liquidity compared to IAG
4. Gives regular return at comparatively low risk
5. High debtors turnover ratio, thus less risk of bad debts compare to IAG.
Therefore due to reason mentioned above, it is preferable to consider Ryanair Plc to invest rather
than IAG. Additional to this, if Eyad is looking for speculative stocks than IAG will be the best
option.
Conclusion
The current business manager needs the skills to analyze money data when making a decision.
Understanding funding is key to obtaining project grants, anticipating business trends, and
evaluating organizational performance. The currency option is an interaction to which all options
regarding the liability and value of the group of investors respond in the same way as the bond
issue. The money order considers a number of variables for the best result. The above variables
will definitely affect your finances.
Paraphrase This Document
Need a fresh take? Get an instant paraphrase of this document with our AI Paraphraser
References
Ahrendsen, B.L. and Katchova, A.L., 2012. Financial ratio analysis using ARMS
data. Agricultural Finance Review.
Xu, W., Xiao, Z., Dang, X., Yang, D. and Yang, X., 2014. Financial ratio selection for business
failure prediction using soft set theory. Knowledge-Based Systems, 63, pp.59-67.
AREAS, B., 2018. Financial analysis. growth, 30, p.10.
Gousario, F. and Dharmastuti, C.F., 2015. Regional financial performance and human
development index based on study in 20 counties/cities of level I region. The Winners, 16(2),
pp.152-165.
Delen, D., Kuzey, C. and Uyar, A., 2013. Measuring firm performance using financial ratios: A
decision tree approach. Expert systems with applications, 40(10), pp.3970-3983.
Marsha, N. and Murtaqi, I., 2017. The effect of financial ratios on firm value in the food and
beverage sector of the IDX. Journal of Business and Management, 6(2), pp.214-226.
Dalnial, H., Kamaluddin, A., Sanusi, Z.M. and Khairuddin, K.S., 2014. Detecting fraudulent
financial reporting through financial statement analysis. Journal of Advanced Management
Science, 2(1).
Zeytinoglu, E. and Akarim, Y.D., 2013. Financial failure prediction using financial ratios: An
empirical application on Istanbul Stock Exchange. Journal of Applied Finance and
Banking, 3(3), p.107.
Drake, P.P. and Fabozzi, F.J., 2012. Analysis of financial statements (Vol. 204). John Wiley &
Sons.
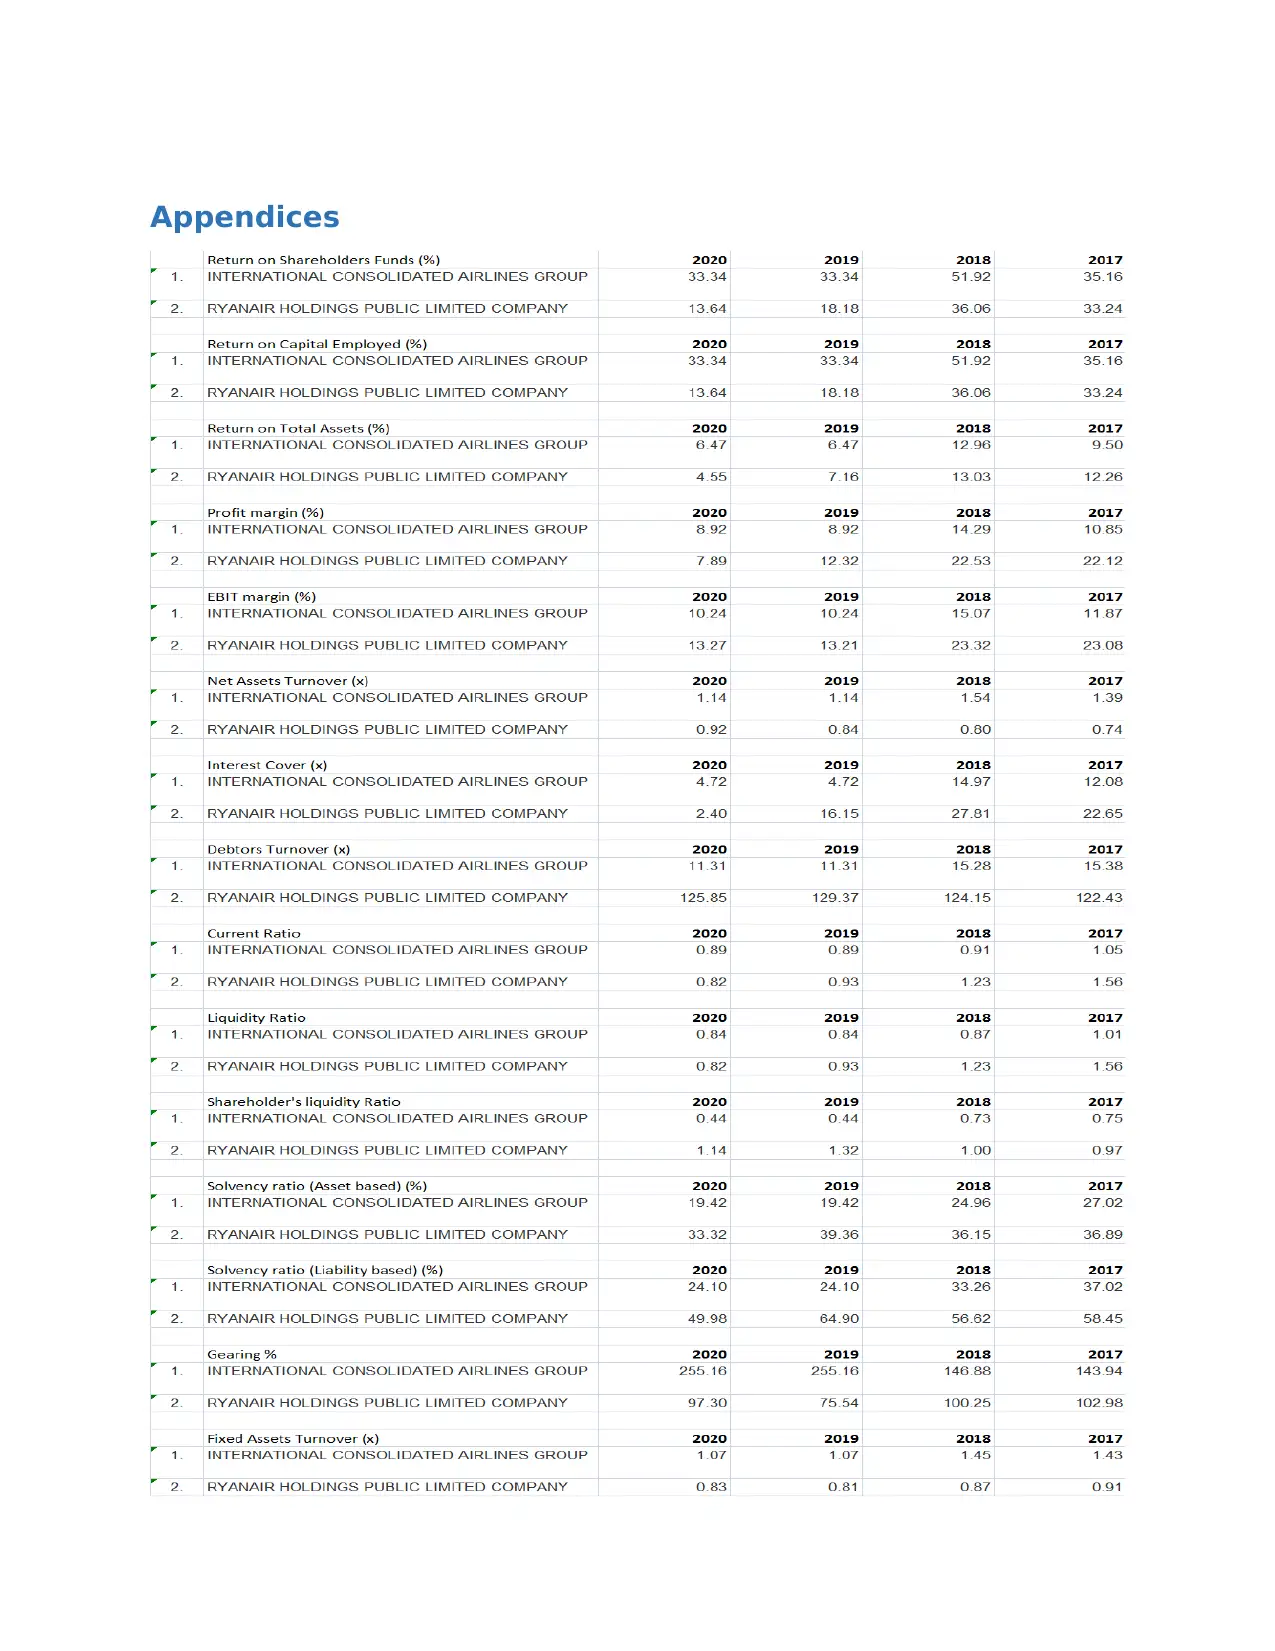
Appendices
1 out of 15
Related Documents


Your All-in-One AI-Powered Toolkit for Academic Success.
+13062052269
info@desklib.com
Available 24*7 on WhatsApp / Email
![[object Object]](/_next/static/media/star-bottom.7253800d.svg)
Unlock your academic potential
© 2024 | Zucol Services PVT LTD | All rights reserved.