Financial Analysis and Variance Reporting
VerifiedAdded on 2020/05/28
|13
|2192
|251
AI Summary
This assignment involves analyzing a provided income variance report for a company. Students must identify significant variances, both positive and negative, and explain their impact on the entity's performance. They are then required to provide recommendations for the next three months, focusing on areas like increasing sales, optimizing stock turnover, and controlling costs. The analysis should cover areas such as advertising expenses, employee costs, and cost of goods sold.
Contribute Materials
Your contribution can guide someone’s learning journey. Share your
documents today.

Running head: FINANCE
Finance
Name of the Student:
Name of the University:
Authors Note:
Finance
Name of the Student:
Name of the University:
Authors Note:
Secure Best Marks with AI Grader
Need help grading? Try our AI Grader for instant feedback on your assignments.
1
FINANCE
Table of Contents
Part E..........................................................................................................................................2
Answer to Question 1.................................................................................................................2
Answer to Question 2.................................................................................................................2
Answer to Question 3.................................................................................................................3
Answer to Question 4.................................................................................................................3
Answer to Question 5.................................................................................................................3
Answer to Question 6.................................................................................................................4
Answer to Question 7.................................................................................................................4
a).................................................................................................................................................4
b)................................................................................................................................................4
Answer to Question 8.................................................................................................................5
Answer to Question 9.................................................................................................................9
Answer to Question 10...............................................................................................................9
Answer to Question 11...............................................................................................................9
Answer to Question 12.............................................................................................................10
Answer to Question 13.............................................................................................................10
Reference..................................................................................................................................11
2
FINANCE
Part E
Answer to Question 1
Memorandum
To The
Management
In this report, an attempt has been made to draw your attention to the variances that
have occurred in variable and fixed expenses with respect to the budgeted performance. Some
significant variance can be noticed in the Cost of goods sold element. It turned out to be a lot
less than we expected. Even our sales showed a lot of variance i.e. about 8 %. But as pour
cost of goods sold % of variance was less than that of our sales it turned out that got an
increased gross profit than our expectation. For future we must focus on increasing our sales
efforts in order to enjoy the benefits of low COGS. Also we can see that entertainment
expense was highly exaggerated in our budget. We must endeavour to take a more realistic
approach towards this kind of fixed expenses in the future.
Thanking You
Answer to Question 2
The issues involved in monitoring and controlling activities against plans are as
follows:
1) Setting up realistic targets and levels of activities. The organisation must realise the
potential of its employees and its production capabilities before setting up any budget.
3
FINANCE
2) Understanding the effect of any variance taking place. It is not always that variance prove
to be bad for a business for instance if the budgeted costs are more than the actual costs then
it is good for the company and vice versa (Chen et al. 2014).
3) Understanding the how, when, why and what concept related with variances. The
organisation must understand how any variance is affecting it, then understand the reasons
behind such variance, then move on to finding when did the events causing the variance
occurred, and lastly what steps can be taken to minimise the variance if negative in the future.
Answer to Question 3
It is quite easily observable that the cash balance in the first quarter is increasing by a
fixed amount of 10000. After that point it has risen by 20000 and stabilising at 100000. It is
recommended that the company must try to keep fixed or at least stable cash balance at the
end of every month (Chu and Li 2015). If the entity is left with surplus cash at any point, it
must invest it in some other avenues to get returns from it rather than keeping it with itself
and increasing the working capital.
Answer to Question 4
The cash budget clearly shows that the cash balance at the end of the month is
decreasing leading to a negative cash balance in the month of April and thereafter. It is
recommended that the entity must reduce its cash outflows like payment to creditors, ask for
some credit period, and at the same time make regular collection from the debtors and
reducing their credit period (Agarwalla et al. 2015).
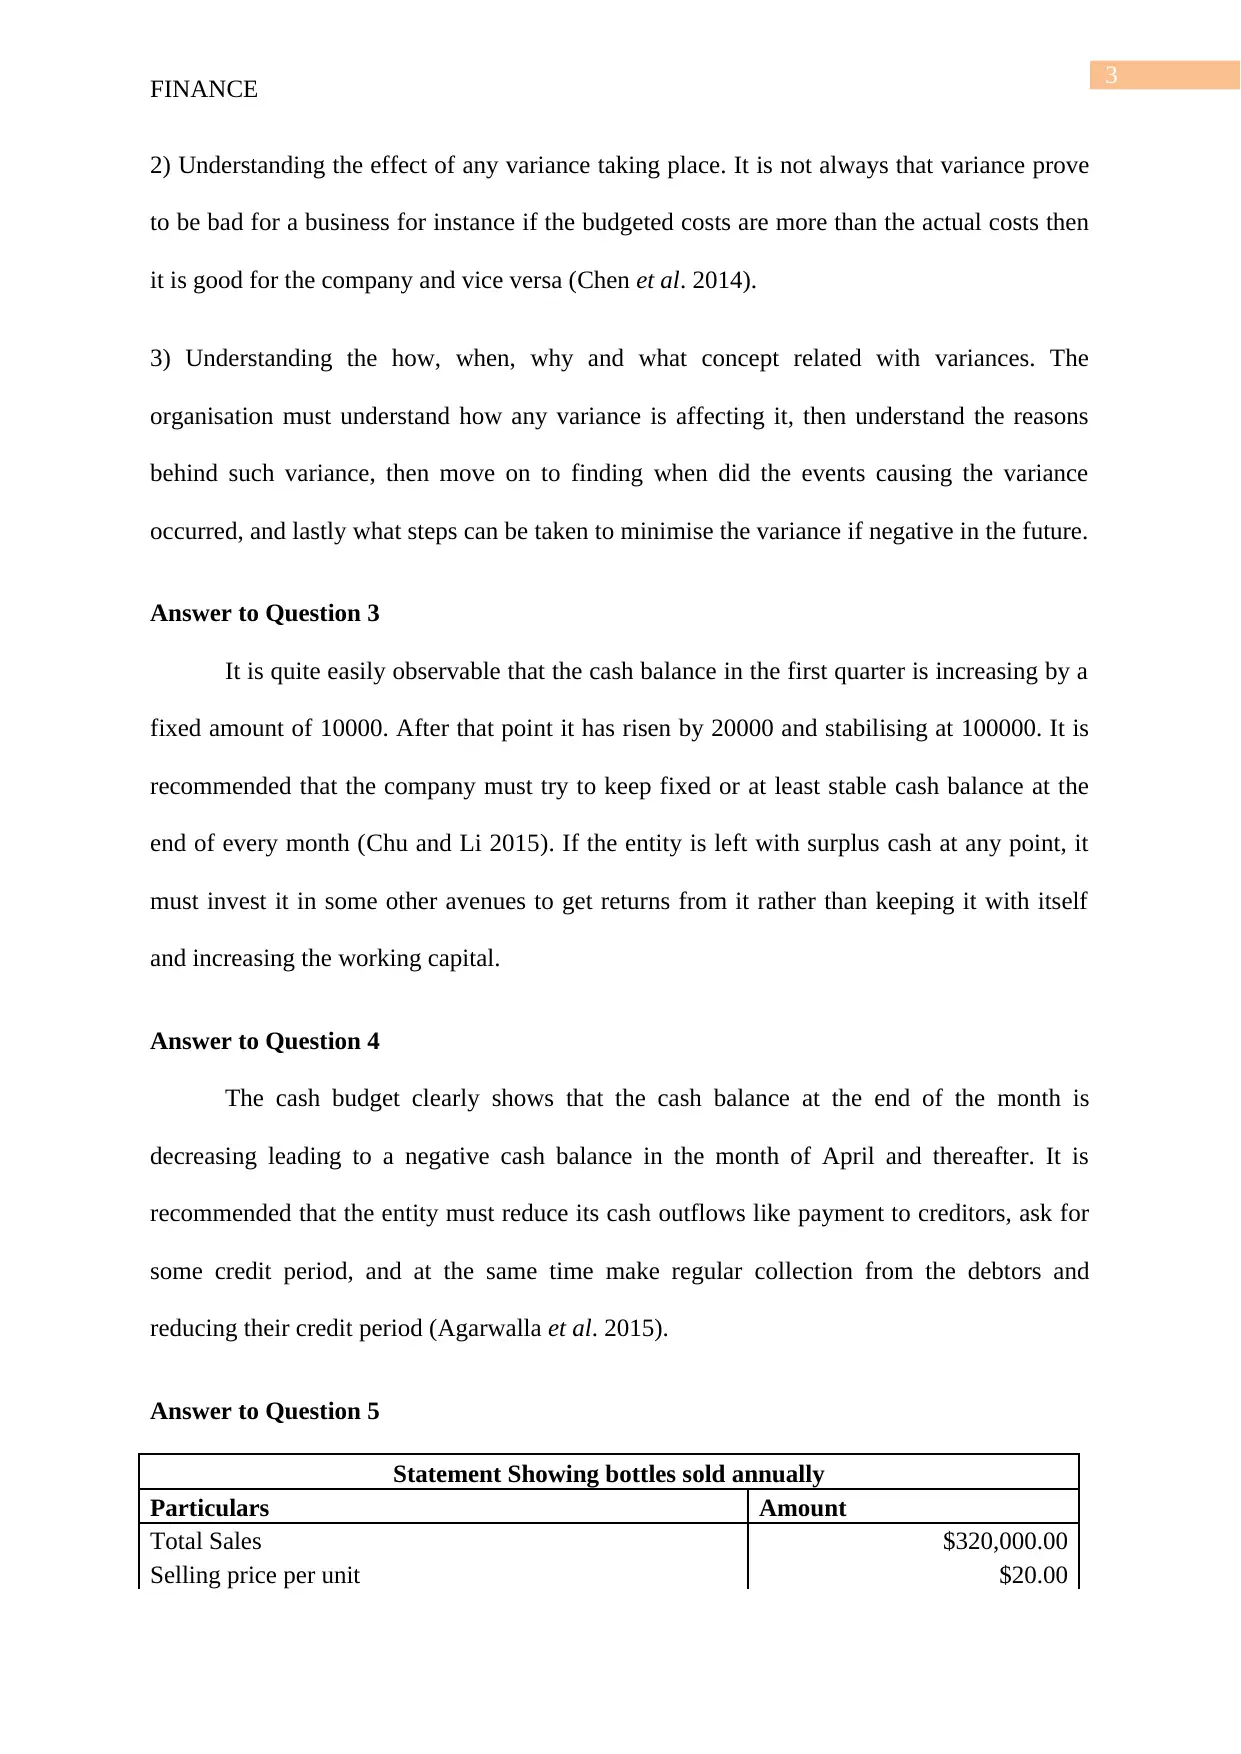
Answer to Question 5
Statement Showing bottles sold annually
Particulars Amount
Total Sales $320,000.00
Selling price per unit $20.00
FINANCE
2) Understanding the effect of any variance taking place. It is not always that variance prove
to be bad for a business for instance if the budgeted costs are more than the actual costs then
it is good for the company and vice versa (Chen et al. 2014).
3) Understanding the how, when, why and what concept related with variances. The
organisation must understand how any variance is affecting it, then understand the reasons
behind such variance, then move on to finding when did the events causing the variance
occurred, and lastly what steps can be taken to minimise the variance if negative in the future.
Answer to Question 3
It is quite easily observable that the cash balance in the first quarter is increasing by a
fixed amount of 10000. After that point it has risen by 20000 and stabilising at 100000. It is
recommended that the company must try to keep fixed or at least stable cash balance at the
end of every month (Chu and Li 2015). If the entity is left with surplus cash at any point, it
must invest it in some other avenues to get returns from it rather than keeping it with itself
and increasing the working capital.
Answer to Question 4
The cash budget clearly shows that the cash balance at the end of the month is
decreasing leading to a negative cash balance in the month of April and thereafter. It is
recommended that the entity must reduce its cash outflows like payment to creditors, ask for
some credit period, and at the same time make regular collection from the debtors and
reducing their credit period (Agarwalla et al. 2015).
Answer to Question 5
Statement Showing bottles sold annually
Particulars Amount
Total Sales $320,000.00
Selling price per unit $20.00
Secure Best Marks with AI Grader
Need help grading? Try our AI Grader for instant feedback on your assignments.
4
FINANCE
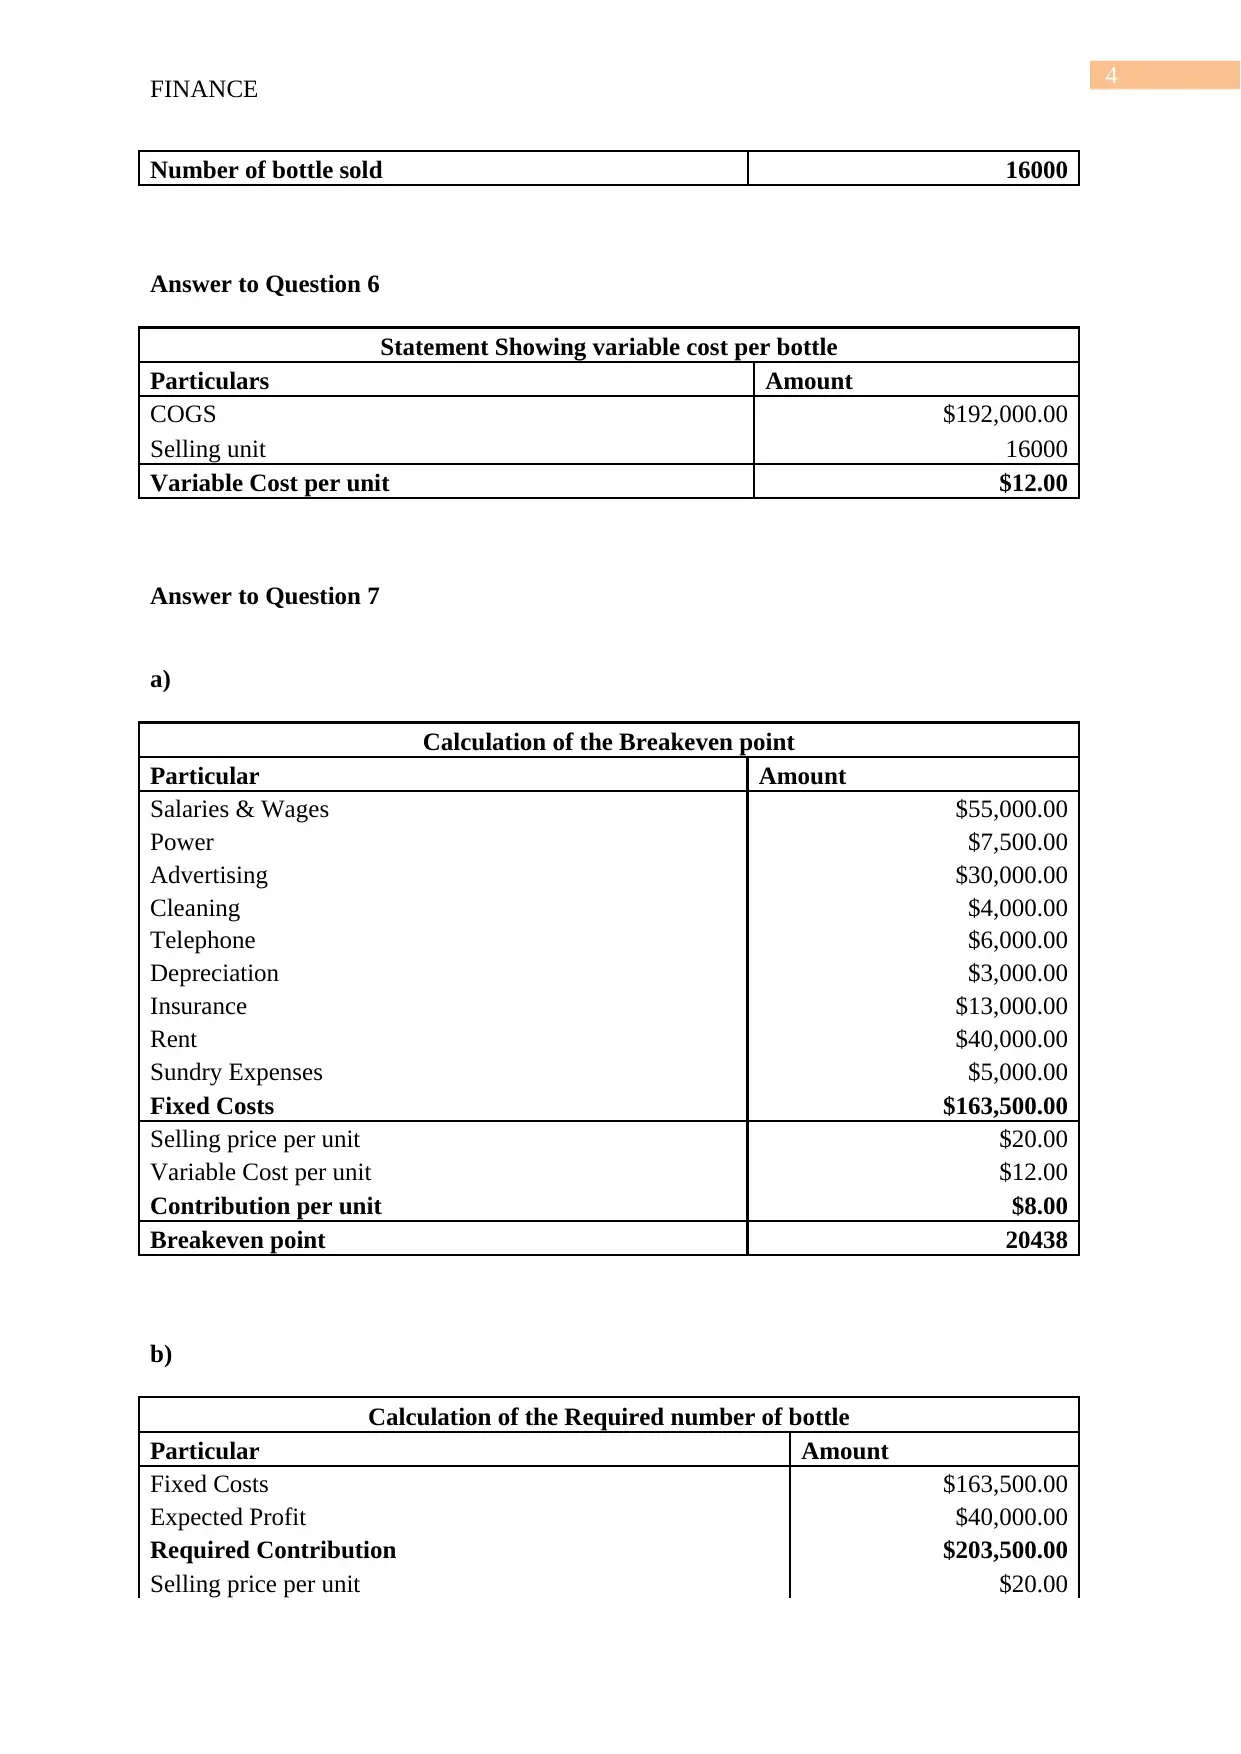
Number of bottle sold 16000
Answer to Question 6
Statement Showing variable cost per bottle
Particulars Amount
COGS $192,000.00
Selling unit 16000
Variable Cost per unit $12.00
Answer to Question 7
a)
Calculation of the Breakeven point
Particular Amount
Salaries & Wages $55,000.00
Power $7,500.00
Advertising $30,000.00
Cleaning $4,000.00
Telephone $6,000.00
Depreciation $3,000.00
Insurance $13,000.00
Rent $40,000.00
Sundry Expenses $5,000.00
Fixed Costs $163,500.00
Selling price per unit $20.00
Variable Cost per unit $12.00
Contribution per unit $8.00
Breakeven point 20438
b)
Calculation of the Required number of bottle
Particular Amount
Fixed Costs $163,500.00
Expected Profit $40,000.00
Required Contribution $203,500.00
Selling price per unit $20.00
FINANCE
Number of bottle sold 16000
Answer to Question 6
Statement Showing variable cost per bottle
Particulars Amount
COGS $192,000.00
Selling unit 16000
Variable Cost per unit $12.00
Answer to Question 7
a)
Calculation of the Breakeven point
Particular Amount
Salaries & Wages $55,000.00
Power $7,500.00
Advertising $30,000.00
Cleaning $4,000.00
Telephone $6,000.00
Depreciation $3,000.00
Insurance $13,000.00
Rent $40,000.00
Sundry Expenses $5,000.00
Fixed Costs $163,500.00
Selling price per unit $20.00
Variable Cost per unit $12.00
Contribution per unit $8.00
Breakeven point 20438
b)
Calculation of the Required number of bottle
Particular Amount
Fixed Costs $163,500.00
Expected Profit $40,000.00
Required Contribution $203,500.00
Selling price per unit $20.00
5
FINANCE
Required number of bottle 10175
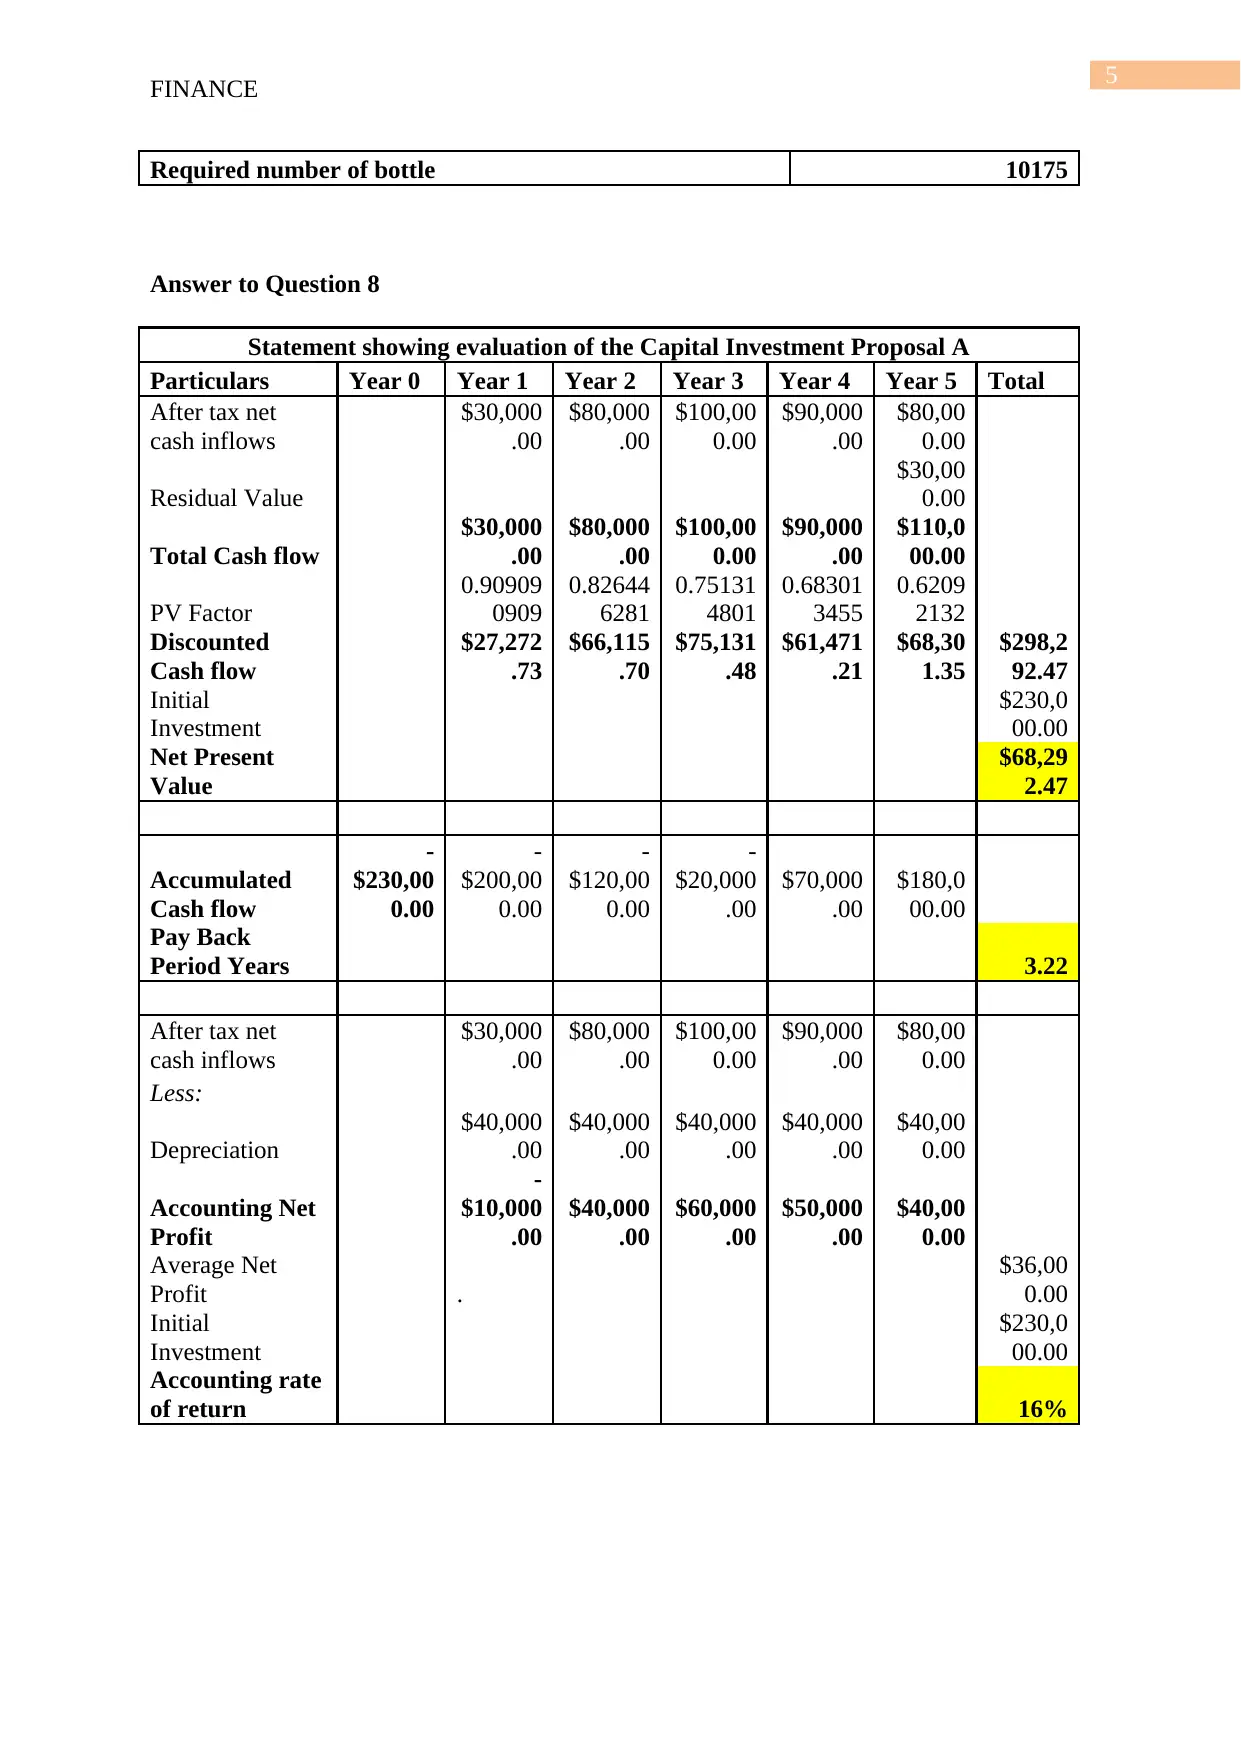
Answer to Question 8
Statement showing evaluation of the Capital Investment Proposal A
Particulars Year 0 Year 1 Year 2 Year 3 Year 4 Year 5 Total
After tax net
cash inflows
$30,000
.00
$80,000
.00
$100,00
0.00
$90,000
.00
$80,00
0.00
Residual Value
$30,00
0.00
Total Cash flow
$30,000
.00
$80,000
.00
$100,00
0.00
$90,000
.00
$110,0
00.00
PV Factor
0.90909
0909
0.82644
6281
0.75131
4801
0.68301
3455
0.6209
2132
Discounted
Cash flow
$27,272
.73
$66,115
.70
$75,131
.48
$61,471
.21
$68,30
1.35
$298,2
92.47
Initial
Investment
$230,0
00.00
Net Present
Value
$68,29
2.47
Accumulated
Cash flow
-
$230,00
0.00
-
$200,00
0.00
-
$120,00
0.00
-
$20,000
.00
$70,000
.00
$180,0
00.00
Pay Back
Period Years 3.22
After tax net
cash inflows
$30,000
.00
$80,000
.00
$100,00
0.00
$90,000
.00
$80,00
0.00
Less:
Depreciation
$40,000
.00
$40,000
.00
$40,000
.00
$40,000
.00
$40,00
0.00
Accounting Net
Profit
-
$10,000
.00
$40,000
.00
$60,000
.00
$50,000
.00
$40,00
0.00
Average Net
Profit .
$36,00
0.00
Initial
Investment
$230,0
00.00
Accounting rate
of return 16%
FINANCE
Required number of bottle 10175
Answer to Question 8
Statement showing evaluation of the Capital Investment Proposal A
Particulars Year 0 Year 1 Year 2 Year 3 Year 4 Year 5 Total
After tax net
cash inflows
$30,000
.00
$80,000
.00
$100,00
0.00
$90,000
.00
$80,00
0.00
Residual Value
$30,00
0.00
Total Cash flow
$30,000
.00
$80,000
.00
$100,00
0.00
$90,000
.00
$110,0
00.00
PV Factor
0.90909
0909
0.82644
6281
0.75131
4801
0.68301
3455
0.6209
2132
Discounted
Cash flow
$27,272
.73
$66,115
.70
$75,131
.48
$61,471
.21
$68,30
1.35
$298,2
92.47
Initial
Investment
$230,0
00.00
Net Present
Value
$68,29
2.47
Accumulated
Cash flow
-
$230,00
0.00
-
$200,00
0.00
-
$120,00
0.00
-
$20,000
.00
$70,000
.00
$180,0
00.00
Pay Back
Period Years 3.22
After tax net
cash inflows
$30,000
.00
$80,000
.00
$100,00
0.00
$90,000
.00
$80,00
0.00
Less:
Depreciation
$40,000
.00
$40,000
.00
$40,000
.00
$40,000
.00
$40,00
0.00
Accounting Net
Profit
-
$10,000
.00
$40,000
.00
$60,000
.00
$50,000
.00
$40,00
0.00
Average Net
Profit .
$36,00
0.00
Initial
Investment
$230,0
00.00
Accounting rate
of return 16%
6
FINANCE
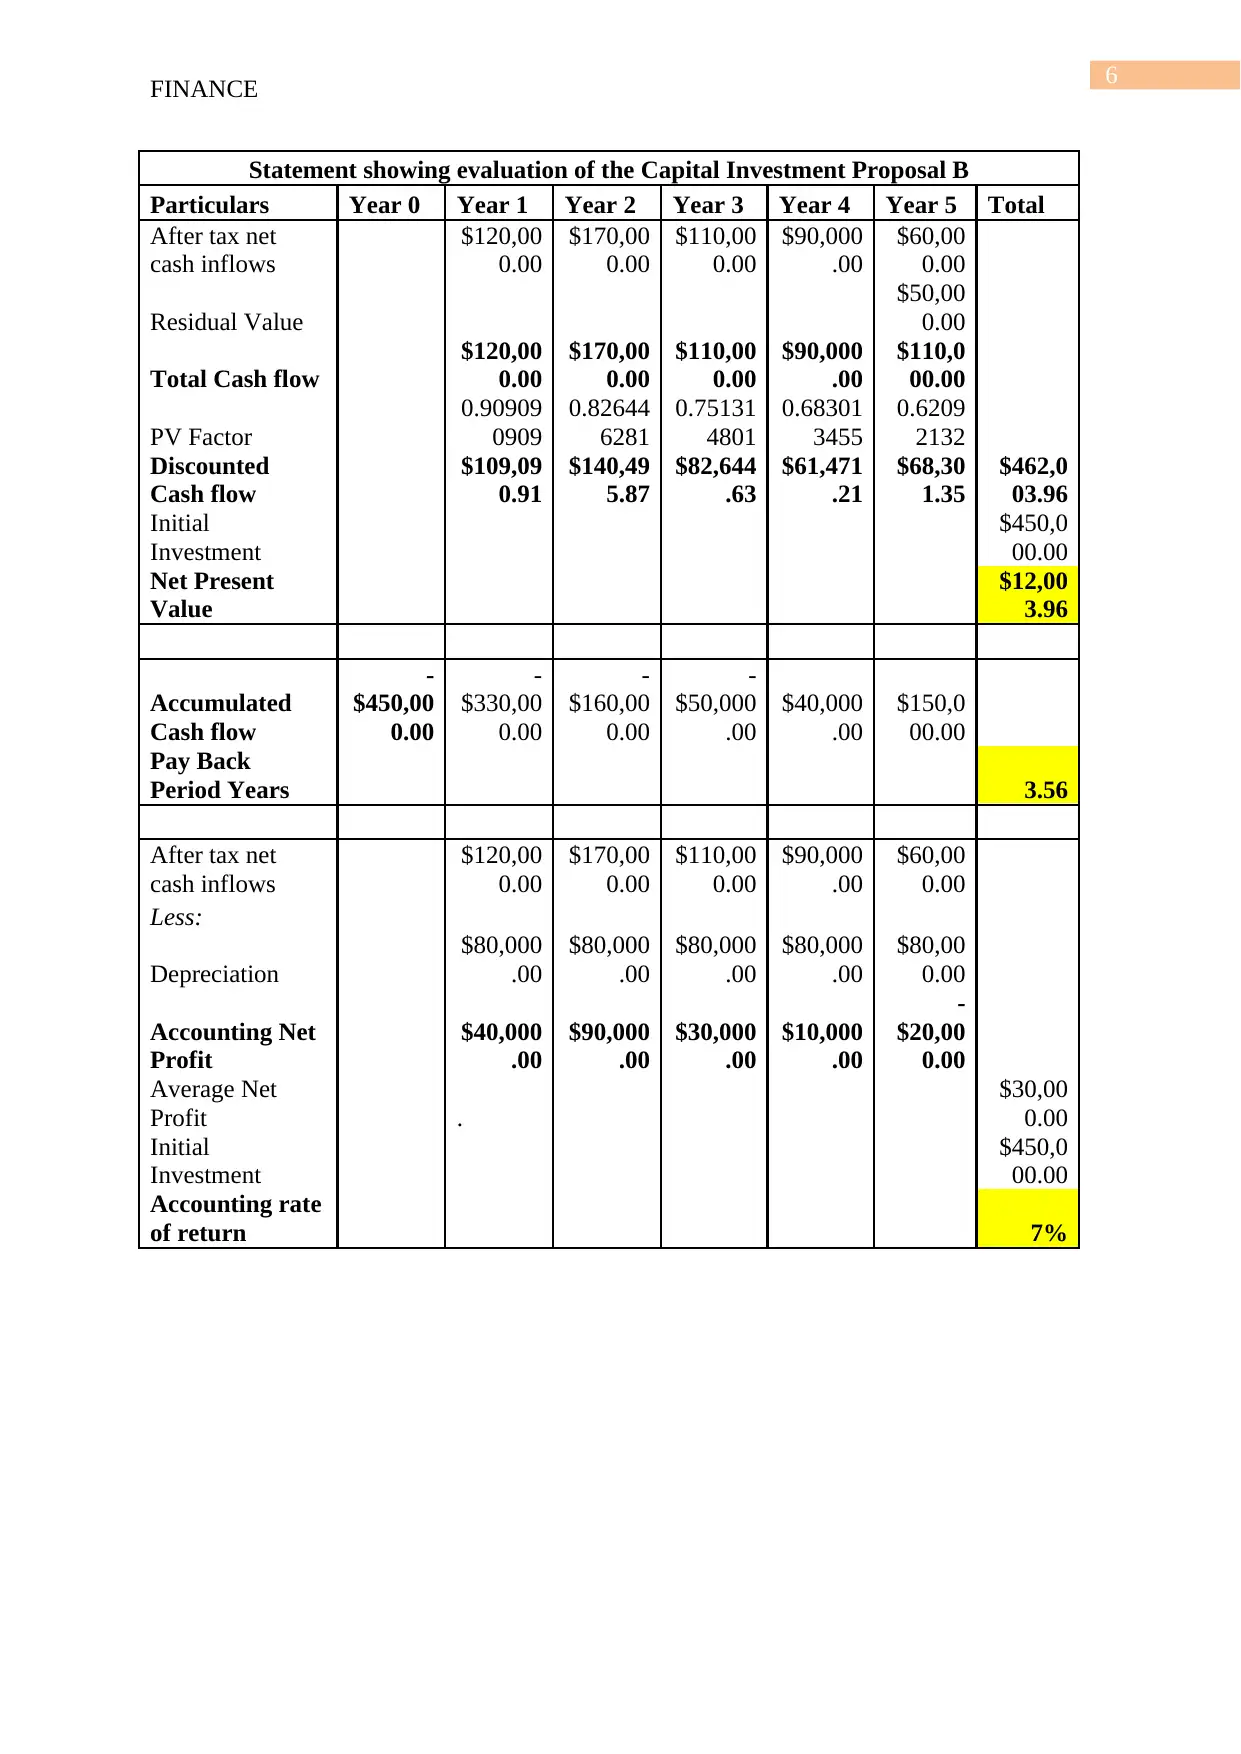
Statement showing evaluation of the Capital Investment Proposal B
Particulars Year 0 Year 1 Year 2 Year 3 Year 4 Year 5 Total
After tax net
cash inflows
$120,00
0.00
$170,00
0.00
$110,00
0.00
$90,000
.00
$60,00
0.00
Residual Value
$50,00
0.00
Total Cash flow
$120,00
0.00
$170,00
0.00
$110,00
0.00
$90,000
.00
$110,0
00.00
PV Factor
0.90909
0909
0.82644
6281
0.75131
4801
0.68301
3455
0.6209
2132
Discounted
Cash flow
$109,09
0.91
$140,49
5.87
$82,644
.63
$61,471
.21
$68,30
1.35
$462,0
03.96
Initial
Investment
$450,0
00.00
Net Present
Value
$12,00
3.96
Accumulated
Cash flow
-
$450,00
0.00
-
$330,00
0.00
-
$160,00
0.00
-
$50,000
.00
$40,000
.00
$150,0
00.00
Pay Back
Period Years 3.56
After tax net
cash inflows
$120,00
0.00
$170,00
0.00
$110,00
0.00
$90,000
.00
$60,00
0.00
Less:
Depreciation
$80,000
.00
$80,000
.00
$80,000
.00
$80,000
.00
$80,00
0.00
Accounting Net
Profit
$40,000
.00
$90,000
.00
$30,000
.00
$10,000
.00
-
$20,00
0.00
Average Net
Profit .
$30,00
0.00
Initial
Investment
$450,0
00.00
Accounting rate
of return 7%
FINANCE
Statement showing evaluation of the Capital Investment Proposal B
Particulars Year 0 Year 1 Year 2 Year 3 Year 4 Year 5 Total
After tax net
cash inflows
$120,00
0.00
$170,00
0.00
$110,00
0.00
$90,000
.00
$60,00
0.00
Residual Value
$50,00
0.00
Total Cash flow
$120,00
0.00
$170,00
0.00
$110,00
0.00
$90,000
.00
$110,0
00.00
PV Factor
0.90909
0909
0.82644
6281
0.75131
4801
0.68301
3455
0.6209
2132
Discounted
Cash flow
$109,09
0.91
$140,49
5.87
$82,644
.63
$61,471
.21
$68,30
1.35
$462,0
03.96
Initial
Investment
$450,0
00.00
Net Present
Value
$12,00
3.96
Accumulated
Cash flow
-
$450,00
0.00
-
$330,00
0.00
-
$160,00
0.00
-
$50,000
.00
$40,000
.00
$150,0
00.00
Pay Back
Period Years 3.56
After tax net
cash inflows
$120,00
0.00
$170,00
0.00
$110,00
0.00
$90,000
.00
$60,00
0.00
Less:
Depreciation
$80,000
.00
$80,000
.00
$80,000
.00
$80,000
.00
$80,00
0.00
Accounting Net
Profit
$40,000
.00
$90,000
.00
$30,000
.00
$10,000
.00
-
$20,00
0.00
Average Net
Profit .
$30,00
0.00
Initial
Investment
$450,0
00.00
Accounting rate
of return 7%
Paraphrase This Document
Need a fresh take? Get an instant paraphrase of this document with our AI Paraphraser
7
FINANCE
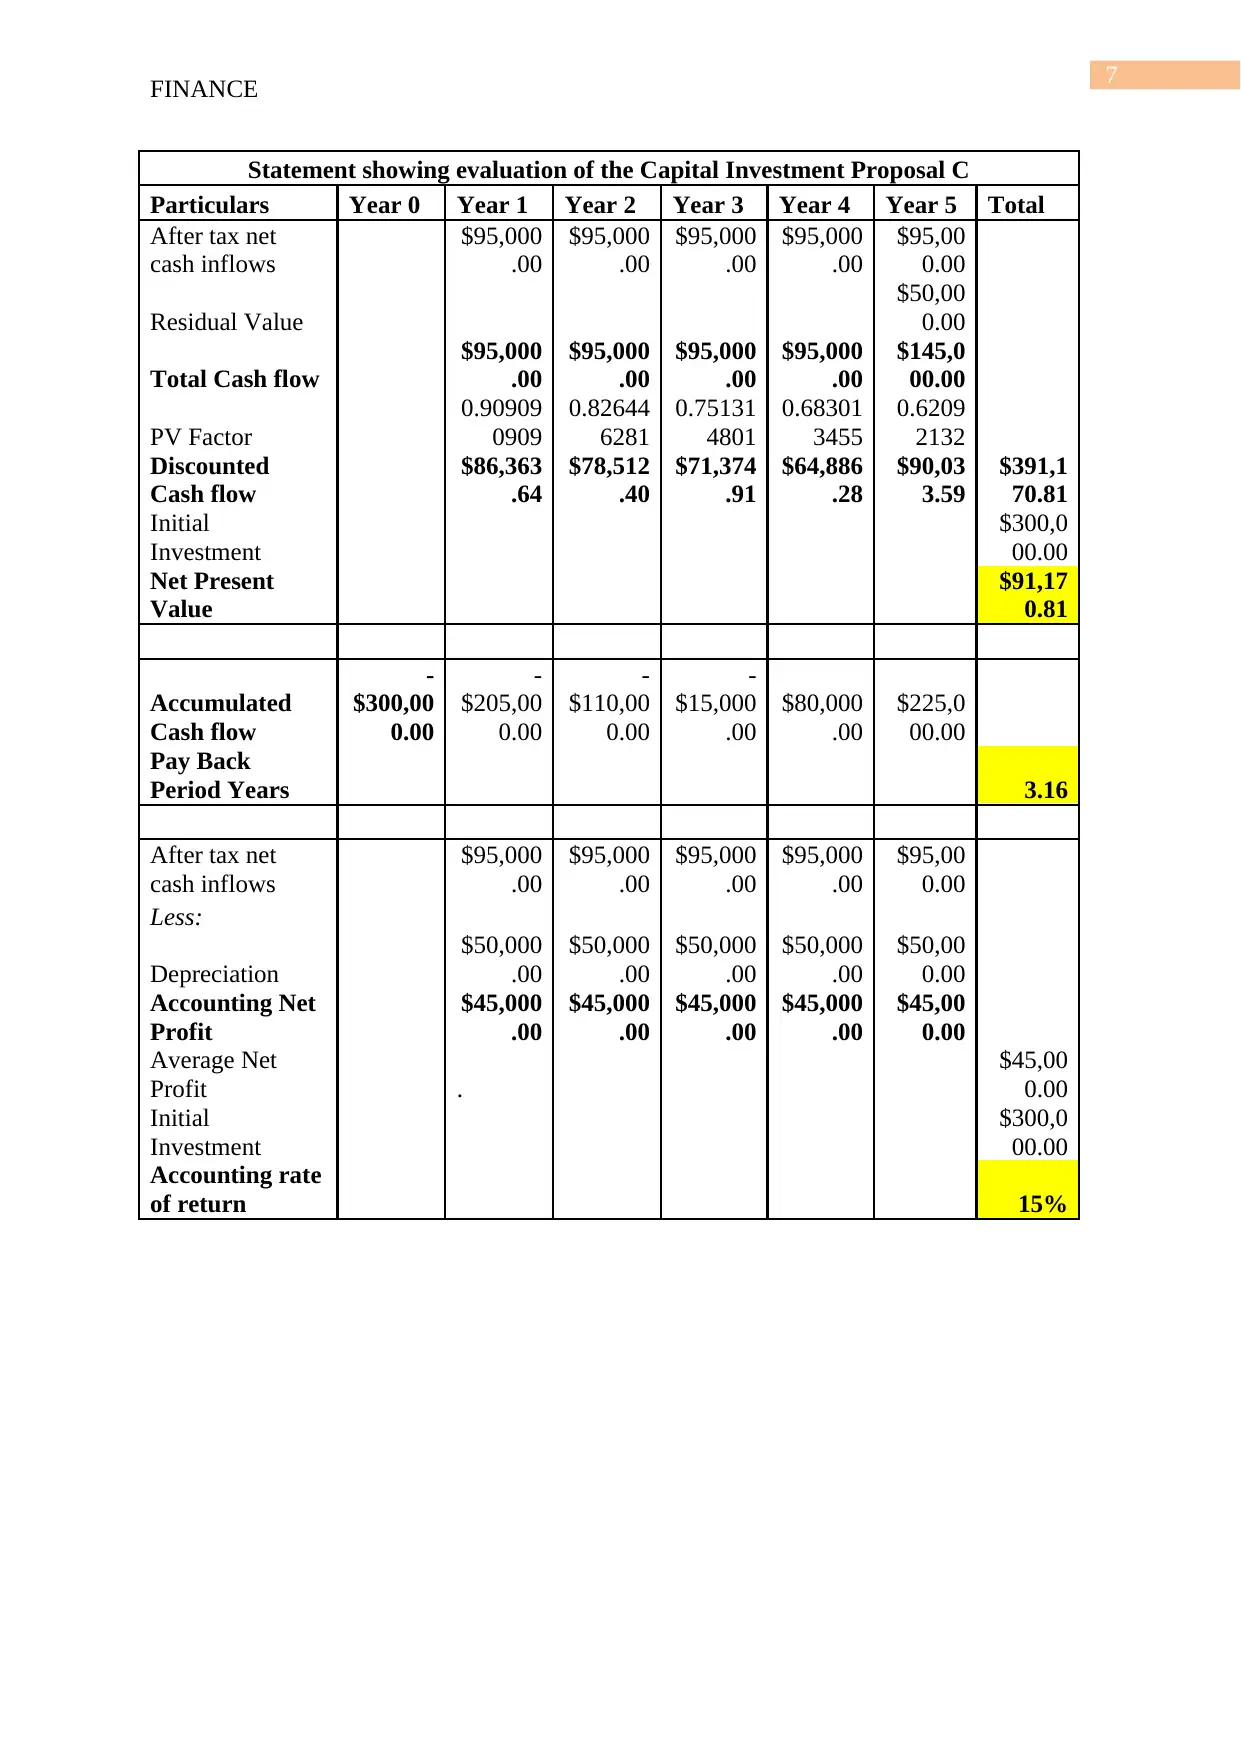
Statement showing evaluation of the Capital Investment Proposal C
Particulars Year 0 Year 1 Year 2 Year 3 Year 4 Year 5 Total
After tax net
cash inflows
$95,000
.00
$95,000
.00
$95,000
.00
$95,000
.00
$95,00
0.00
Residual Value
$50,00
0.00
Total Cash flow
$95,000
.00
$95,000
.00
$95,000
.00
$95,000
.00
$145,0
00.00
PV Factor
0.90909
0909
0.82644
6281
0.75131
4801
0.68301
3455
0.6209
2132
Discounted
Cash flow
$86,363
.64
$78,512
.40
$71,374
.91
$64,886
.28
$90,03
3.59
$391,1
70.81
Initial
Investment
$300,0
00.00
Net Present
Value
$91,17
0.81
Accumulated
Cash flow
-
$300,00
0.00
-
$205,00
0.00
-
$110,00
0.00
-
$15,000
.00
$80,000
.00
$225,0
00.00
Pay Back
Period Years 3.16
After tax net
cash inflows
$95,000
.00
$95,000
.00
$95,000
.00
$95,000
.00
$95,00
0.00
Less:
Depreciation
$50,000
.00
$50,000
.00
$50,000
.00
$50,000
.00
$50,00
0.00
Accounting Net
Profit
$45,000
.00
$45,000
.00
$45,000
.00
$45,000
.00
$45,00
0.00
Average Net
Profit .
$45,00
0.00
Initial
Investment
$300,0
00.00
Accounting rate
of return 15%
FINANCE
Statement showing evaluation of the Capital Investment Proposal C
Particulars Year 0 Year 1 Year 2 Year 3 Year 4 Year 5 Total
After tax net
cash inflows
$95,000
.00
$95,000
.00
$95,000
.00
$95,000
.00
$95,00
0.00
Residual Value
$50,00
0.00
Total Cash flow
$95,000
.00
$95,000
.00
$95,000
.00
$95,000
.00
$145,0
00.00
PV Factor
0.90909
0909
0.82644
6281
0.75131
4801
0.68301
3455
0.6209
2132
Discounted
Cash flow
$86,363
.64
$78,512
.40
$71,374
.91
$64,886
.28
$90,03
3.59
$391,1
70.81
Initial
Investment
$300,0
00.00
Net Present
Value
$91,17
0.81
Accumulated
Cash flow
-
$300,00
0.00
-
$205,00
0.00
-
$110,00
0.00
-
$15,000
.00
$80,000
.00
$225,0
00.00
Pay Back
Period Years 3.16
After tax net
cash inflows
$95,000
.00
$95,000
.00
$95,000
.00
$95,000
.00
$95,00
0.00
Less:
Depreciation
$50,000
.00
$50,000
.00
$50,000
.00
$50,000
.00
$50,00
0.00
Accounting Net
Profit
$45,000
.00
$45,000
.00
$45,000
.00
$45,000
.00
$45,00
0.00
Average Net
Profit .
$45,00
0.00
Initial
Investment
$300,0
00.00
Accounting rate
of return 15%
8
FINANCE
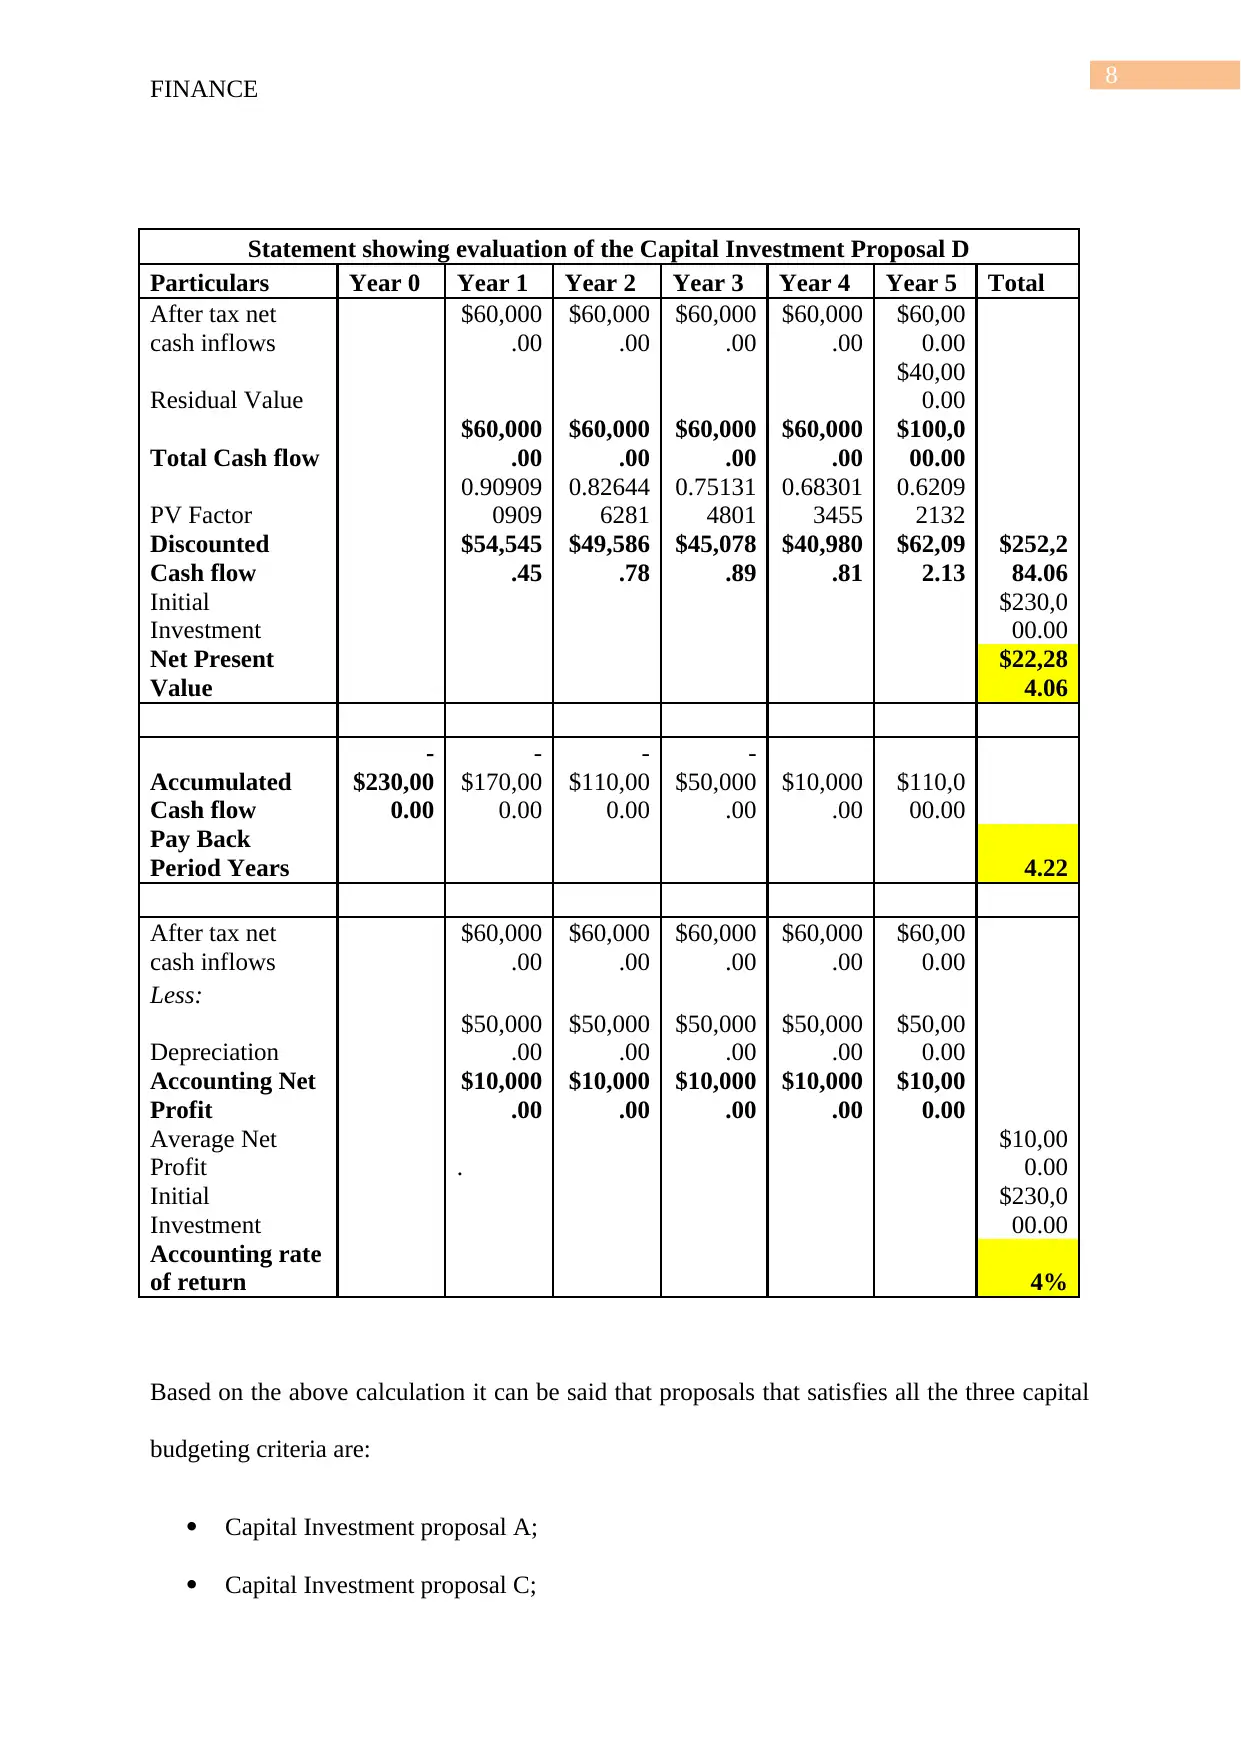
Statement showing evaluation of the Capital Investment Proposal D
Particulars Year 0 Year 1 Year 2 Year 3 Year 4 Year 5 Total
After tax net
cash inflows
$60,000
.00
$60,000
.00
$60,000
.00
$60,000
.00
$60,00
0.00
Residual Value
$40,00
0.00
Total Cash flow
$60,000
.00
$60,000
.00
$60,000
.00
$60,000
.00
$100,0
00.00
PV Factor
0.90909
0909
0.82644
6281
0.75131
4801
0.68301
3455
0.6209
2132
Discounted
Cash flow
$54,545
.45
$49,586
.78
$45,078
.89
$40,980
.81
$62,09
2.13
$252,2
84.06
Initial
Investment
$230,0
00.00
Net Present
Value
$22,28
4.06
Accumulated
Cash flow
-
$230,00
0.00
-
$170,00
0.00
-
$110,00
0.00
-
$50,000
.00
$10,000
.00
$110,0
00.00
Pay Back
Period Years 4.22
After tax net
cash inflows
$60,000
.00
$60,000
.00
$60,000
.00
$60,000
.00
$60,00
0.00
Less:
Depreciation
$50,000
.00
$50,000
.00
$50,000
.00
$50,000
.00
$50,00
0.00
Accounting Net
Profit
$10,000
.00
$10,000
.00
$10,000
.00
$10,000
.00
$10,00
0.00
Average Net
Profit .
$10,00
0.00
Initial
Investment
$230,0
00.00
Accounting rate
of return 4%
Based on the above calculation it can be said that proposals that satisfies all the three capital
budgeting criteria are:
Capital Investment proposal A;
Capital Investment proposal C;
FINANCE
Statement showing evaluation of the Capital Investment Proposal D
Particulars Year 0 Year 1 Year 2 Year 3 Year 4 Year 5 Total
After tax net
cash inflows
$60,000
.00
$60,000
.00
$60,000
.00
$60,000
.00
$60,00
0.00
Residual Value
$40,00
0.00
Total Cash flow
$60,000
.00
$60,000
.00
$60,000
.00
$60,000
.00
$100,0
00.00
PV Factor
0.90909
0909
0.82644
6281
0.75131
4801
0.68301
3455
0.6209
2132
Discounted
Cash flow
$54,545
.45
$49,586
.78
$45,078
.89
$40,980
.81
$62,09
2.13
$252,2
84.06
Initial
Investment
$230,0
00.00
Net Present
Value
$22,28
4.06
Accumulated
Cash flow
-
$230,00
0.00
-
$170,00
0.00
-
$110,00
0.00
-
$50,000
.00
$10,000
.00
$110,0
00.00
Pay Back
Period Years 4.22
After tax net
cash inflows
$60,000
.00
$60,000
.00
$60,000
.00
$60,000
.00
$60,00
0.00
Less:
Depreciation
$50,000
.00
$50,000
.00
$50,000
.00
$50,000
.00
$50,00
0.00
Accounting Net
Profit
$10,000
.00
$10,000
.00
$10,000
.00
$10,000
.00
$10,00
0.00
Average Net
Profit .
$10,00
0.00
Initial
Investment
$230,0
00.00
Accounting rate
of return 4%
Based on the above calculation it can be said that proposals that satisfies all the three capital
budgeting criteria are:
Capital Investment proposal A;
Capital Investment proposal C;
9
FINANCE
Answer to Question 9
The company should accept the proposal that is more beneficial because the funds are
limited and the projects are mutual exclusive. On comparing the Proposal A with Proposal C
it can be seen that payback period of Proposal C is less than the proposal A. On comparing
the Accounting rate of return, it can be seen that ARR of proposal A is 16% whereas the
ARR of proposal C is 15%. On the other hand, NPV of Proposal C is higher than that of
Proposal A. Based on the above discussion it can be said that Proposal C should be accepted
as it is better in more criteria than proposal A.
Answer to Question 10
The report is efficiently showing that there are certain variances that have positively
affected the entity and some variances have affected the entity in a negative way. The income
variance report is helping us to understand that our sales effort have to increased significantly
and at the same time will have to work on improving the stock turnover ratio (Burger et al.
2015).
Answer to Question 11
The recommendations for the next 3 months would be as follows:
a) The organisation must focus on increasing its stock turnover ratio.
b) The savings made in motor vehicle and advertisement expenses is substantial hence
can be utilised to meet out the excess expense of postage and power.
c) The company must try to increase its selling efforts and spend a little more on
advertisement and discount expenses as it will help in increasing its sales.
Secure Best Marks with AI Grader
Need help grading? Try our AI Grader for instant feedback on your assignments.
10
FINANCE
Answer to Question 12
The income variance report for the December quarter indicates that there have been
significant variances in the performances of the entity. It is found that most of the variances
have significantly and negatively affected the entity. The cost of goods sold in more than we
expected (Webb 2016). The entity has been able to achieve more sales than expected but is
still incurring more advertisement costs than budgeted. This should be checked so as to save
on the cost of advertising. In order to sustain its operations it immediately needs to reduce its
employee costs too.
Answer to Question 13
The recommendations for the next three months will be as follows:
a) The company is incurring unnecessary advertisement expenses in spite of the fact that it
has been able to achieve more sales than what was budgeted for by the entity.
b) The company must bring down its employee cost by utilising its workforce in the optimum
way possible.
c) The company will have to come up with production techniques or something that will be
able to reduce its cost of goods sold. One of the ways could be finding a new supplier of raw
material who is capable of providing the same quality of raw material at a lower cost (Finkler
et al. 2016).
11
FINANCE
Reference
Agarwalla, S.K., Barua, S.K., Jacob, J. and Varma, J.R., 2015. Financial literacy among
working young in urban India. World Development, 67, pp.101-109.
Burger, R.H., Kaufman, P.T. and Atkinson, A.L., 2015. Disturbingly weak: The current state
of financial management education in library and information science curricula. Journal of
Education for Library and Information Science, 56(3), p.190.
Chen, G.G., Weikart, L.A. and Williams, D.W., 2014. Budget tools: Financial methods in the
public sector. CQ Press.
Chu, L. and Li, D., 2015. Research on College Financial Budget Performance Evaluation.
In LISS 2013 (pp. 673-678). Springer, Berlin, Heidelberg.
Finkler, S.A., Smith, D.L., Calabrese, T.D. and Purtell, R.M., 2016. Financial management
for public, health, and not-for-profit organizations. CQ Press.
Webb, A., 2016. Budget Management. In Handbook of Intensive care: Organization and
Management (pp. 339-357).

12
FINANCE
FINANCE
1 out of 13
Related Documents


Your All-in-One AI-Powered Toolkit for Academic Success.
+13062052269
info@desklib.com
Available 24*7 on WhatsApp / Email
![[object Object]](/_next/static/media/star-bottom.7253800d.svg)
Unlock your academic potential
© 2024 | Zucol Services PVT LTD | All rights reserved.