Finance for Business: ANZ Bank Financial Analysis and Scenario Analysis
VerifiedAdded on 2022/10/10
|14
|3576
|430
AI Summary
This report provides a comprehensive financial analysis of ANZ Bank, including liquidity and capital structure ratios, non-current asset analysis, and scenario analysis. It also covers the bank's share or bond issuance, PE ratio, and share price movement. The report is helpful for making informed decisions for the coming period.
Contribute Materials
Your contribution can guide someone’s learning journey. Share your
documents today.

1
Finance for business
Finance for business
Secure Best Marks with AI Grader
Need help grading? Try our AI Grader for instant feedback on your assignments.
Finance for business
Abstract
The report has been made and in that, all of the events which are there concerning the ANZ bank
have been taken into account. The main service which the company provides has been identified
and complete information for the same is collected for proper understanding. There have been
calculations which are made for the performance ratios and in that the capital structure which is
maintained and the liquidity of the company have been taken into account. The analysis has been
made for all of the non-current assets which are held and also the scenario analysis is performed
by which sensitivity is identified. The issue which is made by the company has been provided
with the complete details and so is the consideration of the share price movements.
2
Finance for business
Table of Contents
Abstract............................................................................................................................................2
Introduction......................................................................................................................................4
Financial analysis.............................................................................................................................4
2.1 Service provided by the company..........................................................................................4
2.2 Performance ratios.................................................................................................................4
2.3 Non-current asset analysis.....................................................................................................7
2.4 Scenario analysis...................................................................................................................7
2.5 Share or bond issuance..........................................................................................................9
2.6 PE ratio and share price movement.....................................................................................10
Recommendations..........................................................................................................................11
Conclusion.....................................................................................................................................12
References......................................................................................................................................13
Appendix........................................................................................................................................14
3
Finance for business
Introduction
The company performs the operations in various segments and it is required that adequate
knowledge of them shall be gained. The report is prepared for the ANZ bank and in this, the
activity which is performed and the main service of the company will be identified and taken into
account. There will also be the identification of the data for the non-current asses and the
movements in the sane will be identified together with the other details. The ratio analysis will
be performed and in that various ratios will be calculated which tells about the position of the
company. This will be helping in taking of the best decisions which will be in the interest of the
company. The consideration of the worst and best-case scenarios will be made and with that, the
sensitive element involved in the business will be identified. Their issue which has been made by
the company will be taken into consideration and with that complete details in relation to it will
be obtained by the company. The calculation of the price-earnings ratio is made and in that, all of
the changes which are taking place in the share price will be considered. The changes will be
identified and that will help in making the decisions in the company.
Financial analysis
2.1 Service provided by the company
ANZ is the company which is involved in the banking services and there are various other
services which are included in this. The main service is the financing service which is provided
by the company to its users. In that there are the dealings in relation to the cash flow and also
various loans are provided by it. The company gives the loan to all those who are in need of the
funds and they are provided for various purposes (Babalola and Abiola, 2013). There are several
circumstances in which the business faces various issues and for that solution are provided by the
bank. They guide the customers with the steps which need to be considered and undertaken by
which their problem will be resolved in the most effective manner.
2.2 Performance ratios
The ratio analysis is the technique which can be used in the business and by which the
performance of the company will be evaluated in an appropriate manner. This will be covering
4
Secure Best Marks with AI Grader
Need help grading? Try our AI Grader for instant feedback on your assignments.
Finance for business
the use of various information which is available from the accounts of the company. In that, there
is the coverage of different areas by which the position will be evaluated. There will be the
inclusion of the concept in relation to the liquidity and capital structure in the given case and that
will help the company to evaluate the current situation and make the decision for the coming
period. Both of the categories will be covered and accurate calculations will be made for them in
the below-provided section.
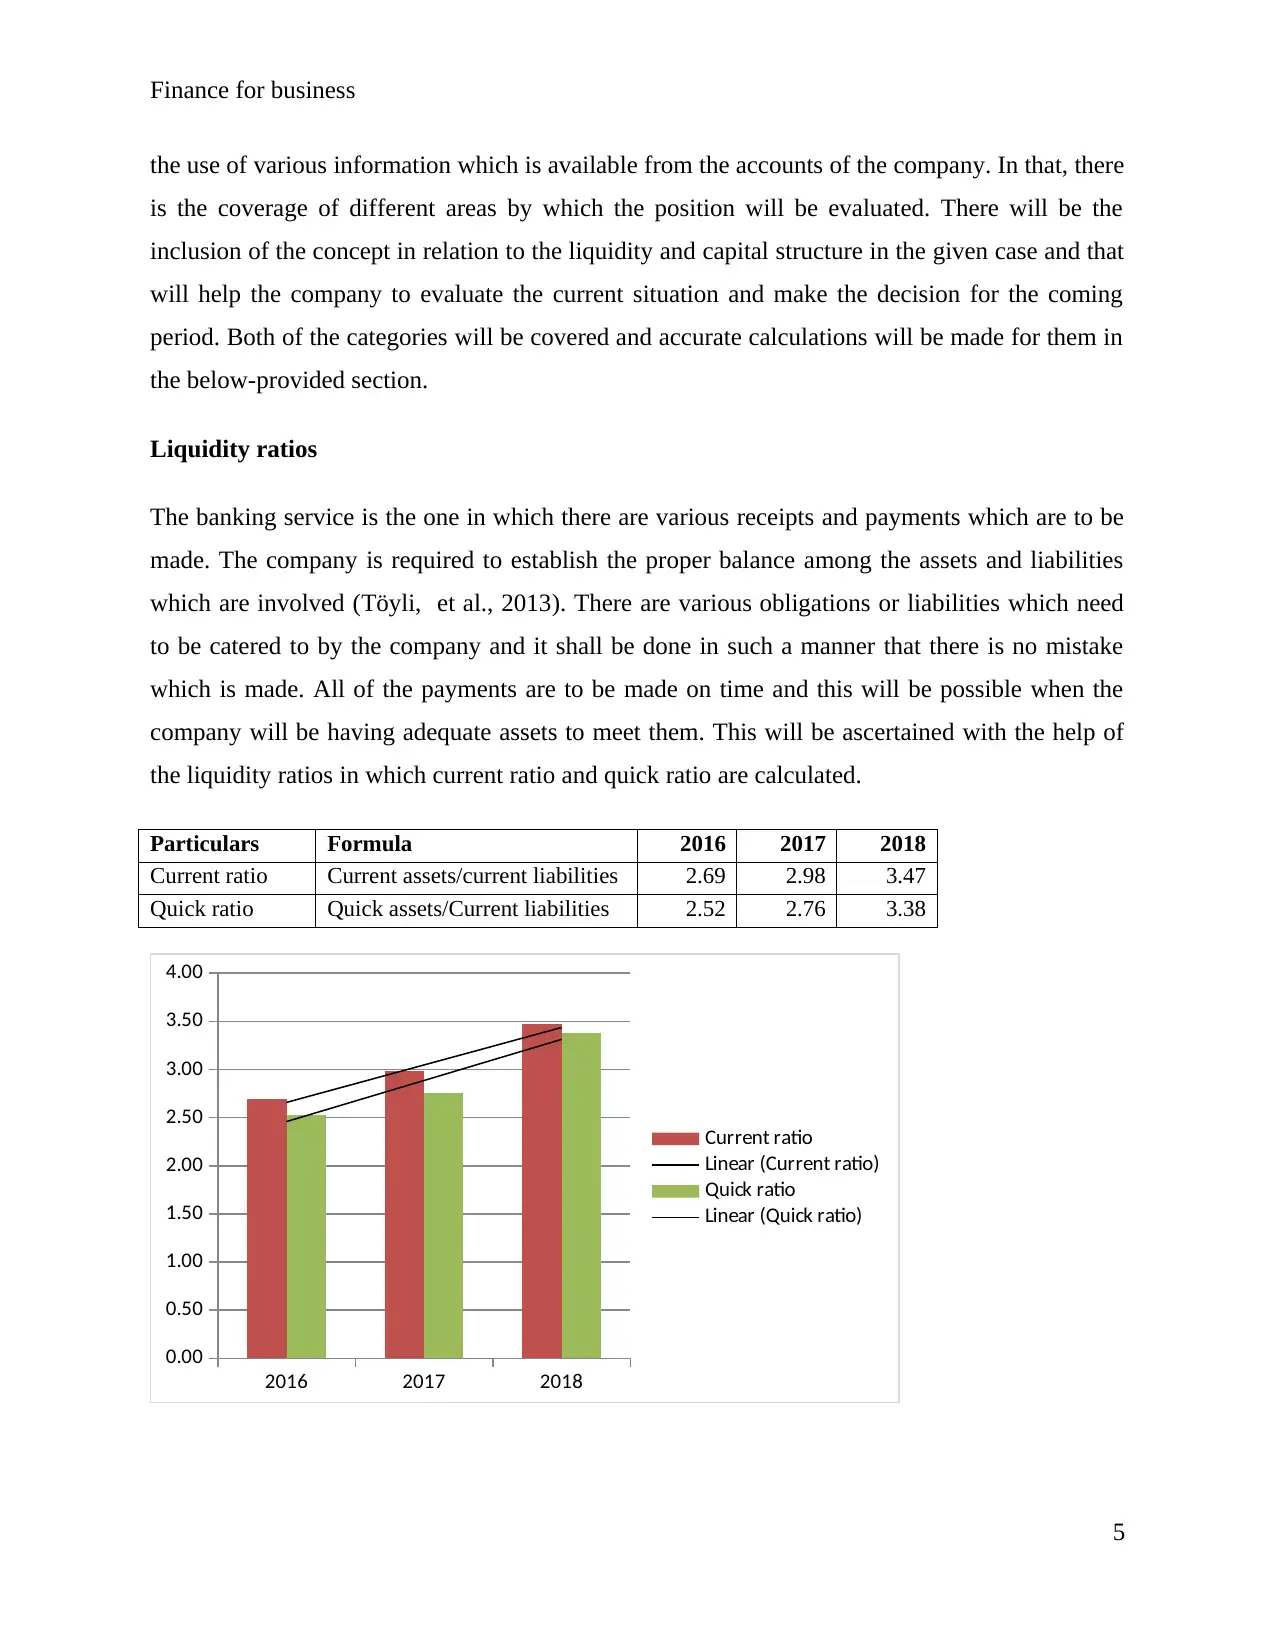
Liquidity ratios
The banking service is the one in which there are various receipts and payments which are to be
made. The company is required to establish the proper balance among the assets and liabilities
which are involved (Töyli, et al., 2013). There are various obligations or liabilities which need
to be catered to by the company and it shall be done in such a manner that there is no mistake
which is made. All of the payments are to be made on time and this will be possible when the
company will be having adequate assets to meet them. This will be ascertained with the help of
the liquidity ratios in which current ratio and quick ratio are calculated.
Particulars Formula 2016 2017 2018
Current ratio Current assets/current liabilities 2.69 2.98 3.47
Quick ratio Quick assets/Current liabilities 2.52 2.76 3.38
2016 2017 2018
0.00
0.50
1.00
1.50
2.00
2.50
3.00
3.50
4.00
Current ratio
Linear (Current ratio)
Quick ratio
Linear (Quick ratio)
5
the use of various information which is available from the accounts of the company. In that, there
is the coverage of different areas by which the position will be evaluated. There will be the
inclusion of the concept in relation to the liquidity and capital structure in the given case and that
will help the company to evaluate the current situation and make the decision for the coming
period. Both of the categories will be covered and accurate calculations will be made for them in
the below-provided section.
Liquidity ratios
The banking service is the one in which there are various receipts and payments which are to be
made. The company is required to establish the proper balance among the assets and liabilities
which are involved (Töyli, et al., 2013). There are various obligations or liabilities which need
to be catered to by the company and it shall be done in such a manner that there is no mistake
which is made. All of the payments are to be made on time and this will be possible when the
company will be having adequate assets to meet them. This will be ascertained with the help of
the liquidity ratios in which current ratio and quick ratio are calculated.
Particulars Formula 2016 2017 2018
Current ratio Current assets/current liabilities 2.69 2.98 3.47
Quick ratio Quick assets/Current liabilities 2.52 2.76 3.38
2016 2017 2018
0.00
0.50
1.00
1.50
2.00
2.50
3.00
3.50
4.00
Current ratio
Linear (Current ratio)
Quick ratio
Linear (Quick ratio)
5
Finance for business
The company is having a strong liquid position and this has been ascertained with the help of the
calculations that are made. It has also been represented in the graph that there is an upward trend
which is involved. The ratios of the company are rising and this shows that it will be a positive
situation for the company. All of the liabilities which are involved with the company will be paid
in an adequate manner and there will be payment of them at the time they arise due. This will be
maintained in the future and for that, the required decisions will be made which are helpful for
the company.
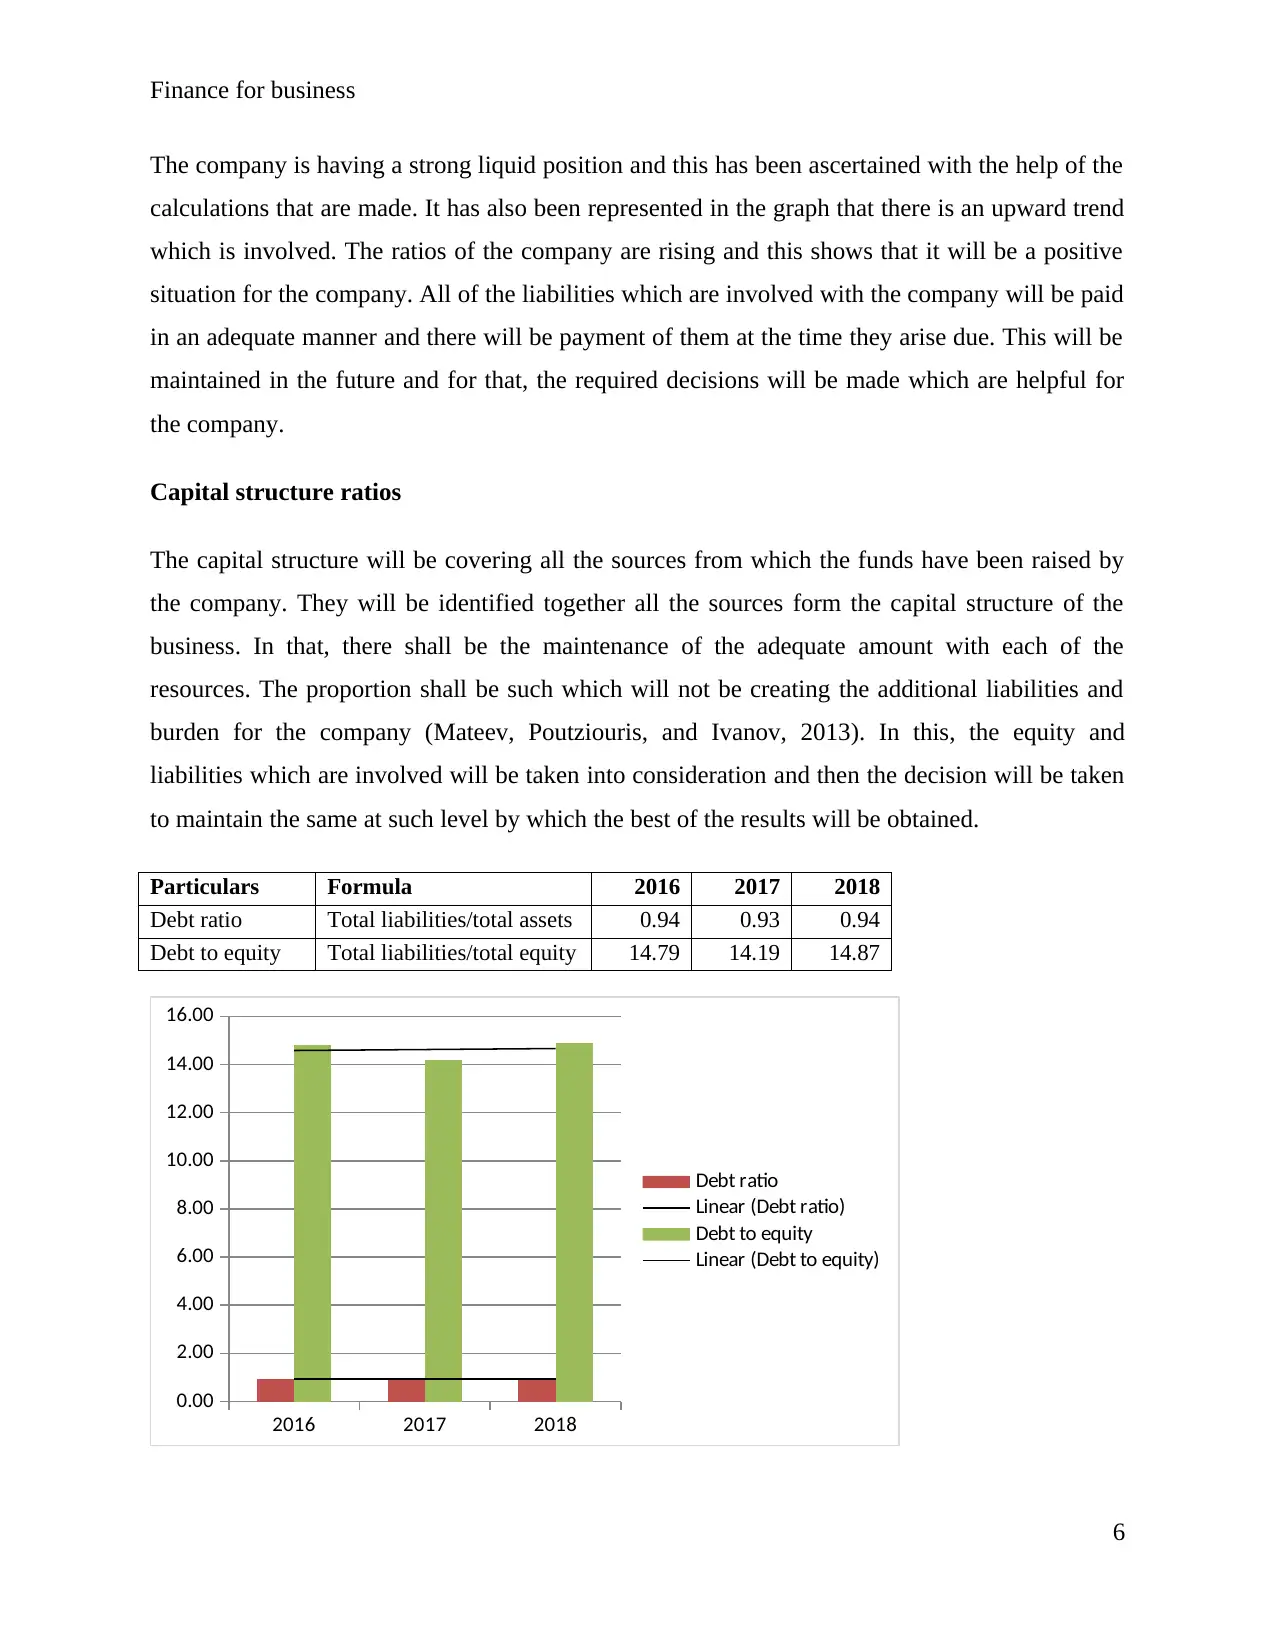
Capital structure ratios
The capital structure will be covering all the sources from which the funds have been raised by
the company. They will be identified together all the sources form the capital structure of the
business. In that, there shall be the maintenance of the adequate amount with each of the
resources. The proportion shall be such which will not be creating the additional liabilities and
burden for the company (Mateev, Poutziouris, and Ivanov, 2013). In this, the equity and
liabilities which are involved will be taken into consideration and then the decision will be taken
to maintain the same at such level by which the best of the results will be obtained.
Particulars Formula 2016 2017 2018
Debt ratio Total liabilities/total assets 0.94 0.93 0.94
Debt to equity Total liabilities/total equity 14.79 14.19 14.87
2016 2017 2018
0.00
2.00
4.00
6.00
8.00
10.00
12.00
14.00
16.00
Debt ratio
Linear (Debt ratio)
Debt to equity
Linear (Debt to equity)
6
The company is having a strong liquid position and this has been ascertained with the help of the
calculations that are made. It has also been represented in the graph that there is an upward trend
which is involved. The ratios of the company are rising and this shows that it will be a positive
situation for the company. All of the liabilities which are involved with the company will be paid
in an adequate manner and there will be payment of them at the time they arise due. This will be
maintained in the future and for that, the required decisions will be made which are helpful for
the company.
Capital structure ratios
The capital structure will be covering all the sources from which the funds have been raised by
the company. They will be identified together all the sources form the capital structure of the
business. In that, there shall be the maintenance of the adequate amount with each of the
resources. The proportion shall be such which will not be creating the additional liabilities and
burden for the company (Mateev, Poutziouris, and Ivanov, 2013). In this, the equity and
liabilities which are involved will be taken into consideration and then the decision will be taken
to maintain the same at such level by which the best of the results will be obtained.
Particulars Formula 2016 2017 2018
Debt ratio Total liabilities/total assets 0.94 0.93 0.94
Debt to equity Total liabilities/total equity 14.79 14.19 14.87
2016 2017 2018
0.00
2.00
4.00
6.00
8.00
10.00
12.00
14.00
16.00
Debt ratio
Linear (Debt ratio)
Debt to equity
Linear (Debt to equity)
6
Finance for business
The position of the company is almost constant in all the years as there are very fewer chances
which are made in the capital structure of the company. With the help of this, it is ascertained
that the amount of the debt which is involved in the business is very high in comparison to the
equity which is involved (ANZ bank, 2017). There is the need for the improvement by which the
change can be made and this situation can be modified. This is the stage at which company will
be facing high cost of the debts and that increases the overall cost of the business thereby
affecting the incomes in an adverse manner. The raising of the equity will be focused by which
the charges will be reduced and money which is paid as interest will be saved.
2.3 Non-current asset analysis
The company is involved in the banking services and in that the main non-current asset which is
involved with the business is the investment which is made. The same has been noted and in that
it is ascertained that there is an increase which is made in the amount of the investments which
are involved. The need to change arises and with that, the position of the assets is also changing.
The property which is included in the books is facing certain decline and that will be required to
be considered (Spitz et al., 2012). There is the reduction which is made in the balance of the
plant and property which are held in the business. All the assets which are involved are charged
with the depreciation so that their depletion can be recorded in an adequate manner. For this, the
use of the straight-line method is made by the business in which all the cost will be covered and
distributed to the life of the asset in an equal manner. There will be consideration of the cost of
the asset and its useful life and then the depreciation amount which needs to be charged will be
calculated with the help of the same.
The evaluation which is made for the entire asset will be helpful for the company as it will be
taking all the decisions on the basis of the same and that will be in the interest of the company.
The changes which are made have been identified and they will be considered to decide the
change which needs to be made in the coming period. By that, there will be an adequate balance
of the assets which will be maintained in the company.
7
Paraphrase This Document
Need a fresh take? Get an instant paraphrase of this document with our AI Paraphraser
Finance for business
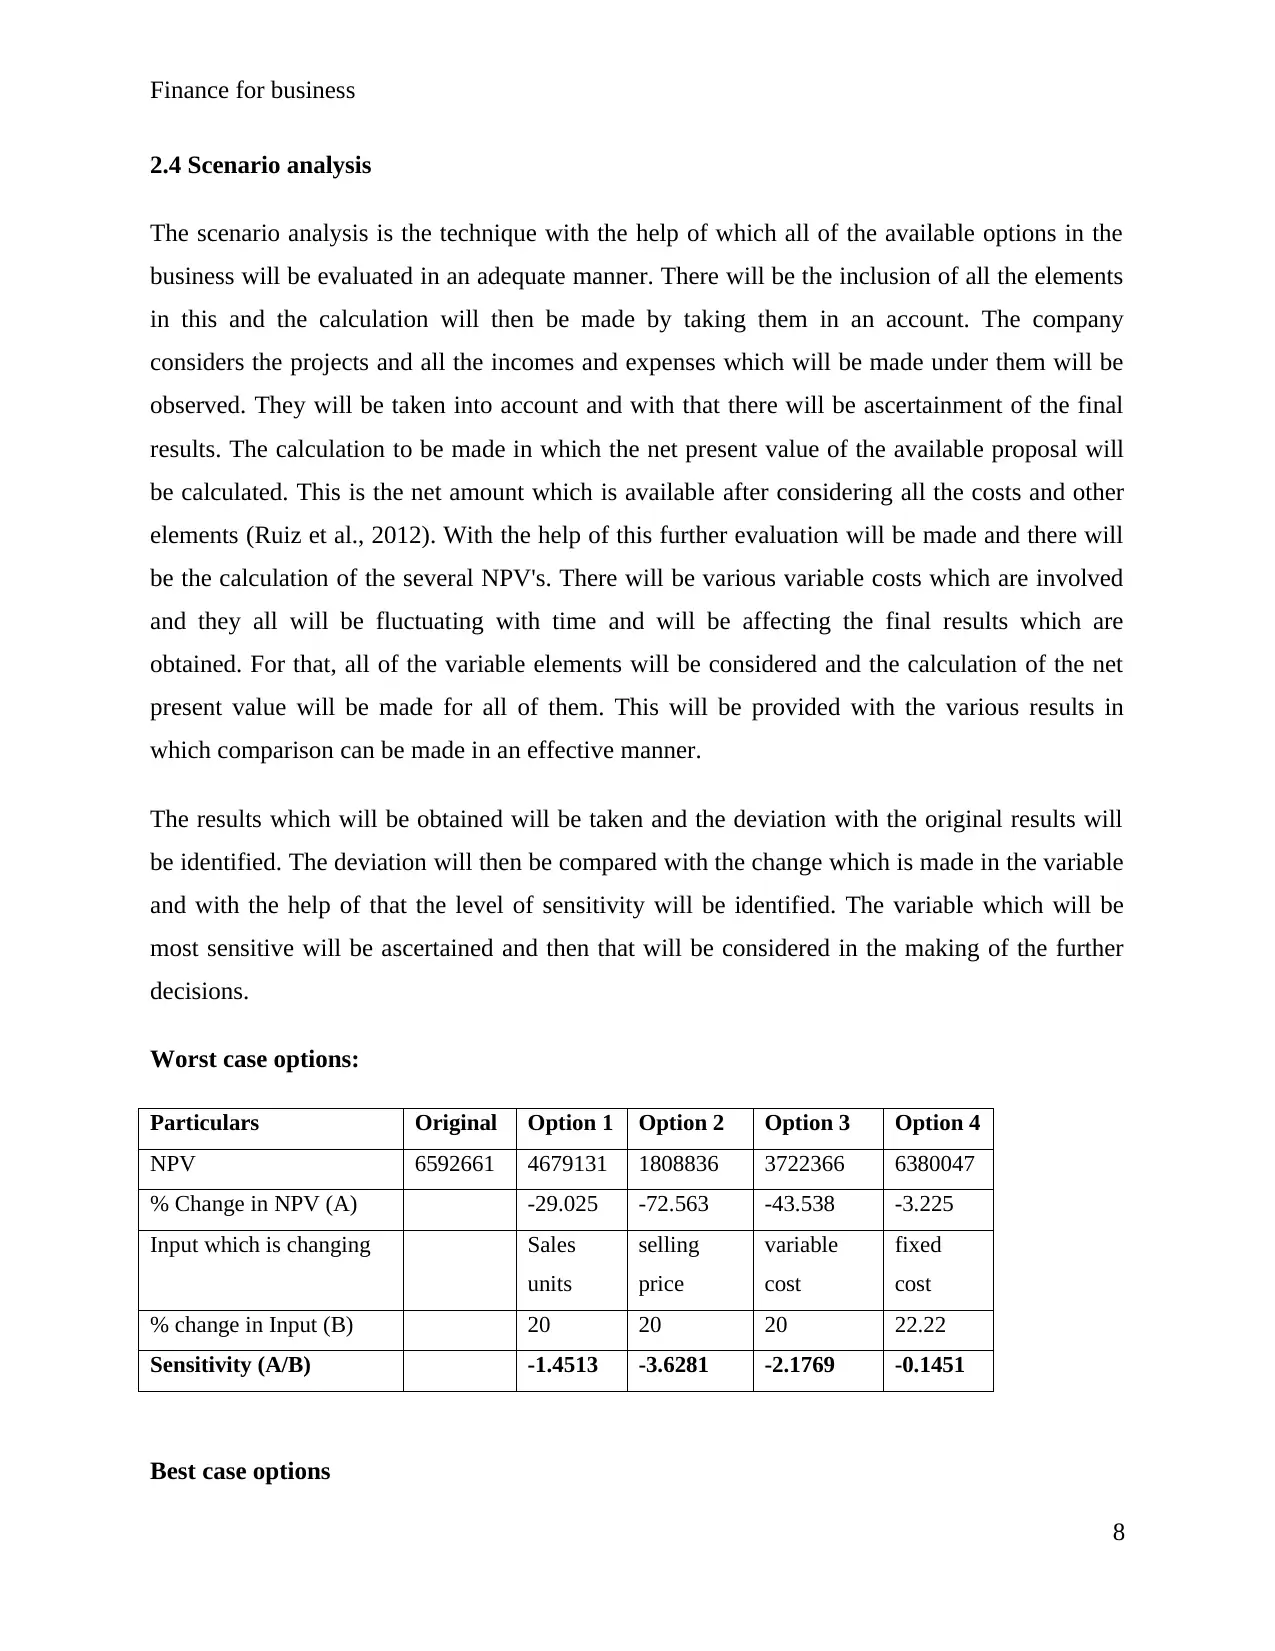
2.4 Scenario analysis
The scenario analysis is the technique with the help of which all of the available options in the
business will be evaluated in an adequate manner. There will be the inclusion of all the elements
in this and the calculation will then be made by taking them in an account. The company
considers the projects and all the incomes and expenses which will be made under them will be
observed. They will be taken into account and with that there will be ascertainment of the final
results. The calculation to be made in which the net present value of the available proposal will
be calculated. This is the net amount which is available after considering all the costs and other
elements (Ruiz et al., 2012). With the help of this further evaluation will be made and there will
be the calculation of the several NPV's. There will be various variable costs which are involved
and they all will be fluctuating with time and will be affecting the final results which are
obtained. For that, all of the variable elements will be considered and the calculation of the net
present value will be made for all of them. This will be provided with the various results in
which comparison can be made in an effective manner.
The results which will be obtained will be taken and the deviation with the original results will
be identified. The deviation will then be compared with the change which is made in the variable
and with the help of that the level of sensitivity will be identified. The variable which will be
most sensitive will be ascertained and then that will be considered in the making of the further
decisions.
Worst case options:
Particulars Original Option 1 Option 2 Option 3 Option 4
NPV 6592661 4679131 1808836 3722366 6380047
% Change in NPV (A) -29.025 -72.563 -43.538 -3.225
Input which is changing Sales
units
selling
price
variable
cost
fixed
cost
% change in Input (B) 20 20 20 22.22
Sensitivity (A/B) -1.4513 -3.6281 -2.1769 -0.1451
Best case options
8
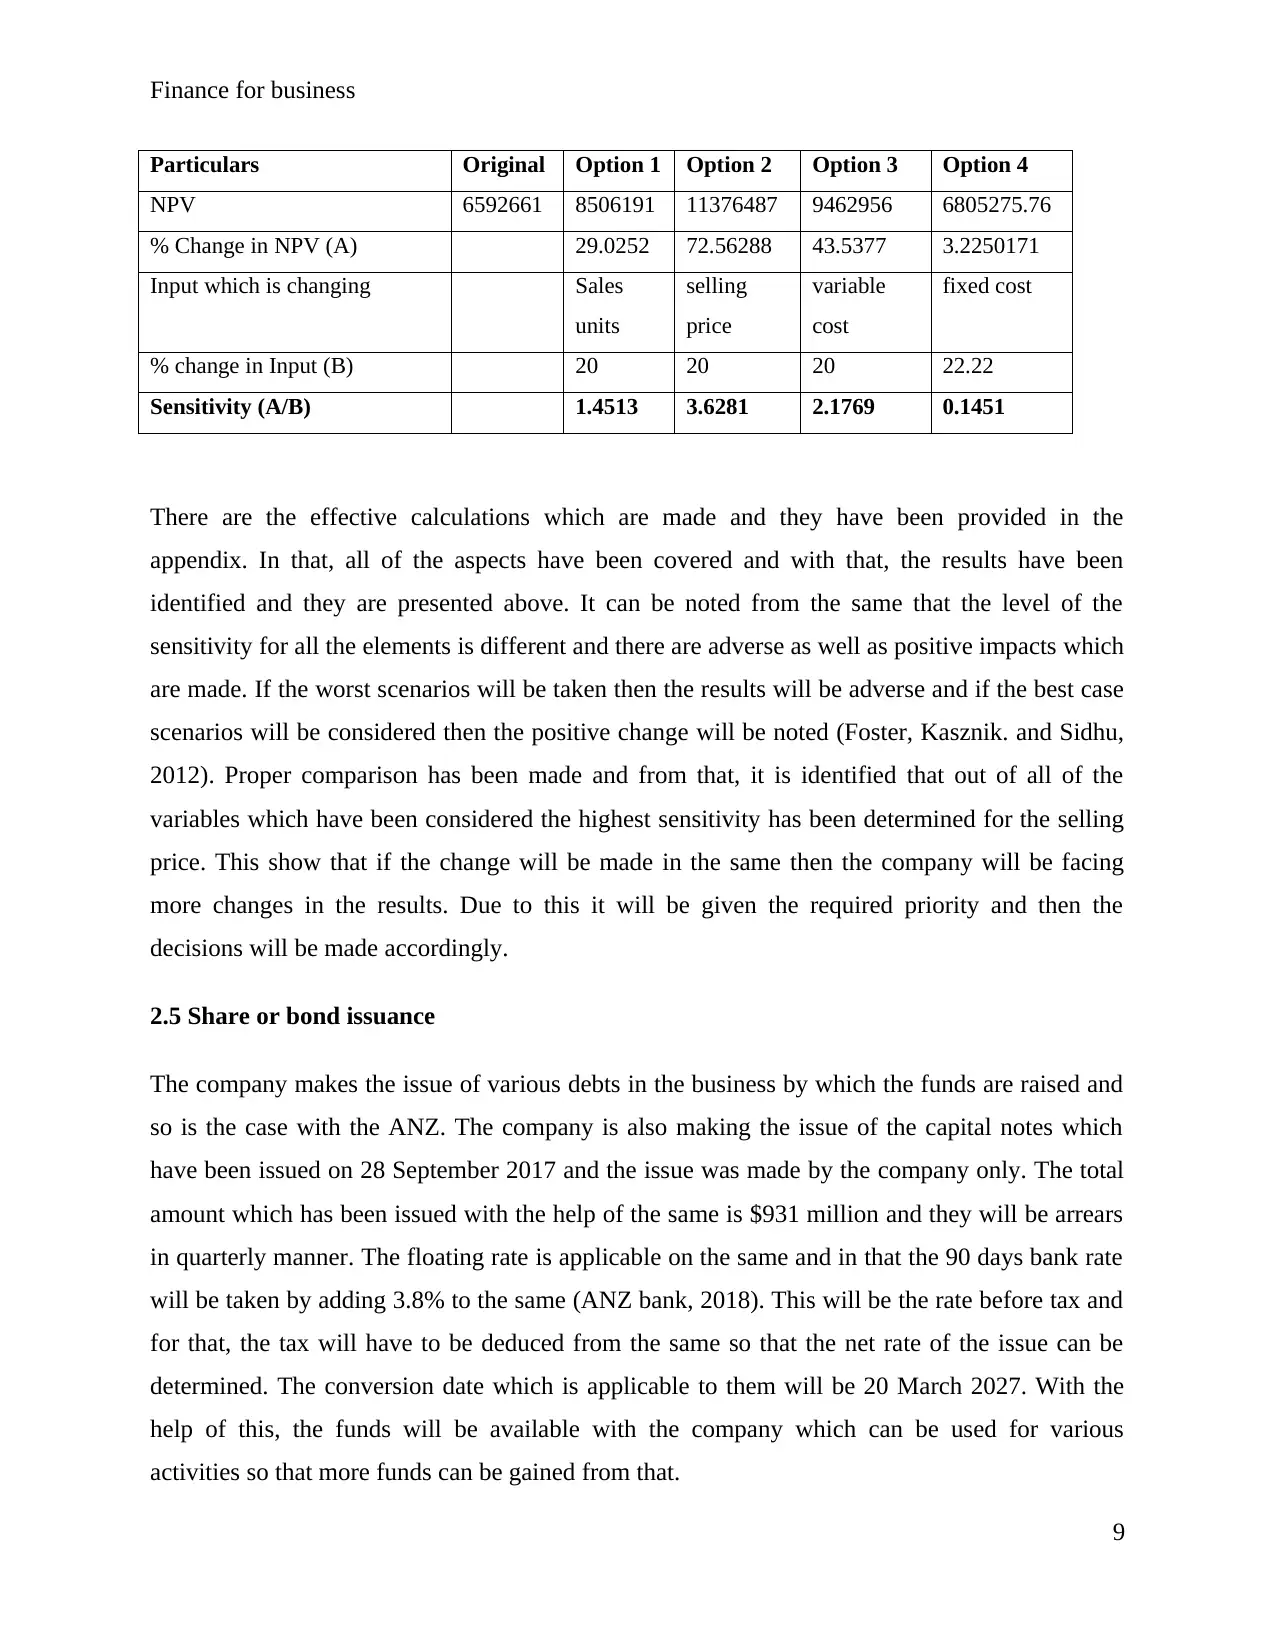
Finance for business
Particulars Original Option 1 Option 2 Option 3 Option 4
NPV 6592661 8506191 11376487 9462956 6805275.76
% Change in NPV (A) 29.0252 72.56288 43.5377 3.2250171
Input which is changing Sales
units
selling
price
variable
cost
fixed cost
% change in Input (B) 20 20 20 22.22
Sensitivity (A/B) 1.4513 3.6281 2.1769 0.1451
There are the effective calculations which are made and they have been provided in the
appendix. In that, all of the aspects have been covered and with that, the results have been
identified and they are presented above. It can be noted from the same that the level of the
sensitivity for all the elements is different and there are adverse as well as positive impacts which
are made. If the worst scenarios will be taken then the results will be adverse and if the best case
scenarios will be considered then the positive change will be noted (Foster, Kasznik. and Sidhu,
2012). Proper comparison has been made and from that, it is identified that out of all of the
variables which have been considered the highest sensitivity has been determined for the selling
price. This show that if the change will be made in the same then the company will be facing
more changes in the results. Due to this it will be given the required priority and then the
decisions will be made accordingly.
2.5 Share or bond issuance
The company makes the issue of various debts in the business by which the funds are raised and
so is the case with the ANZ. The company is also making the issue of the capital notes which
have been issued on 28 September 2017 and the issue was made by the company only. The total
amount which has been issued with the help of the same is $931 million and they will be arrears
in quarterly manner. The floating rate is applicable on the same and in that the 90 days bank rate
will be taken by adding 3.8% to the same (ANZ bank, 2018). This will be the rate before tax and
for that, the tax will have to be deduced from the same so that the net rate of the issue can be
determined. The conversion date which is applicable to them will be 20 March 2027. With the
help of this, the funds will be available with the company which can be used for various
activities so that more funds can be gained from that.
9
Finance for business
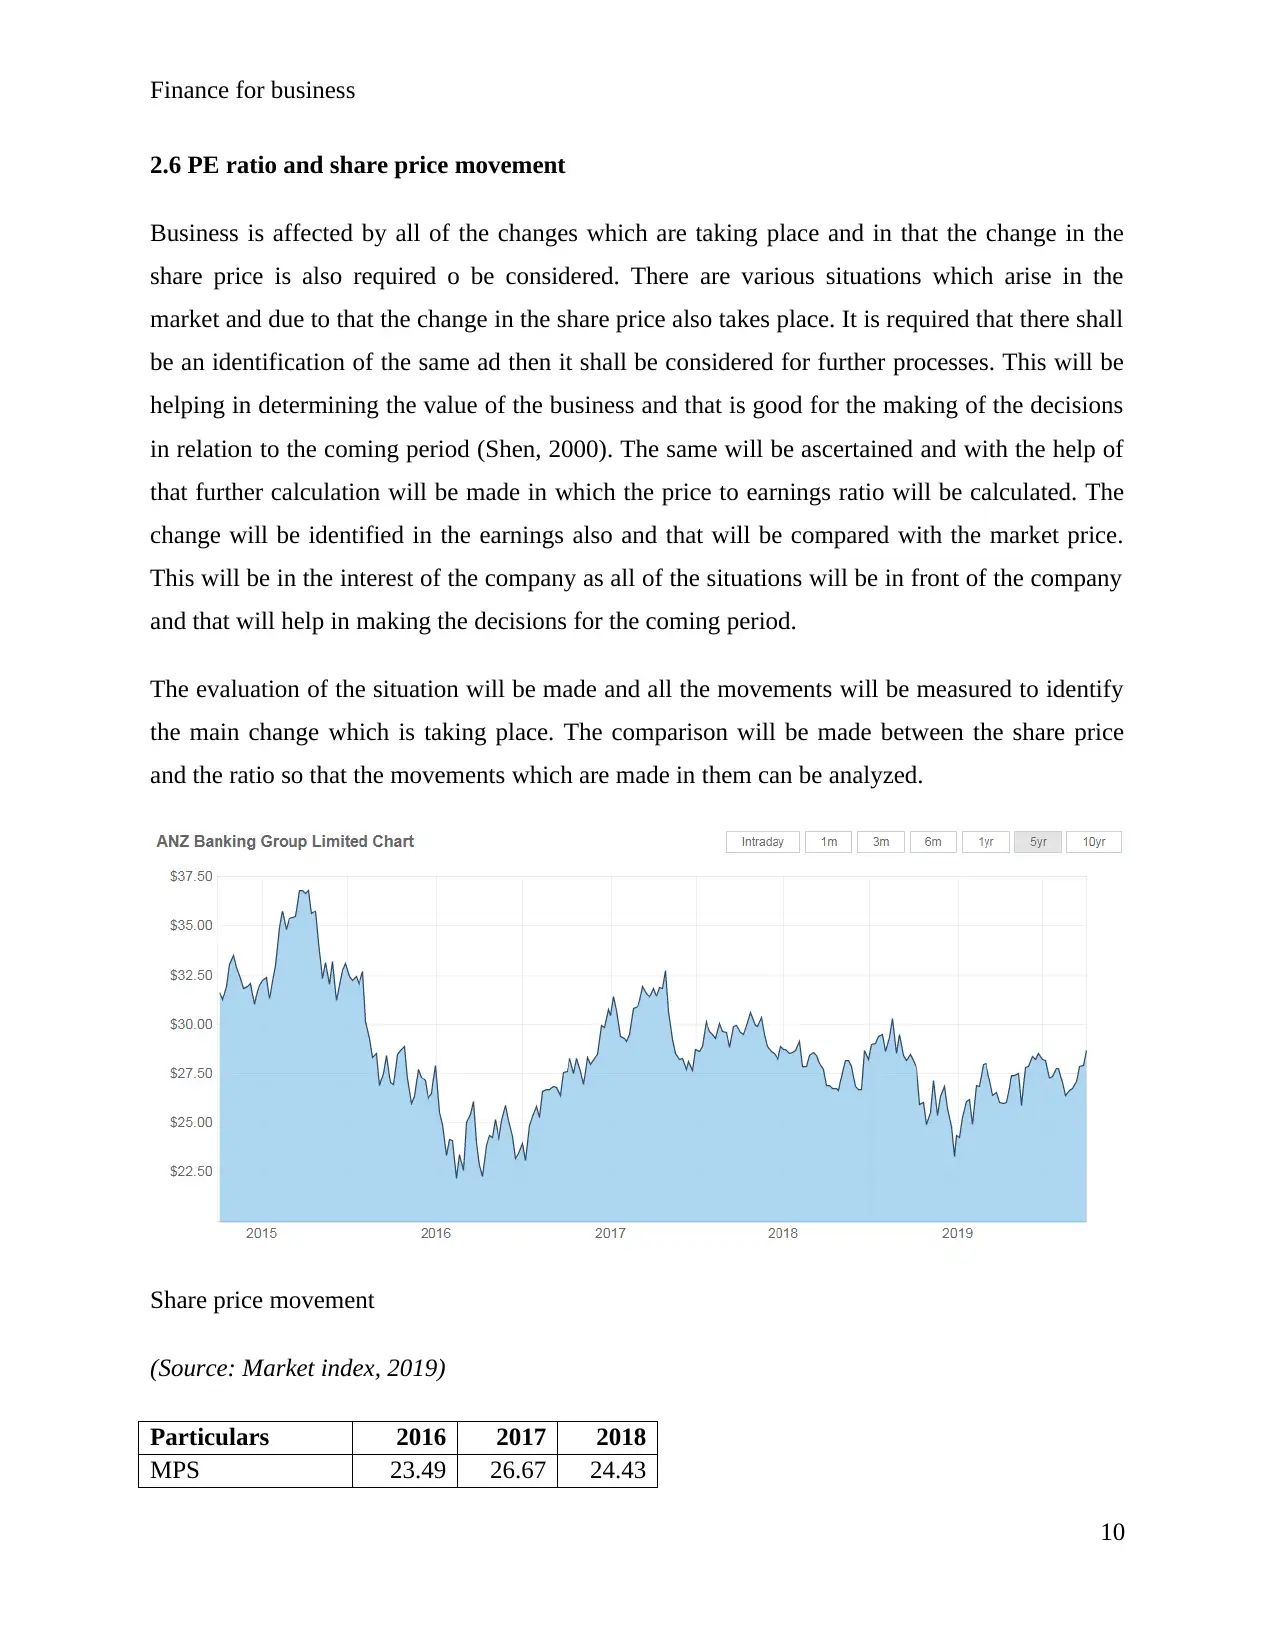
2.6 PE ratio and share price movement
Business is affected by all of the changes which are taking place and in that the change in the
share price is also required o be considered. There are various situations which arise in the
market and due to that the change in the share price also takes place. It is required that there shall
be an identification of the same ad then it shall be considered for further processes. This will be
helping in determining the value of the business and that is good for the making of the decisions
in relation to the coming period (Shen, 2000). The same will be ascertained and with the help of
that further calculation will be made in which the price to earnings ratio will be calculated. The
change will be identified in the earnings also and that will be compared with the market price.
This will be in the interest of the company as all of the situations will be in front of the company
and that will help in making the decisions for the coming period.
The evaluation of the situation will be made and all the movements will be measured to identify
the main change which is taking place. The comparison will be made between the share price
and the ratio so that the movements which are made in them can be analyzed.
Share price movement
(Source: Market index, 2019)
Particulars 2016 2017 2018
MPS 23.49 26.67 24.43
10
Secure Best Marks with AI Grader
Need help grading? Try our AI Grader for instant feedback on your assignments.
Finance for business
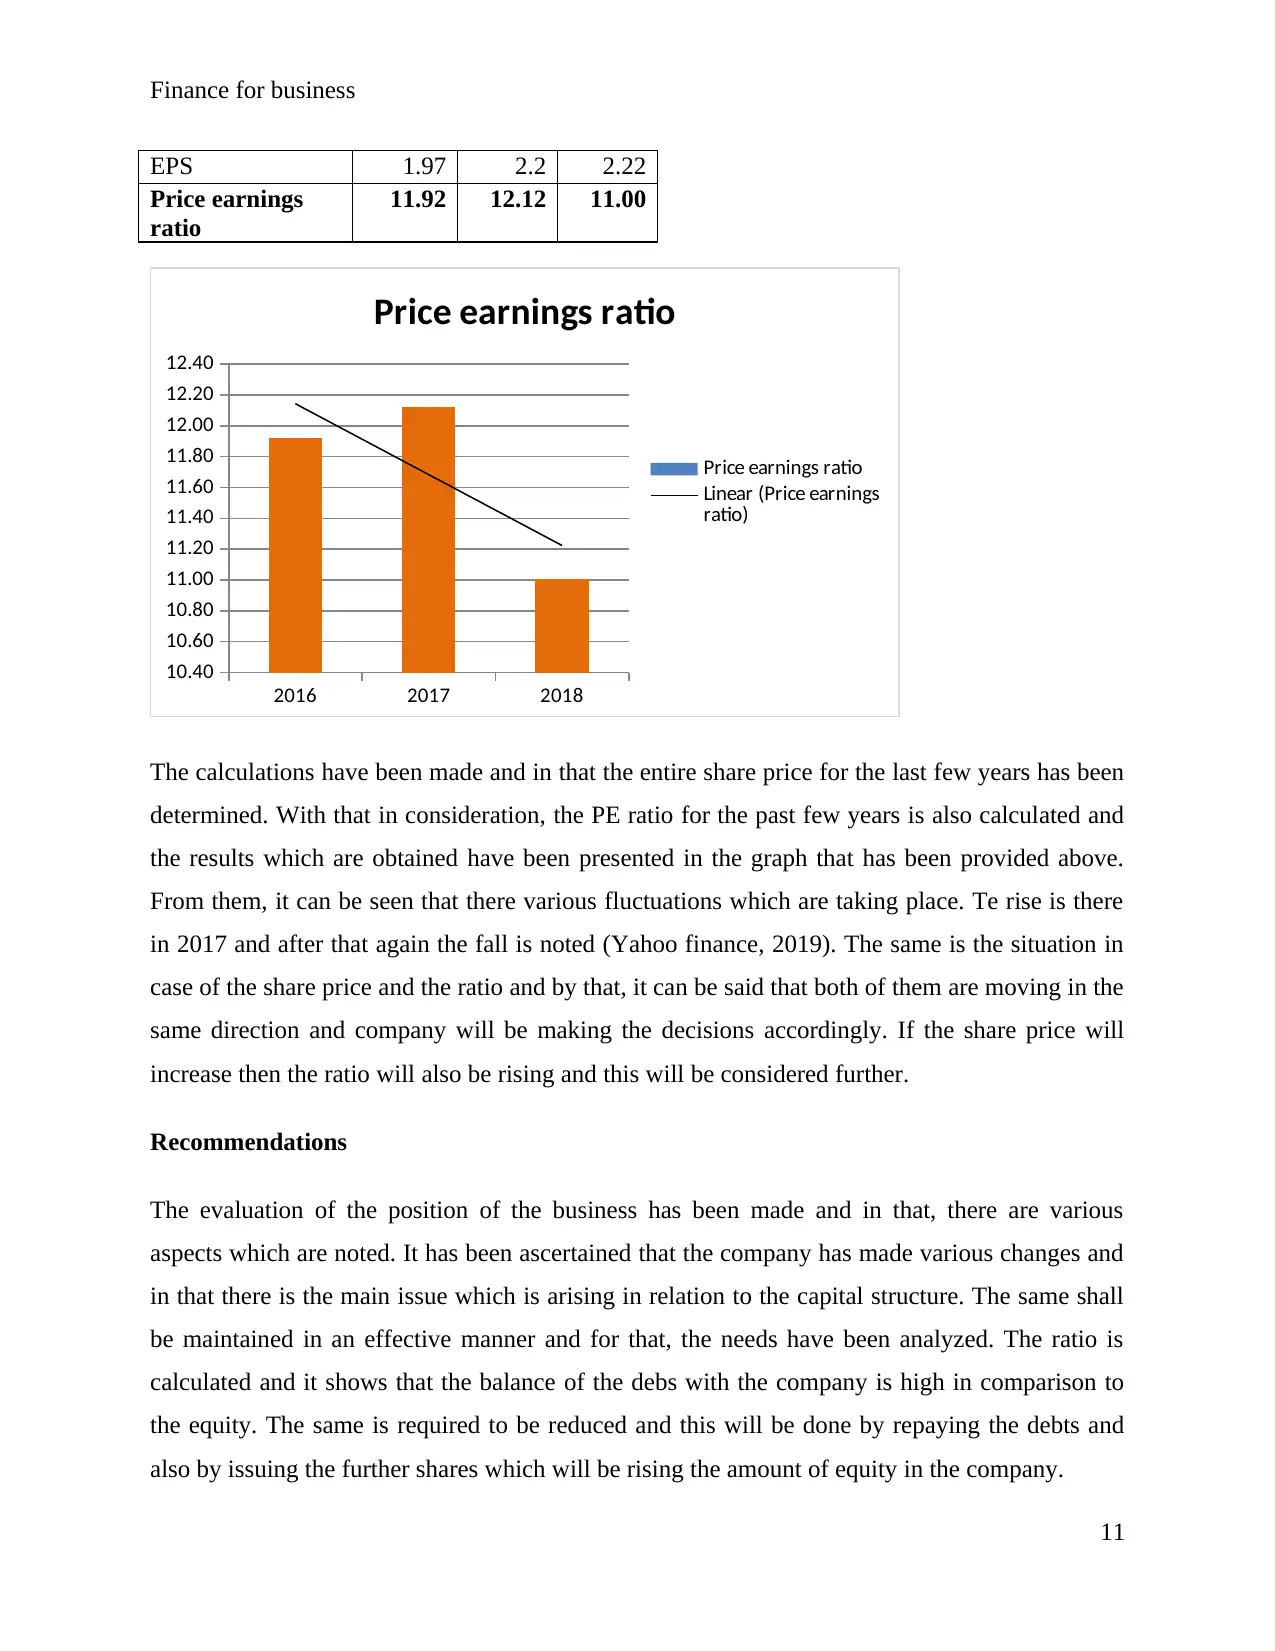
EPS 1.97 2.2 2.22
Price earnings
ratio
11.92 12.12 11.00
2016 2017 2018
10.40
10.60
10.80
11.00
11.20
11.40
11.60
11.80
12.00
12.20
12.40
Price earnings ratio
Price earnings ratio
Linear (Price earnings
ratio)
The calculations have been made and in that the entire share price for the last few years has been
determined. With that in consideration, the PE ratio for the past few years is also calculated and
the results which are obtained have been presented in the graph that has been provided above.
From them, it can be seen that there various fluctuations which are taking place. Te rise is there
in 2017 and after that again the fall is noted (Yahoo finance, 2019). The same is the situation in
case of the share price and the ratio and by that, it can be said that both of them are moving in the
same direction and company will be making the decisions accordingly. If the share price will
increase then the ratio will also be rising and this will be considered further.
Recommendations
The evaluation of the position of the business has been made and in that, there are various
aspects which are noted. It has been ascertained that the company has made various changes and
in that there is the main issue which is arising in relation to the capital structure. The same shall
be maintained in an effective manner and for that, the needs have been analyzed. The ratio is
calculated and it shows that the balance of the debs with the company is high in comparison to
the equity. The same is required to be reduced and this will be done by repaying the debts and
also by issuing the further shares which will be rising the amount of equity in the company.
11
Finance for business
Conclusion
The prepared report is in respect of the ANZ bank and the services which are provided by it. In
this, there has been involvement of the various aspects and the services which are provided by
the company have also been taken into consideration. There is the roper information which is
collected in that respect and it will be beneficial for the users. The ratio analysis is made and in
that the calculation which was required has been made. There is the determination of the position
of the capital structure and liquidity of the company. All of the results have been availed and
they will be used for other processes. The noncurrent assets which are involved have been
considered and all of the changes which have been made in them are also identified. There is
consideration of the depreciation method which is taken for the particular asset. The sensitivity
test is carried and in that, all of the required calculations have been made. The results are
identified and resented and with that selling price is identified as the variable which will be
highly sensitive. The share price movements and the calculation of the ratio with the help of that
have been made and proper relation is made among them.
12
Finance for business
References
ANZ bank. (2017) Annual report.[Online] Available at:
https://www.anz.com/content/dam/anzcom/shareholder/2017_anz_annual_report.pdf [Accessed
28 September 2019]
ANZ bank. (2018) Annual report.[Online] Available at:
https://www.anz.com/content/dam/anzcom/shareholder/anz_2018_annual_report_final.pdf
[Accessed 28 September 2019]
ANZ bank. (2019) Products and services. [Online] Available at:
https://www.anz.com/corporate/products-services/ [Accessed 28 September 2019]
Babalola, Y.A., and Abiola, F.R. (2013) Financial ratio analysis of firms: A tool for decision
making. International journal of management sciences, 1(4), pp.132-137.
Foster, G., Kasznik, R. and Sidhu, B.K. (2012) International equity valuation: the relative
importance of country and industry factors versus company‐specific financial reporting
information. Accounting & Finance, 52(3), pp.767-814.
Market index. (2019) ANZ Banking Group Limited Chart. [Online] Available at:
https://www.marketindex.com.au/asx/anz [Accessed 28 September 2019]
Mateev, M., Poutziouris, P. and Ivanov, K. (2013) On the determinants of SME capital structure
in Central and Eastern Europe: A dynamic panel analysis. Research in International Business and
Finance, 27(1), pp.28-51.
Ruiz, P.A., Foster, J.M., Rudkevich, A. and Caramanis, M.C. (2012).Tractable transmission
topology control using sensitivity analysis. IEEE Transactions on Power Systems, 27(3),
pp.1550-1559.
Shen, P. (2000) The P/E ratio and stock market performance. Economic Review-Federal Reserve
Bank of Kansas City, 85(4), pp.23-36.
13
Paraphrase This Document
Need a fresh take? Get an instant paraphrase of this document with our AI Paraphraser
Finance for business
Spitz, C., Mora, L., Wurtz, E. and Jay, A. (2012) Practical application of uncertainty analysis and
sensitivity analysis on an experimental house. Energy and Buildings, 55, pp.459-470.
Töyli, J., Lorentz, H., Ojala, L., Hofmann, E. and Lampe, K. (2013) Financial statement analysis
of logistics service providers: ways of enhancing performance. International Journal of Physical
Distribution & Logistics Management.
Yahoo finance. (2019) Australia and New Zealand Banking Group Limited (ANZ.AX).[Online]
Available at: https://au.finance.yahoo.com/quote/ANZ.AX/history/ [Accessed 28 September
2019]
Appendix
14
1 out of 14


Your All-in-One AI-Powered Toolkit for Academic Success.
+13062052269
info@desklib.com
Available 24*7 on WhatsApp / Email
![[object Object]](/_next/static/media/star-bottom.7253800d.svg)
Unlock your academic potential
© 2024 | Zucol Services PVT LTD | All rights reserved.