International Review of Economics & Finance
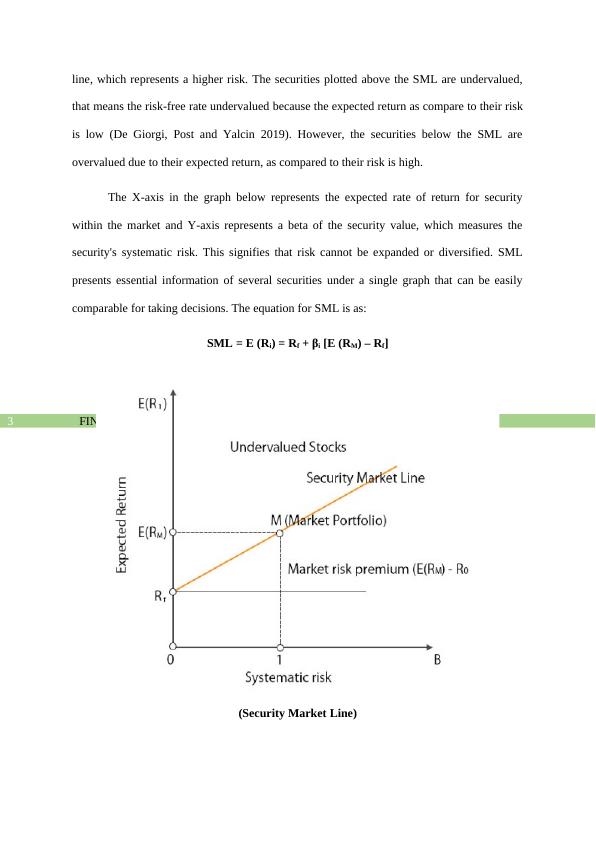
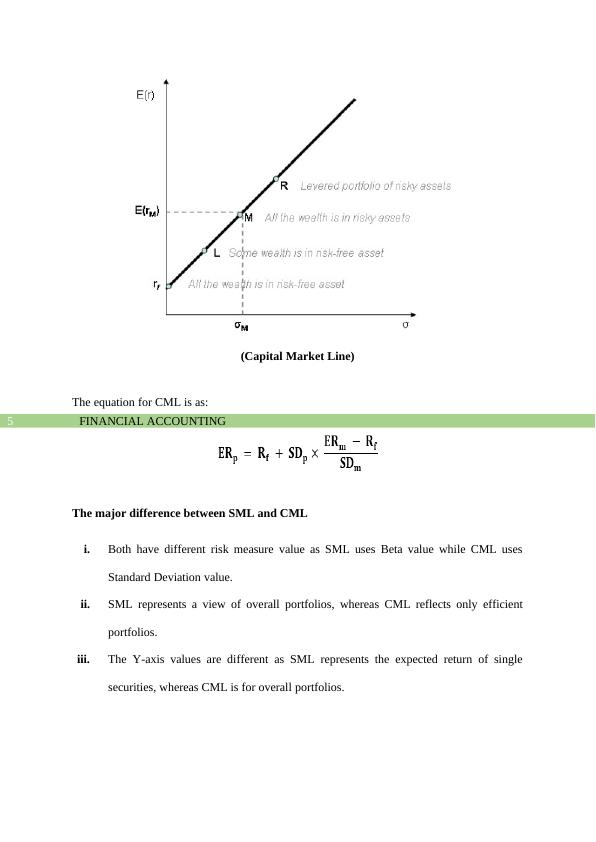
Explain and graphically depict the differences between Security Market Line (SML) and Capital Market Line (CML), discuss the importance of minimum variance portfolios, and explain why CAPM equation is more relevant than other equations when calculating required rate of return.
13 Pages2882 Words31 Views
Added on 2022-08-23
International Review of Economics & Finance
Explain and graphically depict the differences between Security Market Line (SML) and Capital Market Line (CML), discuss the importance of minimum variance portfolios, and explain why CAPM equation is more relevant than other equations when calculating required rate of return.
Added on 2022-08-23
ShareRelated Documents
End of preview
Want to access all the pages? Upload your documents or become a member.
Corporate Financial Management: Differences between SML and CML, Minimum Variance Portfolios, and Relevancy of CAPM Approach
|12
|958
|375
Comparative Analysis of Security Market Line and Capital Market Line
|11
|2573
|269
Corporate Financial Management & Accounting Programs
|9
|2020
|19
Corporate Finance: SML and CML line, Minimum Variance Portfolio, CAPM Equation
|12
|2742
|285
Corporate Financial Statement: SML, CML, MVP and CAPM
|12
|2867
|289
Understanding Security Market Line and Capital Market Line in Financial Management
|13
|3198
|120