logo

Financial Analysis of Alpine Construction Ltd. and Maple Builders Ltd.


Added on  2023-06-10

28 Pages6853 Words117 Views
 | 
 | 
 | 
1
DIPLOMAINBUSINESS&ENTERPRISE MANAGEMENT(L7)
FINANCIALANALYSISFORMANAGERS
UNIT11624-
D
EMONSTRATEANDAPPLYKNOWLED
GEOF FINANCIALANALYSIS (V8) (10
CREDITS,L5)
&
UNIT9685-
WRITEANANALYTICALREPORT (V7)
(5 CREDITS,L5)
ASSESSMENT2:A SSIGNMENT/R EPORT
DUE:26/06/2018
Date of
Submission:
25/06/18
Name:Keyur Solanki
Student ID:181003C
Tutor: Bryce Hartel and Aimen Ubaid
Keyur solanki: 181008C
Financial Analysis of Alpine Construction Ltd. and Maple Builders Ltd._1

2
Executive summary
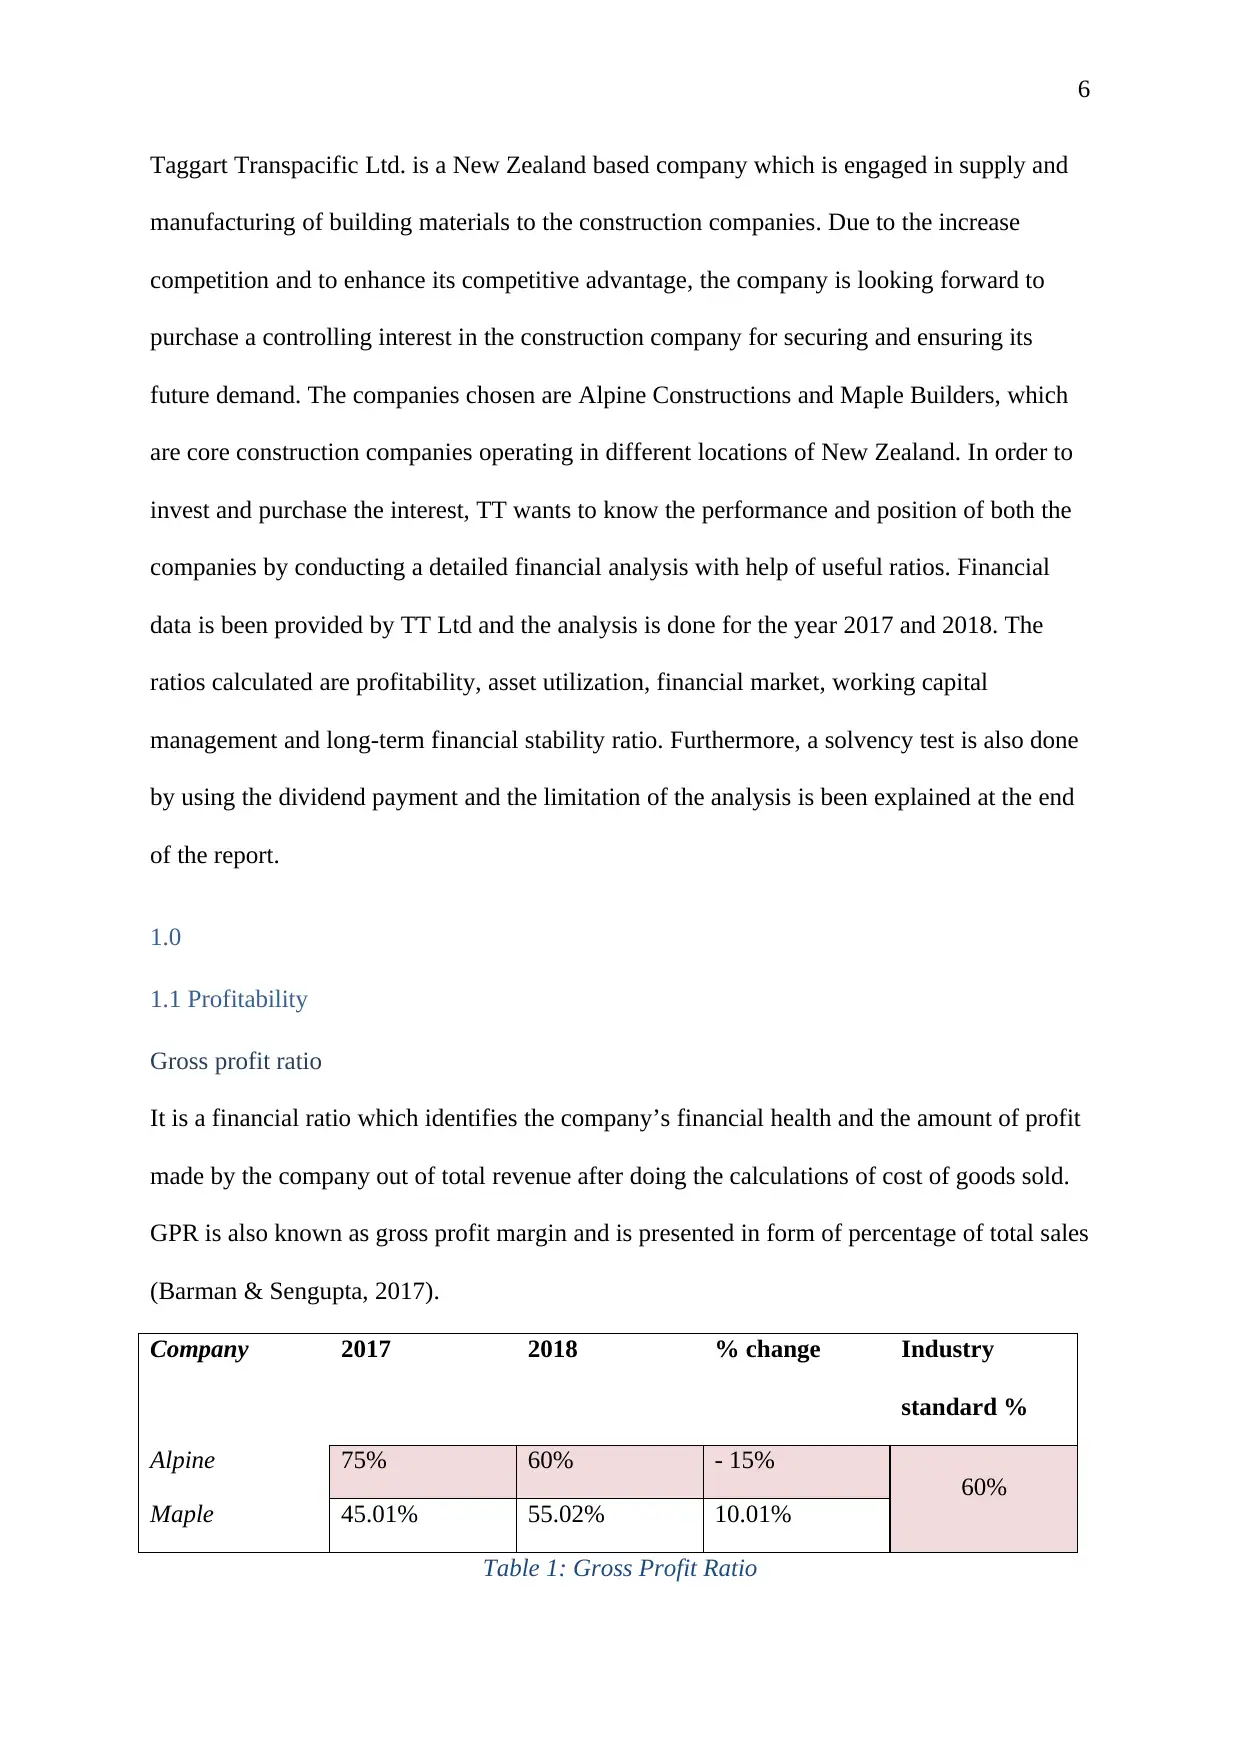
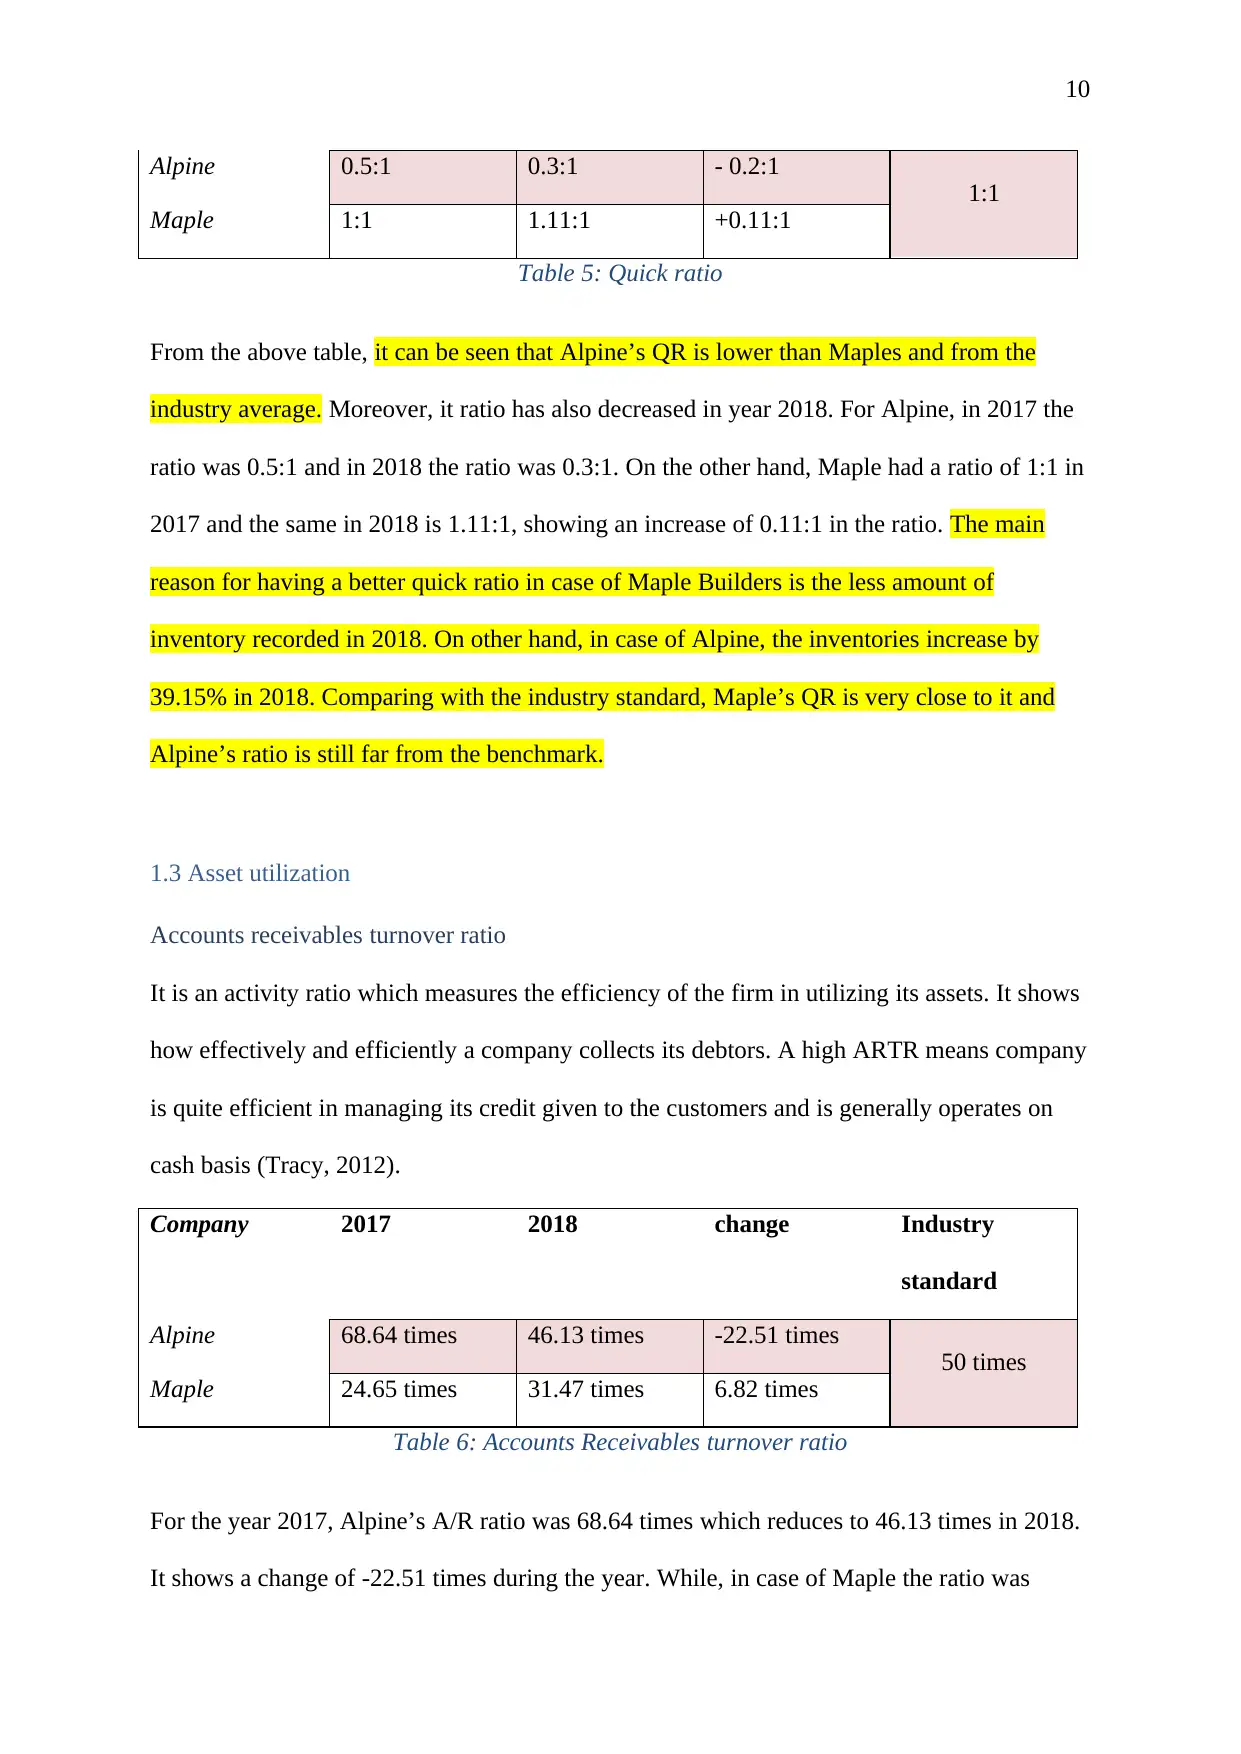
This report deals with an overall financial analysis of the two companies named as Alpine
Construction Ltd. and Maple builders Ltd. The report is been prepared for the board of
directors and owners of Taggart Transpacific Ltd. in order to advise and assist them regarding
their investment decisions. The two companies are situated in the different locations of New
Zealand. The report contains a detail analysis of companies’ performance by evaluating 11
financial ratios for the two financial years. This analysis will eventually help the board of
directors of TT to decide which company is doing well and whose performance is been
improved over the years. In the last, findings are been presented with the final conclusion.
From the analysis, it can be observed that the profitability ratios of Alpine Constructions have
been decreased from 2017 to 2018. Such as its GPR reduces from 75% to 60% over the years,
net profit margin falls to 13.11% from 22.5%; return on assets was reported at 64.74%,
showing a reduction of 60.71%. On the other hand, the ratios of Maple Builder have shown
an upsurge during the same financial year. Its gross profit ratio shows an increase of 10.01%
and net profit margin goes up by 3.68%. The same trend follows in Asset utilization ratios,
financial market ratios and working capital ratios. As far as solvency ratios are concerned, a
reduction is been there in case of both the companies.
In this report, the financial analysis of both the companies is performed and their position and
performance is compared to the industry standard. Considering the profitability ratios, two
ratios of Alpine are match with the industry benchmarks but are decreasing whereas Maple
does not match to the standard but its ratios are improving over the years. However, the scene
remains same for other ratios in case of both the companies. Apart from this, a solvency test
is also done on Alpine to check that whether the company is capable of paying its debt and
other obligations or not. In addition, some limitations of the analysis are also highlighted in
Financial Analysis of Alpine Construction Ltd. and Maple Builders Ltd._2

3
the report. For instance, investors can not only decide on the basis of two years data and these
ratios are not sufficient to judge a company’s position and performance. From this analysis,
investors can only figure out one thing that Alpine’s ratios has decreased over the years and
Maple’s numbers have increased.
Financial Analysis of Alpine Construction Ltd. and Maple Builders Ltd._3

4
Contents
Executive summary....................................................................................................................2
1.0...............................................................................................................................................5
1.1 Profitability.......................................................................................................................5
Gross profit ratio.................................................................................................................5
Net profit ratio....................................................................................................................6
Return on Total Asset.........................................................................................................6
1.2 Working capital management...........................................................................................7
Current ratio........................................................................................................................7
Quick ratio..........................................................................................................................8
1.3 Asset utilization................................................................................................................8
Accounts receivables turnover ratio...................................................................................8
Inventory turnover ratio......................................................................................................9
1.4 Financial markets..............................................................................................................9
Earnings per share...............................................................................................................9
Dividend per share............................................................................................................10
1.5 Solvency.........................................................................................................................11
Debt to assets ratios..........................................................................................................11
Debt to equity ratio...........................................................................................................11
1.6 Industry Benchmarking..................................................................................................12
2 Conclusions...........................................................................................................................13
3 Recommendation...................................................................................................................14
3.1 Which company to Divest from.....................................................................................14
3.2 Suggestions for improvements.......................................................................................15
4.0.............................................................................................................................................15
4.1 Solvency Test.....................................................................................................................15
4.2 Conclusion......................................................................................................................16
Financial Analysis of Alpine Construction Ltd. and Maple Builders Ltd._4

5
5 Limitation & Variations........................................................................................................16
5.1 Limitations......................................................................................................................16
5.2 Variations for different users..........................................................................................16
6.0 Appendix 1:........................................................................................................................17
6.1 Report Planning..............................................................................................................17
6.2 Purpose...........................................................................................................................17
6.3 Audience.........................................................................................................................17
6.4 Scope..............................................................................................................................17
6.5 Structure of the report.....................................................................................................18
7.0 Appendix 2.........................................................................................................................19
References................................................................................................................................20
List of Tables
Table 1: Gross Profit Ratio........................................................................................................4
Table 2: Net Profit Margin.........................................................................................................4
Table 3: Return on Total Assets.................................................................................................5
Table 4: Current ratios...............................................................................................................5
Table 5: Quick ratio...................................................................................................................6
Table 6: Accounts Receivables turnover ratio...........................................................................6
Table 7: Inventory Turnover ratio..............................................................................................6
Table 8: Earnings per share........................................................................................................7
Table 9: Dividend per share.......................................................................................................7
Table 10: Debt to total asset ratio..............................................................................................7
Table 11: Debt to equity ratio....................................................................................................8
Table 12: Industry Benchmarking..............................................................................................9
Introduction
Financial Analysis of Alpine Construction Ltd. and Maple Builders Ltd._5

6
Taggart Transpacific Ltd. is a New Zealand based company which is engaged in supply and
manufacturing of building materials to the construction companies. Due to the increase
competition and to enhance its competitive advantage, the company is looking forward to
purchase a controlling interest in the construction company for securing and ensuring its
future demand. The companies chosen are Alpine Constructions and Maple Builders, which
are core construction companies operating in different locations of New Zealand. In order to
invest and purchase the interest, TT wants to know the performance and position of both the
companies by conducting a detailed financial analysis with help of useful ratios. Financial
data is been provided by TT Ltd and the analysis is done for the year 2017 and 2018. The
ratios calculated are profitability, asset utilization, financial market, working capital
management and long-term financial stability ratio. Furthermore, a solvency test is also done
by using the dividend payment and the limitation of the analysis is been explained at the end
of the report.
1.0
1.1 Profitability
Gross profit ratio
It is a financial ratio which identifies the company’s financial health and the amount of profit
made by the company out of total revenue after doing the calculations of cost of goods sold.
GPR is also known as gross profit margin and is presented in form of percentage of total sales
(Barman & Sengupta, 2017).
Company 2017 2018 % change Industry
standard %
Alpine 75% 60% - 15%
60%
Maple 45.01% 55.02% 10.01%
Table 1: Gross Profit Ratio
Financial Analysis of Alpine Construction Ltd. and Maple Builders Ltd._6

End of preview

Want to access all the pages? Upload your documents or become a member.

Related Documents