Five-Year Comparative Financial Performance Analysis: Nestle vs Rex
VerifiedAdded on 2021/01/01
|33
|7362
|330
Report
AI Summary
This report presents a comprehensive financial analysis and management comparison between Nestle Malaysia Berhad and Rex Malaysia Bhd. It begins with an introduction to financial analysis and its importance, followed by background information on both companies, including their positions within the food and beverage industry. The core of the report involves a five-year comparative financial performance analysis, utilizing various ratios such as asset utilization, operating margin, net margin, return on capital employed, operating return ratio, and net ROI to assess profitability. Liquidity ratios, including the acid test ratio and cash ratio, are also examined. The analysis identifies the financial strengths and weaknesses of both companies, supported by tables and graphs illustrating the trends and fluctuations in the ratios. The report concludes with a discussion of the limitations of the analysis and provides relevant references.
Financial Analysis
and Management
and Management
Paraphrase This Document
Need a fresh take? Get an instant paraphrase of this document with our AI Paraphraser
Table of Contents
INTRODUCTION...........................................................................................................................1
SECTION 1.....................................................................................................................................2
Background of company..............................................................................................................2
Position of the company in industry in respect to its competitors...............................................3
SECTION2......................................................................................................................................4
Five years comparative financial performance analysis with the help of ratios..........................4
Summary analysis of the companies regarding financial strength..................................................4
SECTION 3:..................................................................................................................................17
Financial Performance for both companies...............................................................................17
SECTION 4:..................................................................................................................................19
Problems /limitations of the analysis and assumptions.............................................................19
CONCLUSION..............................................................................................................................19
REFERENCES..............................................................................................................................21
APPENDIX....................................................................................................................................24
INTRODUCTION
Financial analysis and management are the two main activities that are performed by the
organisation in order to monitor financial performance and status of the organisation. For all the
business entities it is vital to conduct both of them so that strategic decision for future and
betterment could be formed. It is vital for businesses to assess the factors which may affect its
performance so that ways to reduce their impact could be figured out (Adjei-Frimpong, Gan and
Hu, 2014). Main purpose of this report is to measure importance of financial analysis and
management for enterprises. The company which is selected for this report is Nestle Malaysia
Berhad which was founded in year 1912. Its headquarters are in Petaling Jaya, Malaysia versus
its competitor, Rex Malaysia Bhd. The ratios effective, when a comparison is made with a
similar company, within the same 5 year previous periods.
1
⊘ This is a preview!⊘
Do you want full access?
Subscribe today to unlock all pages.
Trusted by 1+ million students worldwide
SECTION 1
Background of company
Nestle Malaysia Berhad was founded in year 1912 and its headquarters are in Petaling Jaya,
Malaysia. It is a manufacturing company of food and beverage items and selling them within the
country and other nations. Various types of items are sold by the company which includes liquid
and powdered milk, juices, ice creams, junior food, instant coffee and noodles, yoghurt, culinary,
nutrition and health science products and dairy items (Background of Nestle Malaysia Berhad,
2018). There are various subsidiaries of the organisation that are Nestle Asean Sdn. Bhd., Nestle
Products Sdn. Bhd. And Nestle Manufacturing Sdn. Bhd. This company is the world's largest
food and beverage manufacturer and operating business in more than 190 countries. Main
purpose of the organisation is to enhance quality of life and contribute towards healthier future of
people. The enterprise is planning to share a better and healthy world. Nestle inspires individuals
to live healthy and happy life. Till year 2030 the enterprise is willing to achieve sustainable
development goals. It was started 150 year ago when Henri Nestle made a cereal which was
served to a sick child to save the life.
Various segment where it operates business in Malaysia. These are food and beverage and
others. Other includes Nestle professionals, health science and Nespresso. Current CEO of the
company is Juan Aranols (Growth of Nestle Malaysia Berhad, 2019). At the end of year 2018 its
revenues were increased by 2.95%, gross margin have a rise of 40.26% and overall cash flow
was increased by 16.22%.
The main competitor of Nestle is Rex Malaysia which was established in 1965 and incorporated
in year 1972 and concerned with the manufacturing activities of food and beverage items
(Background of Rex, 2019). Its headquarters are in Simpang Ampat, Malaysia. Different types of
drinks, canned and frozen foods are distributed by the company. It Subsidiary Rex Canning Co.
Sdn. Bhd. is engaged in export and manufacturing processes of canned food items. Rex Trading
Sdn. Bhd. Takes all the trading related activities of canned food in consideration. Summit
Teamtrade subsidiary of the organisation is concerned with the activities that are conducted to
manufacture biscuits (Chae and Oh, 2016). The business of Rex is operated by more than 900
2
Paraphrase This Document
Need a fresh take? Get an instant paraphrase of this document with our AI Paraphraser
employees. Year by year its profitability is being decreasing as compare to previous year which
affects it position in the market.
Position of the company in industry in respect to its competitors
Nestle Malaysia Berhad is the consistent performer and market leader in the food and beverage
industry of Malaysia and it has a good position in this sector. Domestic sales of the company has
been increased by 4.4% and exports have been raised by 3.4%. In year 2018 turnover of the
company was RM 3.6 Billion and 24% of this amount was generated from export. Nestle
contributes almost 7% in the nation's RM 7 Billion food exports.
Rex is a major part of food and beverage industry of Malaysia as it contributes a good amount in
the national income of the country. Its position is also stable in the economy as it a leading
company of supplying canned and frozen food items. Exports of the Rex is also very high
because in various countries its products are delivered. These are France, Germany, Japan, USA,
Netherland, Singapore and others (Chandra, 2017).
3
SECTION2
Five years comparative financial performance analysis with the help of ratios
Analysing financial performance of the company is very important because it can guide the
managers to make appropriate decisions for the company. Ratio analysis is the tool which can be
used for the same purpose so that the business can be operated in appropriate manner. There are
various types of ratios that are mainly used to determine financial viability of the business. These
are current, quick, debt equity, total asset turnover etc. results of all of them are used to form
strategic decisions for future period. It may also help the investors to take appropriate decision to
make investment in the company or buy share for attaining higher returns on their amount
(Dunham-Taylor and Pinczuk, 2014). The ratios effective, when a comparison is made with a
similar company, within the same previous periods.
Summary analysis of the companies regarding financial strength
Ratio analysis: It is a quick financial analysis tool which is used to analyse financial strength of
the companies, from its financial statements and balance sheets that will also help investors to
make appropriate decisions regarding investment in companies. There are various types of ratios
that helps to analyse financial viability of business entities.
4
⊘ This is a preview!⊘
Do you want full access?
Subscribe today to unlock all pages.
Trusted by 1+ million students worldwide
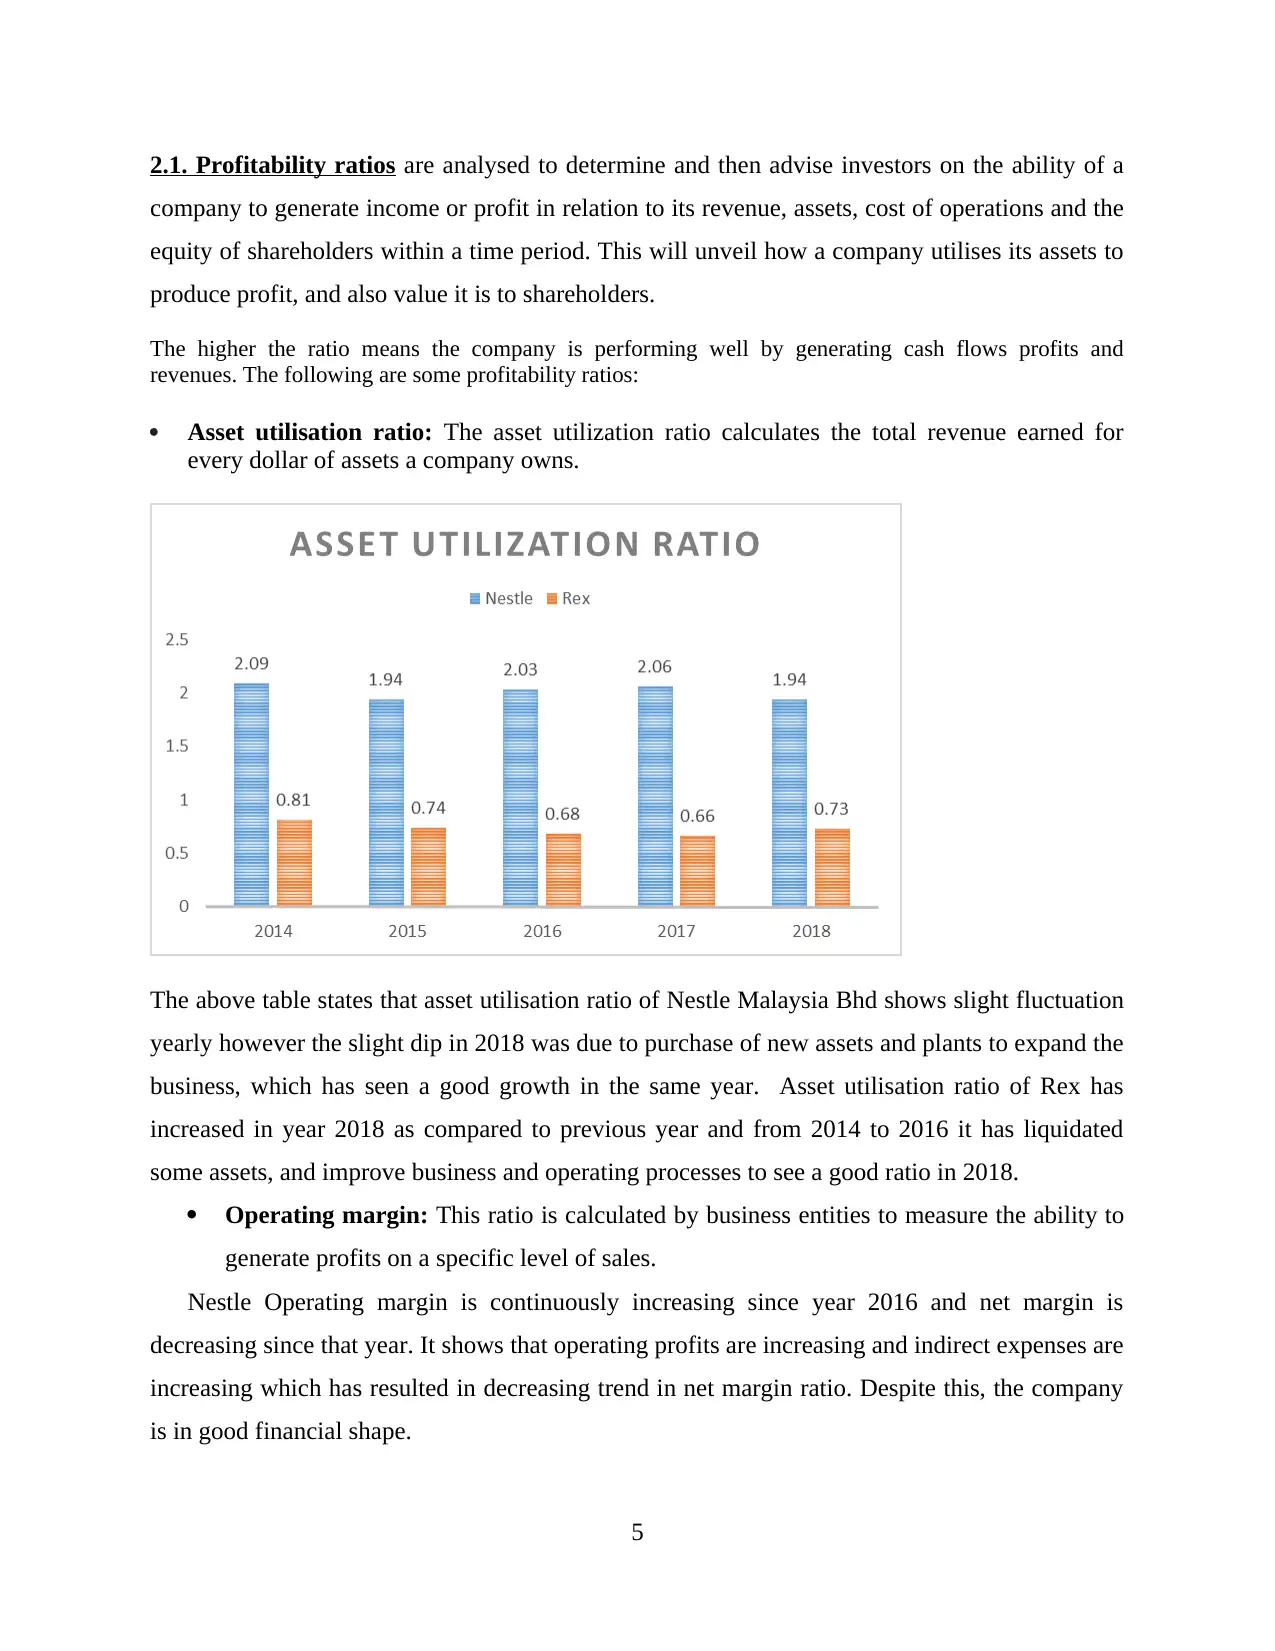
2.1. Profitability ratios are analysed to determine and then advise investors on the ability of a
company to generate income or profit in relation to its revenue, assets, cost of operations and the
equity of shareholders within a time period. This will unveil how a company utilises its assets to
produce profit, and also value it is to shareholders.
The higher the ratio means the company is performing well by generating cash flows profits and
revenues. The following are some profitability ratios:
Asset utilisation ratio: The asset utilization ratio calculates the total revenue earned for
every dollar of assets a company owns.
The above table states that asset utilisation ratio of Nestle Malaysia Bhd shows slight fluctuation
yearly however the slight dip in 2018 was due to purchase of new assets and plants to expand the
business, which has seen a good growth in the same year. Asset utilisation ratio of Rex has
increased in year 2018 as compared to previous year and from 2014 to 2016 it has liquidated
some assets, and improve business and operating processes to see a good ratio in 2018.
Operating margin: This ratio is calculated by business entities to measure the ability to
generate profits on a specific level of sales.
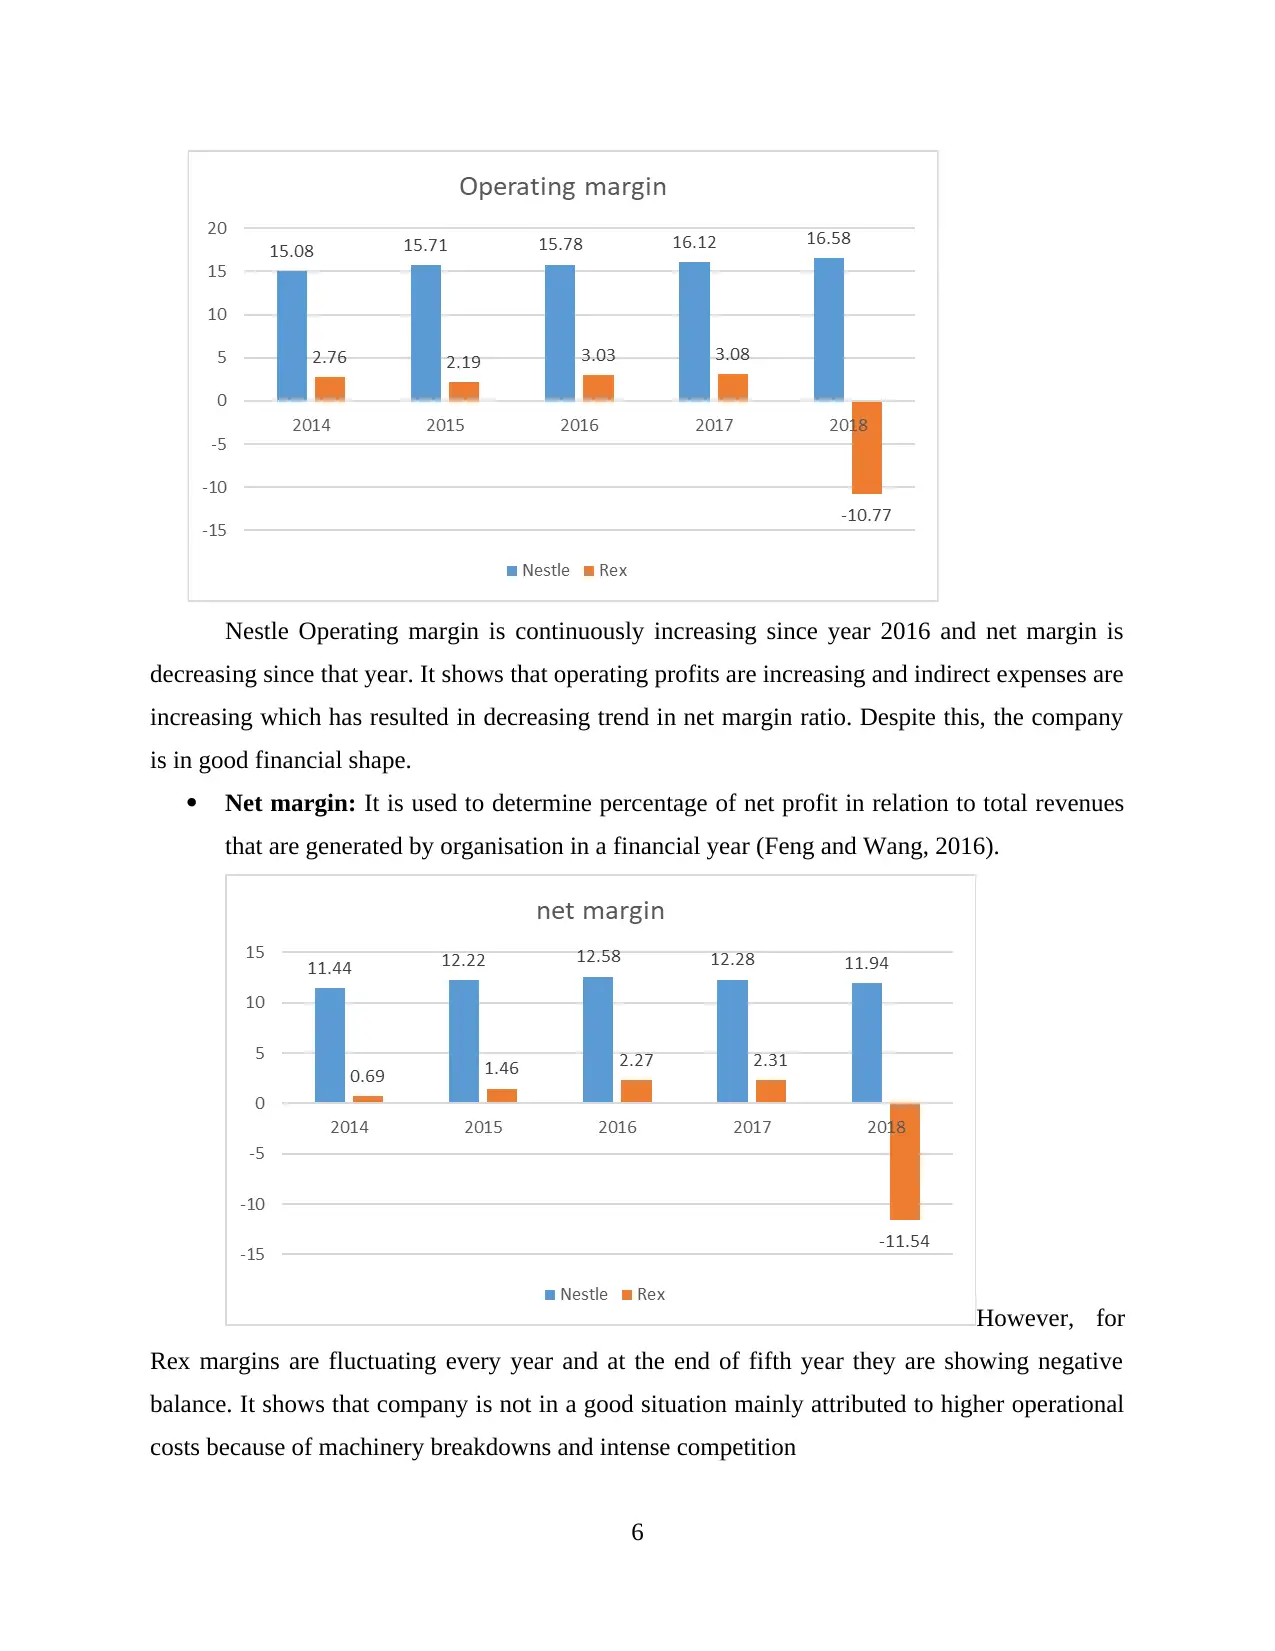
Nestle Operating margin is continuously increasing since year 2016 and net margin is
decreasing since that year. It shows that operating profits are increasing and indirect expenses are
increasing which has resulted in decreasing trend in net margin ratio. Despite this, the company
is in good financial shape.
5
company to generate income or profit in relation to its revenue, assets, cost of operations and the
equity of shareholders within a time period. This will unveil how a company utilises its assets to
produce profit, and also value it is to shareholders.
The higher the ratio means the company is performing well by generating cash flows profits and
revenues. The following are some profitability ratios:
Asset utilisation ratio: The asset utilization ratio calculates the total revenue earned for
every dollar of assets a company owns.
The above table states that asset utilisation ratio of Nestle Malaysia Bhd shows slight fluctuation
yearly however the slight dip in 2018 was due to purchase of new assets and plants to expand the
business, which has seen a good growth in the same year. Asset utilisation ratio of Rex has
increased in year 2018 as compared to previous year and from 2014 to 2016 it has liquidated
some assets, and improve business and operating processes to see a good ratio in 2018.
Operating margin: This ratio is calculated by business entities to measure the ability to
generate profits on a specific level of sales.
Nestle Operating margin is continuously increasing since year 2016 and net margin is
decreasing since that year. It shows that operating profits are increasing and indirect expenses are
increasing which has resulted in decreasing trend in net margin ratio. Despite this, the company
is in good financial shape.
5
Paraphrase This Document
Need a fresh take? Get an instant paraphrase of this document with our AI Paraphraser
Nestle Operating margin is continuously increasing since year 2016 and net margin is
decreasing since that year. It shows that operating profits are increasing and indirect expenses are
increasing which has resulted in decreasing trend in net margin ratio. Despite this, the company
is in good financial shape.
Net margin: It is used to determine percentage of net profit in relation to total revenues
that are generated by organisation in a financial year (Feng and Wang, 2016).
However, for
Rex margins are fluctuating every year and at the end of fifth year they are showing negative
balance. It shows that company is not in a good situation mainly attributed to higher operational
costs because of machinery breakdowns and intense competition
6
in the domestic market (Karadag, 2015).
The graphs show that margin ratios of both companies are fluctuating with Nestle
recording higher margins compared to Rex. The value is due to market dominance, hence Nestle
sits higher. However, due to high investment, and poor competitiveness in terms of new products
and in an effort to capitalise the market, they drop prices hence REX saw their profitability dip
downwards in 2018.
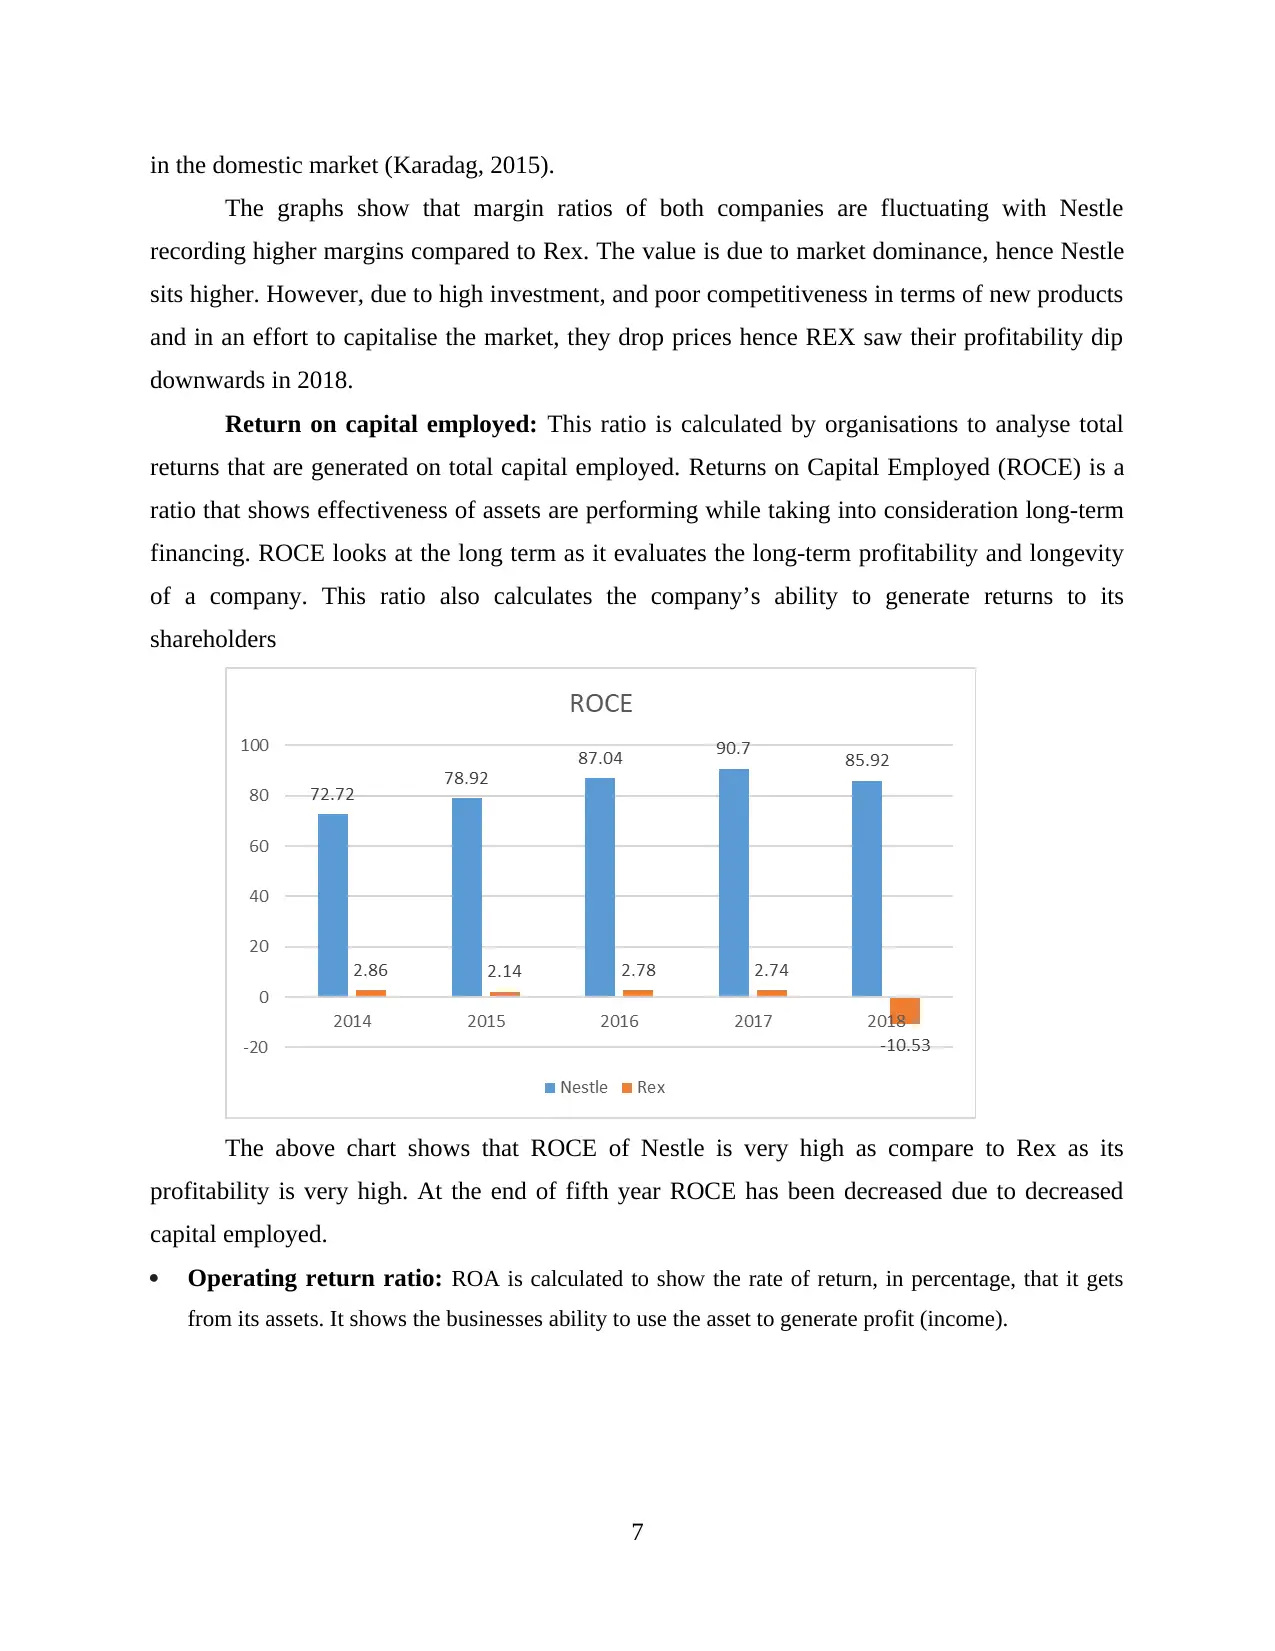
Return on capital employed: This ratio is calculated by organisations to analyse total
returns that are generated on total capital employed. Returns on Capital Employed (ROCE) is a
ratio that shows effectiveness of assets are performing while taking into consideration long-term
financing. ROCE looks at the long term as it evaluates the long-term profitability and longevity
of a company. This ratio also calculates the company’s ability to generate returns to its
shareholders
The above chart shows that ROCE of Nestle is very high as compare to Rex as its
profitability is very high. At the end of fifth year ROCE has been decreased due to decreased
capital employed.
Operating return ratio: ROA is calculated to show the rate of return, in percentage, that it gets
from its assets. It shows the businesses ability to use the asset to generate profit (income).
7
The graphs show that margin ratios of both companies are fluctuating with Nestle
recording higher margins compared to Rex. The value is due to market dominance, hence Nestle
sits higher. However, due to high investment, and poor competitiveness in terms of new products
and in an effort to capitalise the market, they drop prices hence REX saw their profitability dip
downwards in 2018.
Return on capital employed: This ratio is calculated by organisations to analyse total
returns that are generated on total capital employed. Returns on Capital Employed (ROCE) is a
ratio that shows effectiveness of assets are performing while taking into consideration long-term
financing. ROCE looks at the long term as it evaluates the long-term profitability and longevity
of a company. This ratio also calculates the company’s ability to generate returns to its
shareholders
The above chart shows that ROCE of Nestle is very high as compare to Rex as its
profitability is very high. At the end of fifth year ROCE has been decreased due to decreased
capital employed.
Operating return ratio: ROA is calculated to show the rate of return, in percentage, that it gets
from its assets. It shows the businesses ability to use the asset to generate profit (income).
7
⊘ This is a preview!⊘
Do you want full access?
Subscribe today to unlock all pages.
Trusted by 1+ million students worldwide
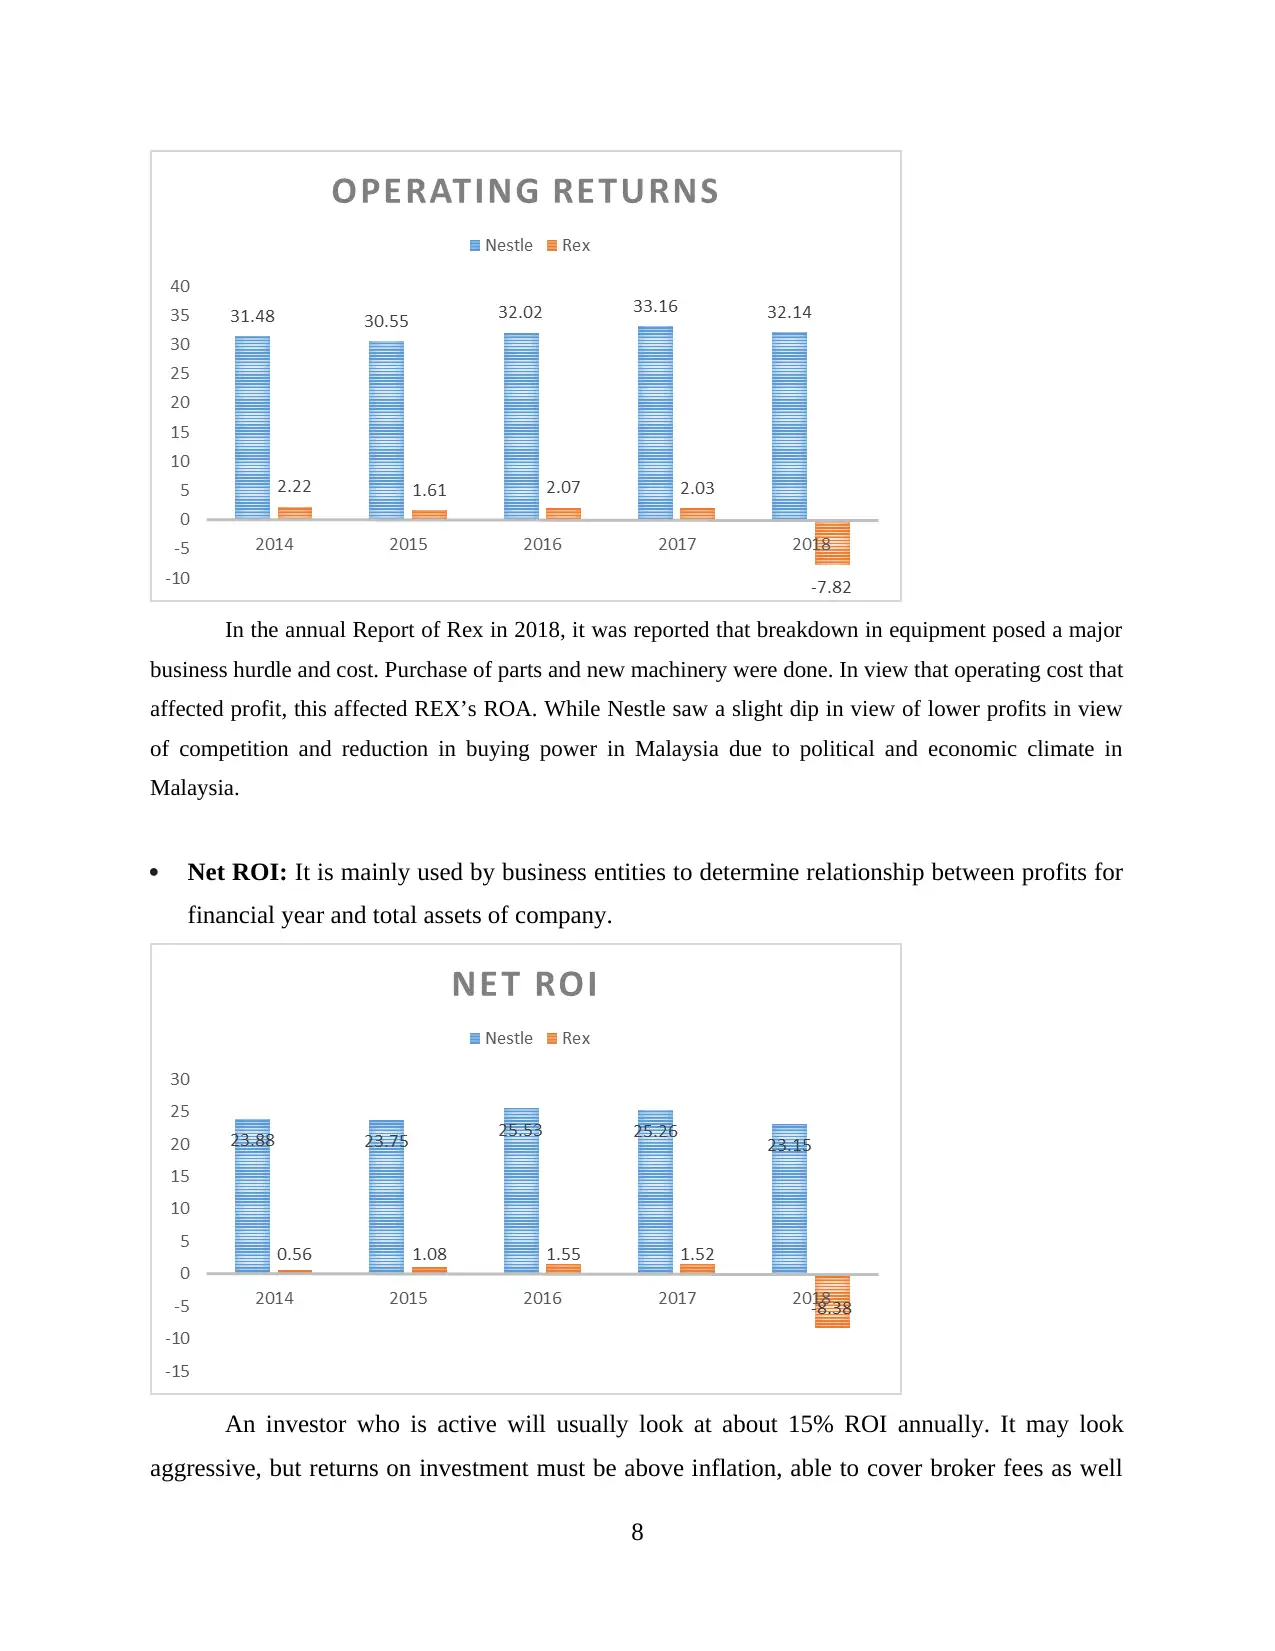
In the annual Report of Rex in 2018, it was reported that breakdown in equipment posed a major
business hurdle and cost. Purchase of parts and new machinery were done. In view that operating cost that
affected profit, this affected REX’s ROA. While Nestle saw a slight dip in view of lower profits in view
of competition and reduction in buying power in Malaysia due to political and economic climate in
Malaysia.
Net ROI: It is mainly used by business entities to determine relationship between profits for
financial year and total assets of company.
An investor who is active will usually look at about 15% ROI annually. It may look
aggressive, but returns on investment must be above inflation, able to cover broker fees as well
8
Paraphrase This Document
Need a fresh take? Get an instant paraphrase of this document with our AI Paraphraser
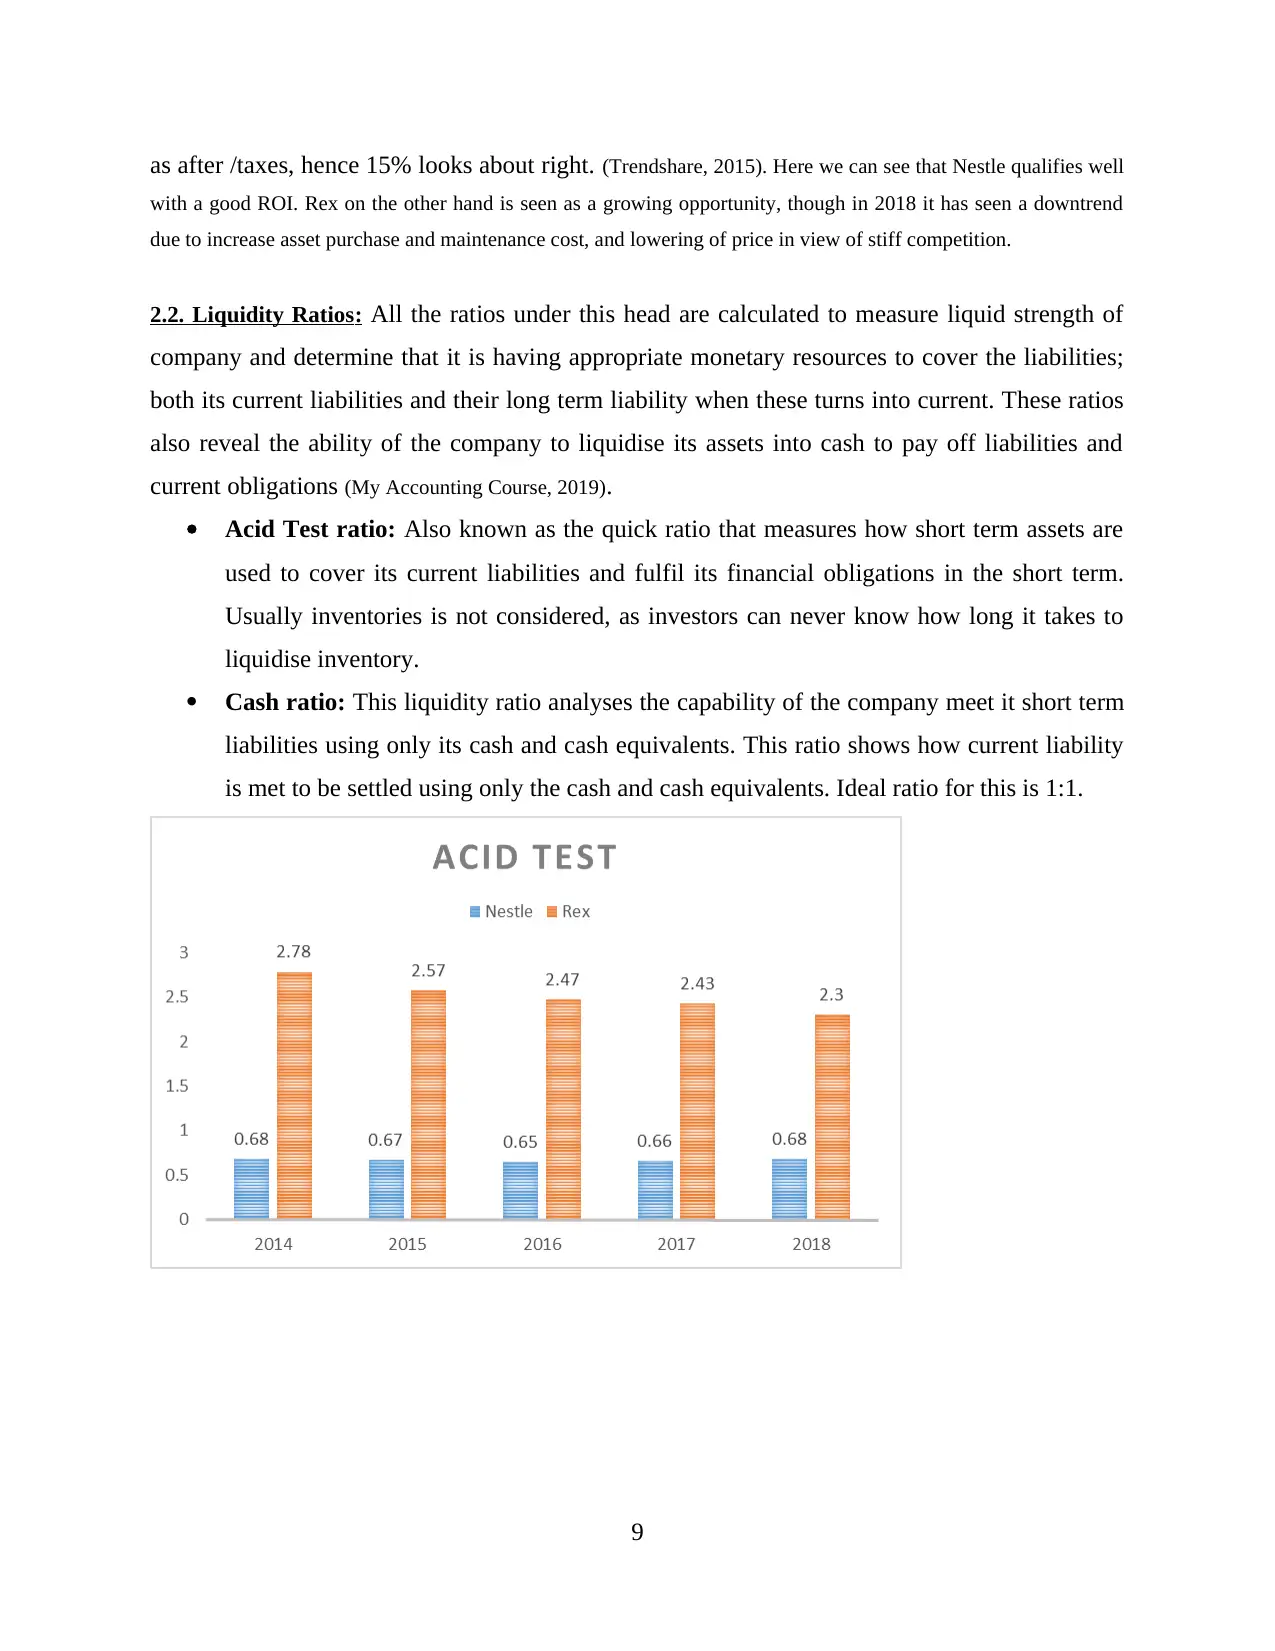
as after /taxes, hence 15% looks about right. (Trendshare, 2015). Here we can see that Nestle qualifies well
with a good ROI. Rex on the other hand is seen as a growing opportunity, though in 2018 it has seen a downtrend
due to increase asset purchase and maintenance cost, and lowering of price in view of stiff competition.
2.2. Liquidity Ratios: All the ratios under this head are calculated to measure liquid strength of
company and determine that it is having appropriate monetary resources to cover the liabilities;
both its current liabilities and their long term liability when these turns into current. These ratios
also reveal the ability of the company to liquidise its assets into cash to pay off liabilities and
current obligations (My Accounting Course, 2019).
Acid Test ratio: Also known as the quick ratio that measures how short term assets are
used to cover its current liabilities and fulfil its financial obligations in the short term.
Usually inventories is not considered, as investors can never know how long it takes to
liquidise inventory.
Cash ratio: This liquidity ratio analyses the capability of the company meet it short term
liabilities using only its cash and cash equivalents. This ratio shows how current liability
is met to be settled using only the cash and cash equivalents. Ideal ratio for this is 1:1.
9
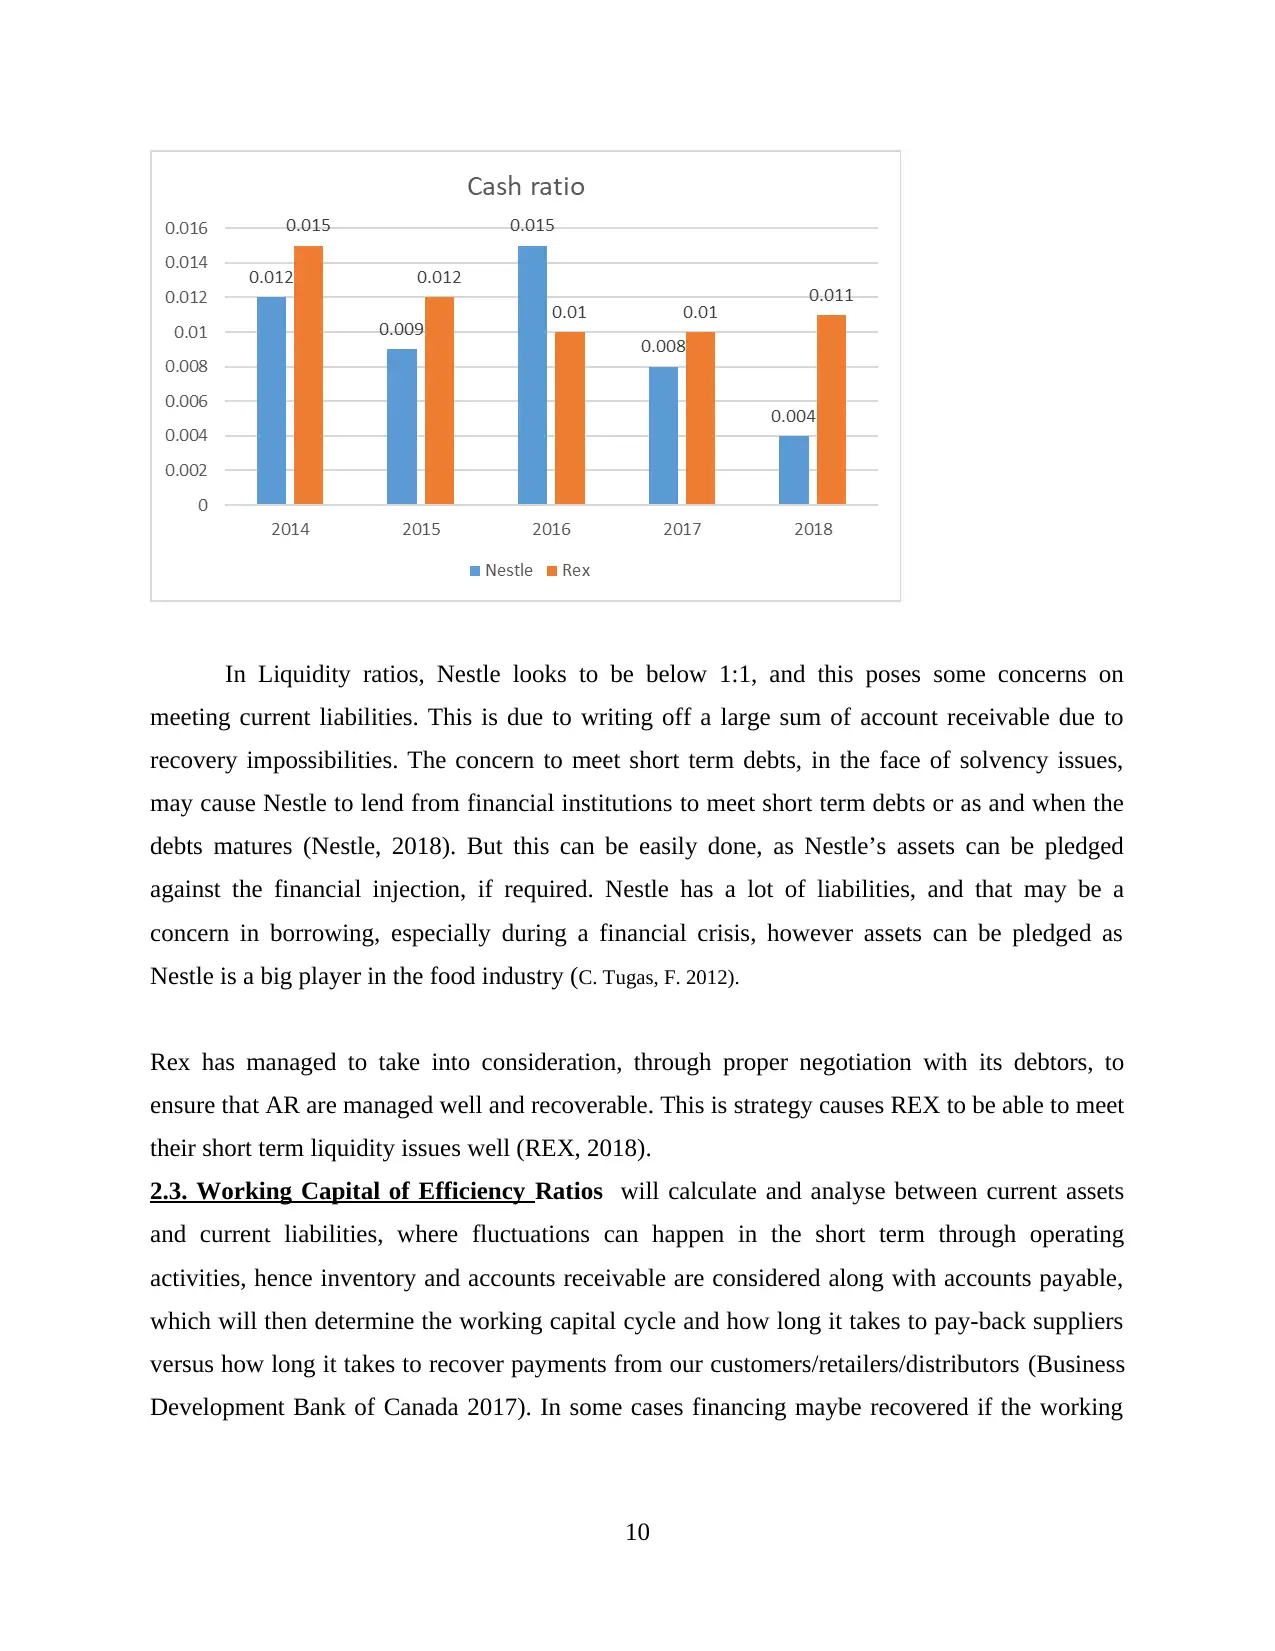
In Liquidity ratios, Nestle looks to be below 1:1, and this poses some concerns on
meeting current liabilities. This is due to writing off a large sum of account receivable due to
recovery impossibilities. The concern to meet short term debts, in the face of solvency issues,
may cause Nestle to lend from financial institutions to meet short term debts or as and when the
debts matures (Nestle, 2018). But this can be easily done, as Nestle’s assets can be pledged
against the financial injection, if required. Nestle has a lot of liabilities, and that may be a
concern in borrowing, especially during a financial crisis, however assets can be pledged as
Nestle is a big player in the food industry (C. Tugas, F. 2012).
Rex has managed to take into consideration, through proper negotiation with its debtors, to
ensure that AR are managed well and recoverable. This is strategy causes REX to be able to meet
their short term liquidity issues well (REX, 2018).
2.3. Working Capital of Efficiency Ratios will calculate and analyse between current assets
and current liabilities, where fluctuations can happen in the short term through operating
activities, hence inventory and accounts receivable are considered along with accounts payable,
which will then determine the working capital cycle and how long it takes to pay-back suppliers
versus how long it takes to recover payments from our customers/retailers/distributors (Business
Development Bank of Canada 2017). In some cases financing maybe recovered if the working
10
⊘ This is a preview!⊘
Do you want full access?
Subscribe today to unlock all pages.
Trusted by 1+ million students worldwide
1 out of 33
Related Documents


Your All-in-One AI-Powered Toolkit for Academic Success.
+13062052269
info@desklib.com
Available 24*7 on WhatsApp / Email
![[object Object]](/_next/static/media/star-bottom.7253800d.svg)
Unlock your academic potential
Copyright © 2020–2025 A2Z Services. All Rights Reserved. Developed and managed by ZUCOL.