Financial Analysis Assignment: Accounting Concepts and Practices
VerifiedAdded on 2022/11/22
|5
|440
|54
Homework Assignment
AI Summary
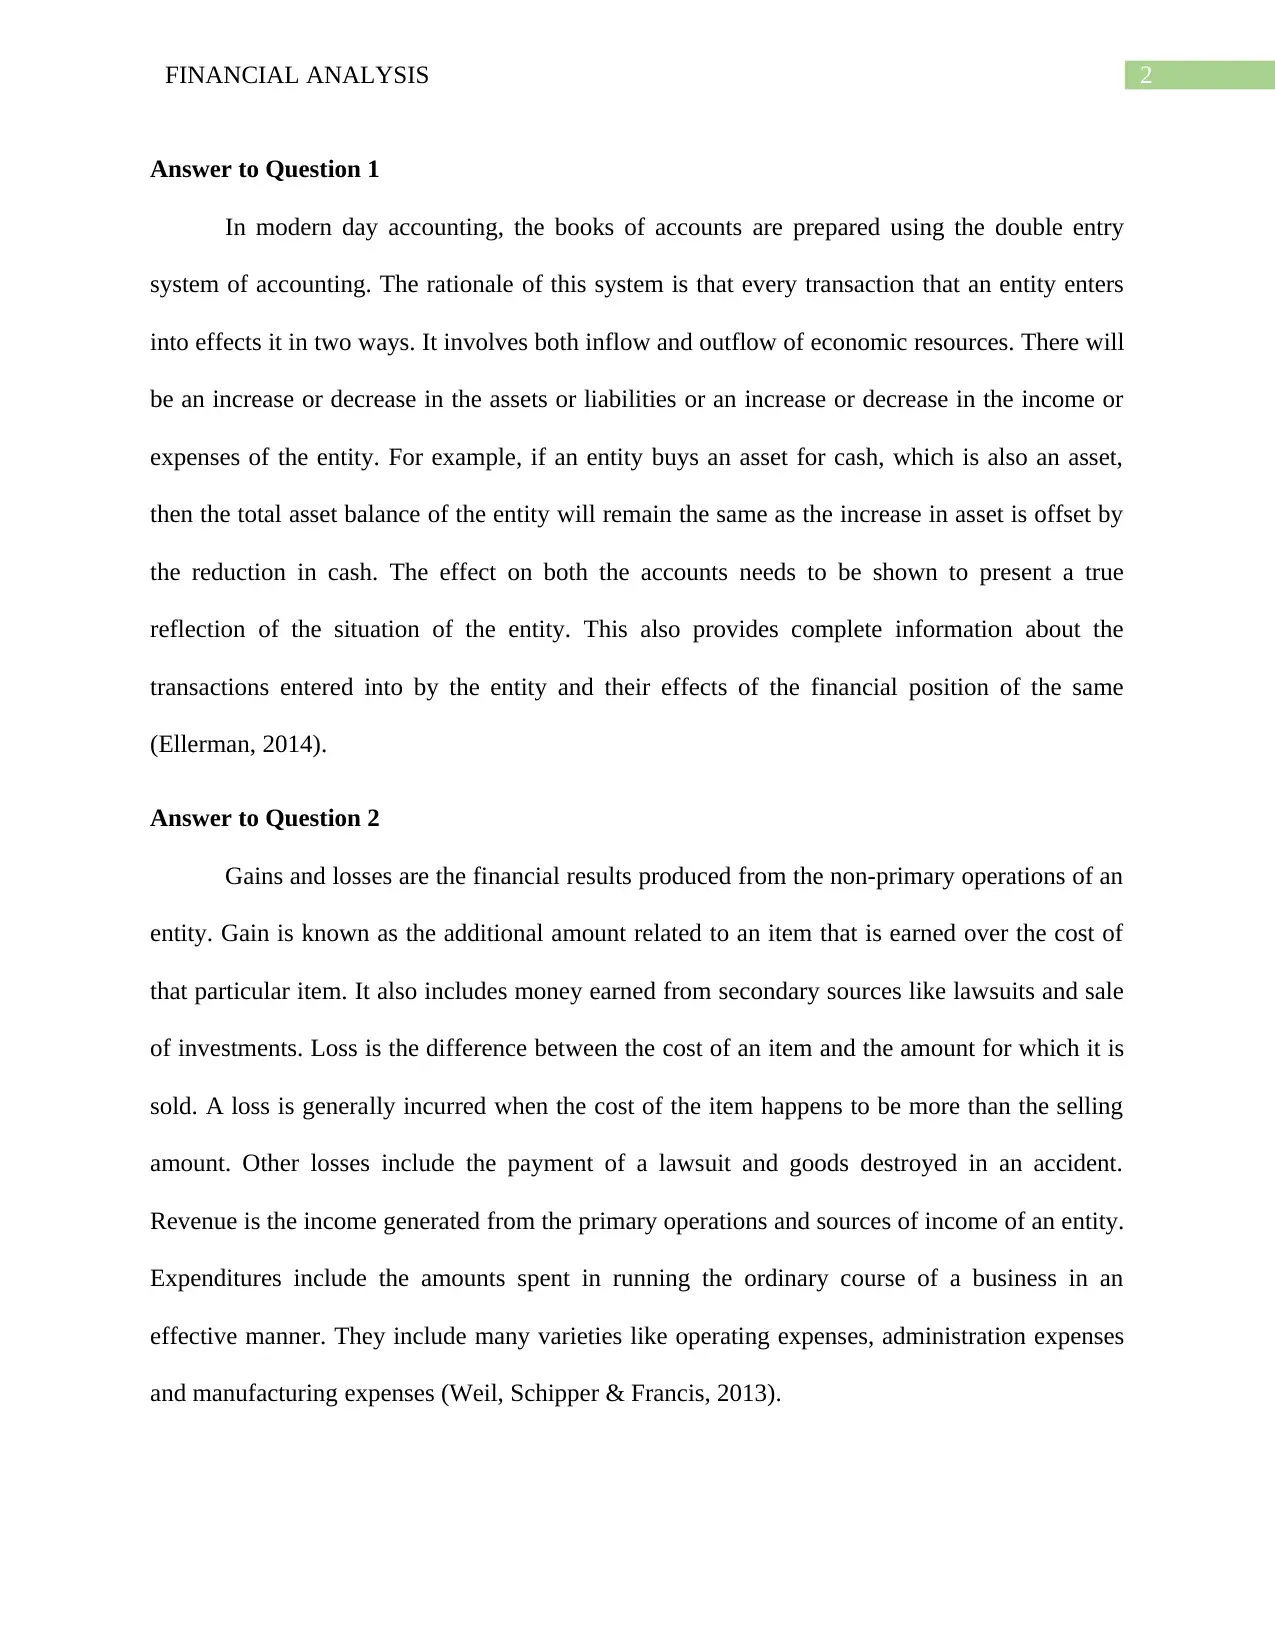
This document presents a solution to a financial analysis assignment, focusing on key accounting principles. The assignment explores the double-entry system of accounting, explaining its rationale and impact on financial statements. It further differentiates between gains, losses, and revenue, providing definitions and examples to illustrate their significance in financial reporting. The solution also includes a discussion on the relationship between costs, revenues, and expenses in the context of business operations. This assignment offers a comprehensive understanding of fundamental accounting concepts and their practical application in analyzing financial data. The document provides a clear explanation of the concepts, making it a valuable resource for students studying financial analysis and accounting.

1 out of 5
Related Documents


Your All-in-One AI-Powered Toolkit for Academic Success.
+13062052269
info@desklib.com
Available 24*7 on WhatsApp / Email
![[object Object]](/_next/static/media/star-bottom.7253800d.svg)
Copyright © 2020–2026 A2Z Services. All Rights Reserved. Developed and managed by ZUCOL.