Financial Analysis of BHP Billiton and Caltex Limited
VerifiedAdded on 2023/06/05
|19
|4346
|376
AI Summary
This report presents a financial analysis of BHP Billiton and Caltex Limited, including their comparative advantages, performance ratios, capital structure ratios, and liquidity ratios. The report also includes share price movements and factors affecting the share price, as well as a recommendation letter for investment. The analysis is based on the financial statements of the past three years.
Contribute Materials
Your contribution can guide someone’s learning journey. Share your
documents today.

Running Head: FINANCE 0
Finance
Finance
Secure Best Marks with AI Grader
Need help grading? Try our AI Grader for instant feedback on your assignments.
FINANCE FOR MASTERS 1
Table of Contents
Introduction................................................................................................................................2
Operation and comparative advantages.....................................................................................2
BHP Billiton...........................................................................................................................2
Caltex Limited........................................................................................................................3
Calculation of the performance ratios........................................................................................3
Profitability ratios...................................................................................................................3
Net profit margin....................................................................................................................5
Return on Assets.....................................................................................................................5
Return on Equity.....................................................................................................................6
Capital structure (leverage) ratios..........................................................................................6
Debt to Equity Ratio...............................................................................................................7
Interest Coverage Ratio..........................................................................................................8
Liquidity ratios.......................................................................................................................8
Current Ratio..........................................................................................................................9
Quick ratio..............................................................................................................................9
Share prices movements...........................................................................................................10
BHP Billiton.........................................................................................................................10
Caltex limited.......................................................................................................................11
Factors affecting the share price..............................................................................................12
BHP Billiton.........................................................................................................................12

FINANCE FOR MASTERS 2
Caltex Limited......................................................................................................................12
Beta values...............................................................................................................................13
Dividend policies.....................................................................................................................13
Recommendation letter............................................................................................................14
Conclusion................................................................................................................................15
References................................................................................................................................16
FINANCE FOR MASTERS 3
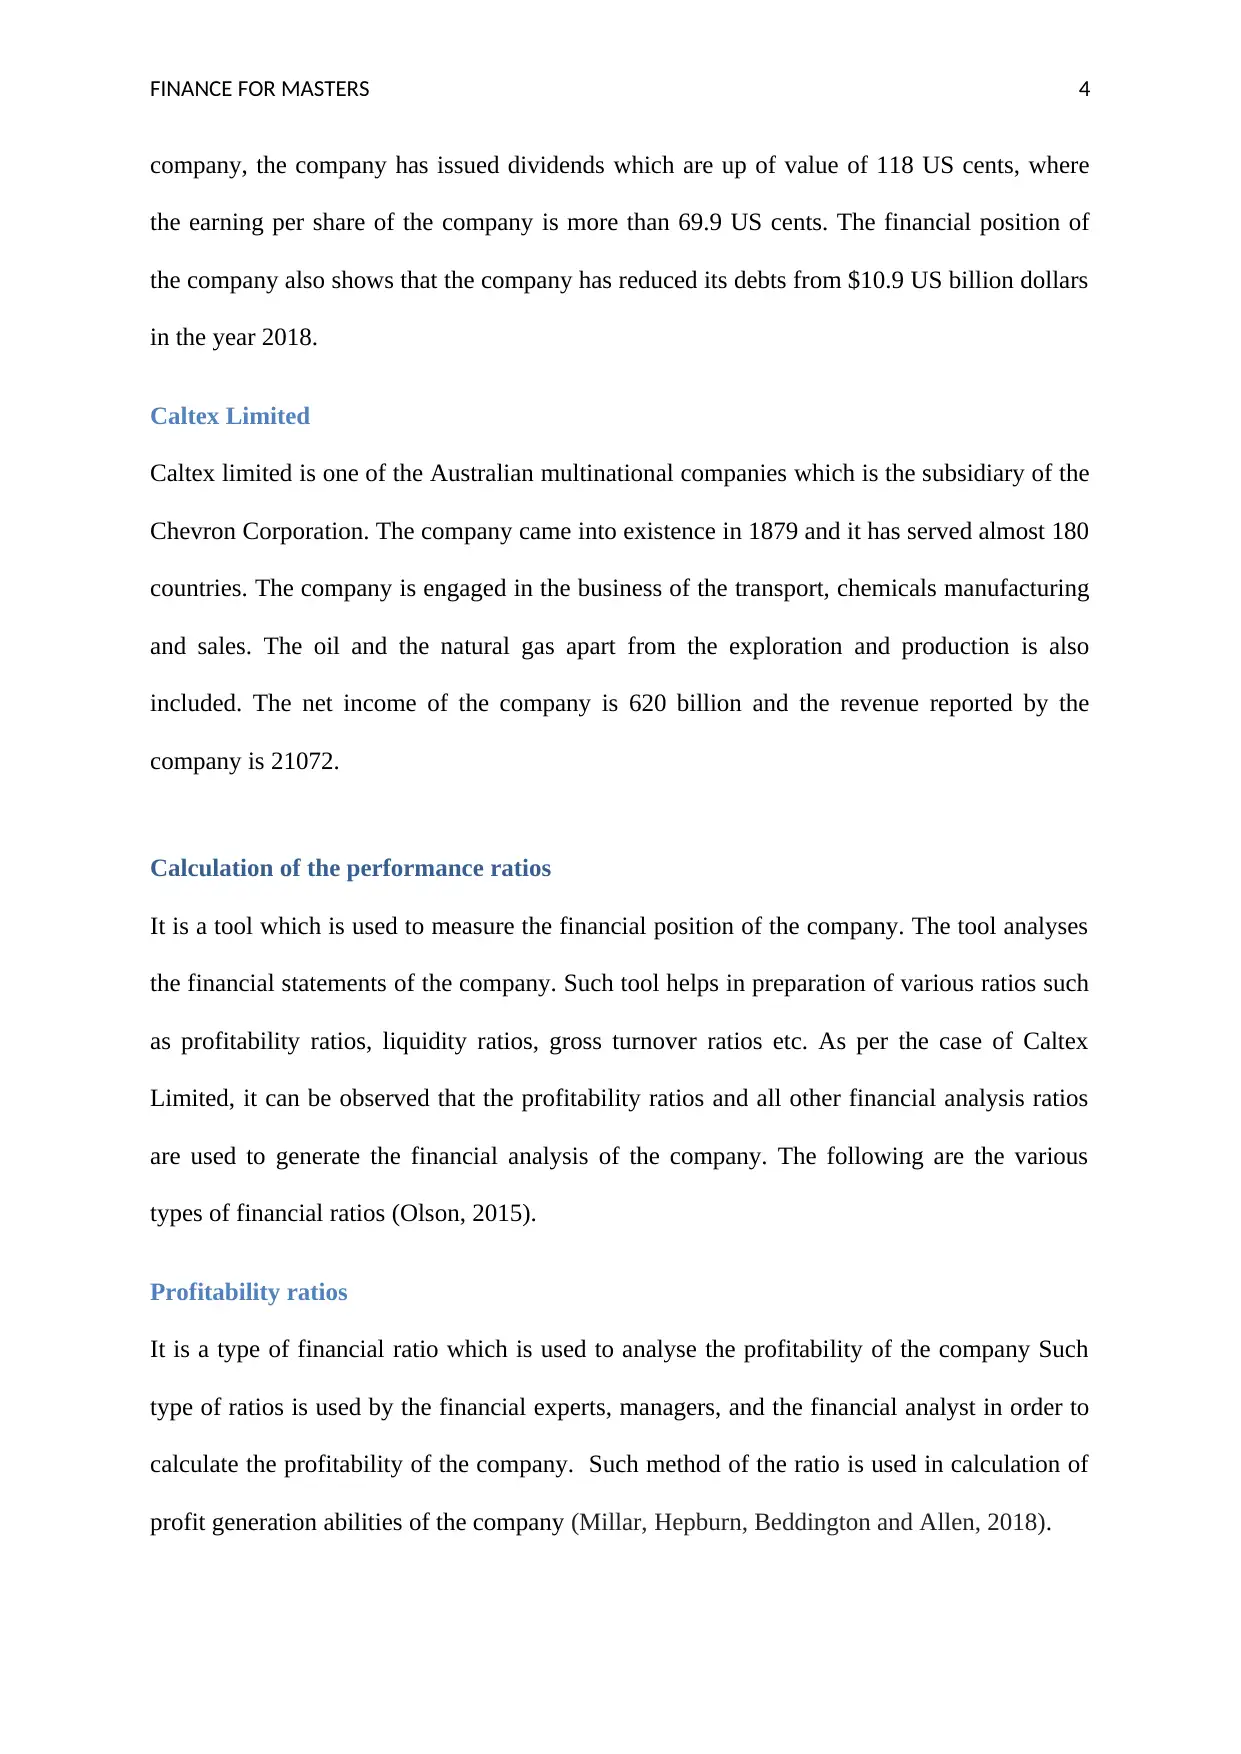
Introduction
There are the certain requirements which are to be followed by the management in order to
report the financial statements in front of the investors and the shareholders. The analysis of
the financial statements is beneficial if it is compared either in the form of year to year
comparison or in the form of comparison with the other company operating in the same
industry. In order to take the decision of the investment this report presents a proper analysis
of the ratios of the past three years, the market performance, the price movements have been
disclosed and the dividend policy have been recorded equally. The two companies that are
chosen for this purpose are the BHP Billiton and the Caltex limited (Vogel, 2014).
Operation and comparative advantages
BHP Billiton
An Australian Multinational Company named BHP Billion which is registered under
Corporation Act 2001, which is called as an Anglo-Australian multinational corporation
where the basic role of the company is to acquire the natural resources. The headquarters of
the company is situated in Melbourne which deals in mining and in petroleum products of the
company. The company was founded in the year 1885, where the BHP Billion became the
largest mining company in the world on the basis of its market capitalisation. The company is
listed in the Australian stock exchange, London Stock Exchange as per the name mentioned
by the company such as BHP. The basic function of the company is to deal in the ore,
mining, smelting and refining nickel. The company has been involving in over 650
corporations which functions in the mining and development of natural resources of more
than 100 countries in the world. Moreover, the company has a wide and different range of
asserts which helps in mining and smelting of nickel. As per the financial report of the
Secure Best Marks with AI Grader
Need help grading? Try our AI Grader for instant feedback on your assignments.
FINANCE FOR MASTERS 4
company, the company has issued dividends which are up of value of 118 US cents, where
the earning per share of the company is more than 69.9 US cents. The financial position of
the company also shows that the company has reduced its debts from $10.9 US billion dollars
in the year 2018.
Caltex Limited
Caltex limited is one of the Australian multinational companies which is the subsidiary of the
Chevron Corporation. The company came into existence in 1879 and it has served almost 180
countries. The company is engaged in the business of the transport, chemicals manufacturing
and sales. The oil and the natural gas apart from the exploration and production is also
included. The net income of the company is 620 billion and the revenue reported by the
company is 21072.
Calculation of the performance ratios
It is a tool which is used to measure the financial position of the company. The tool analyses
the financial statements of the company. Such tool helps in preparation of various ratios such
as profitability ratios, liquidity ratios, gross turnover ratios etc. As per the case of Caltex
Limited, it can be observed that the profitability ratios and all other financial analysis ratios
are used to generate the financial analysis of the company. The following are the various
types of financial ratios (Olson, 2015).
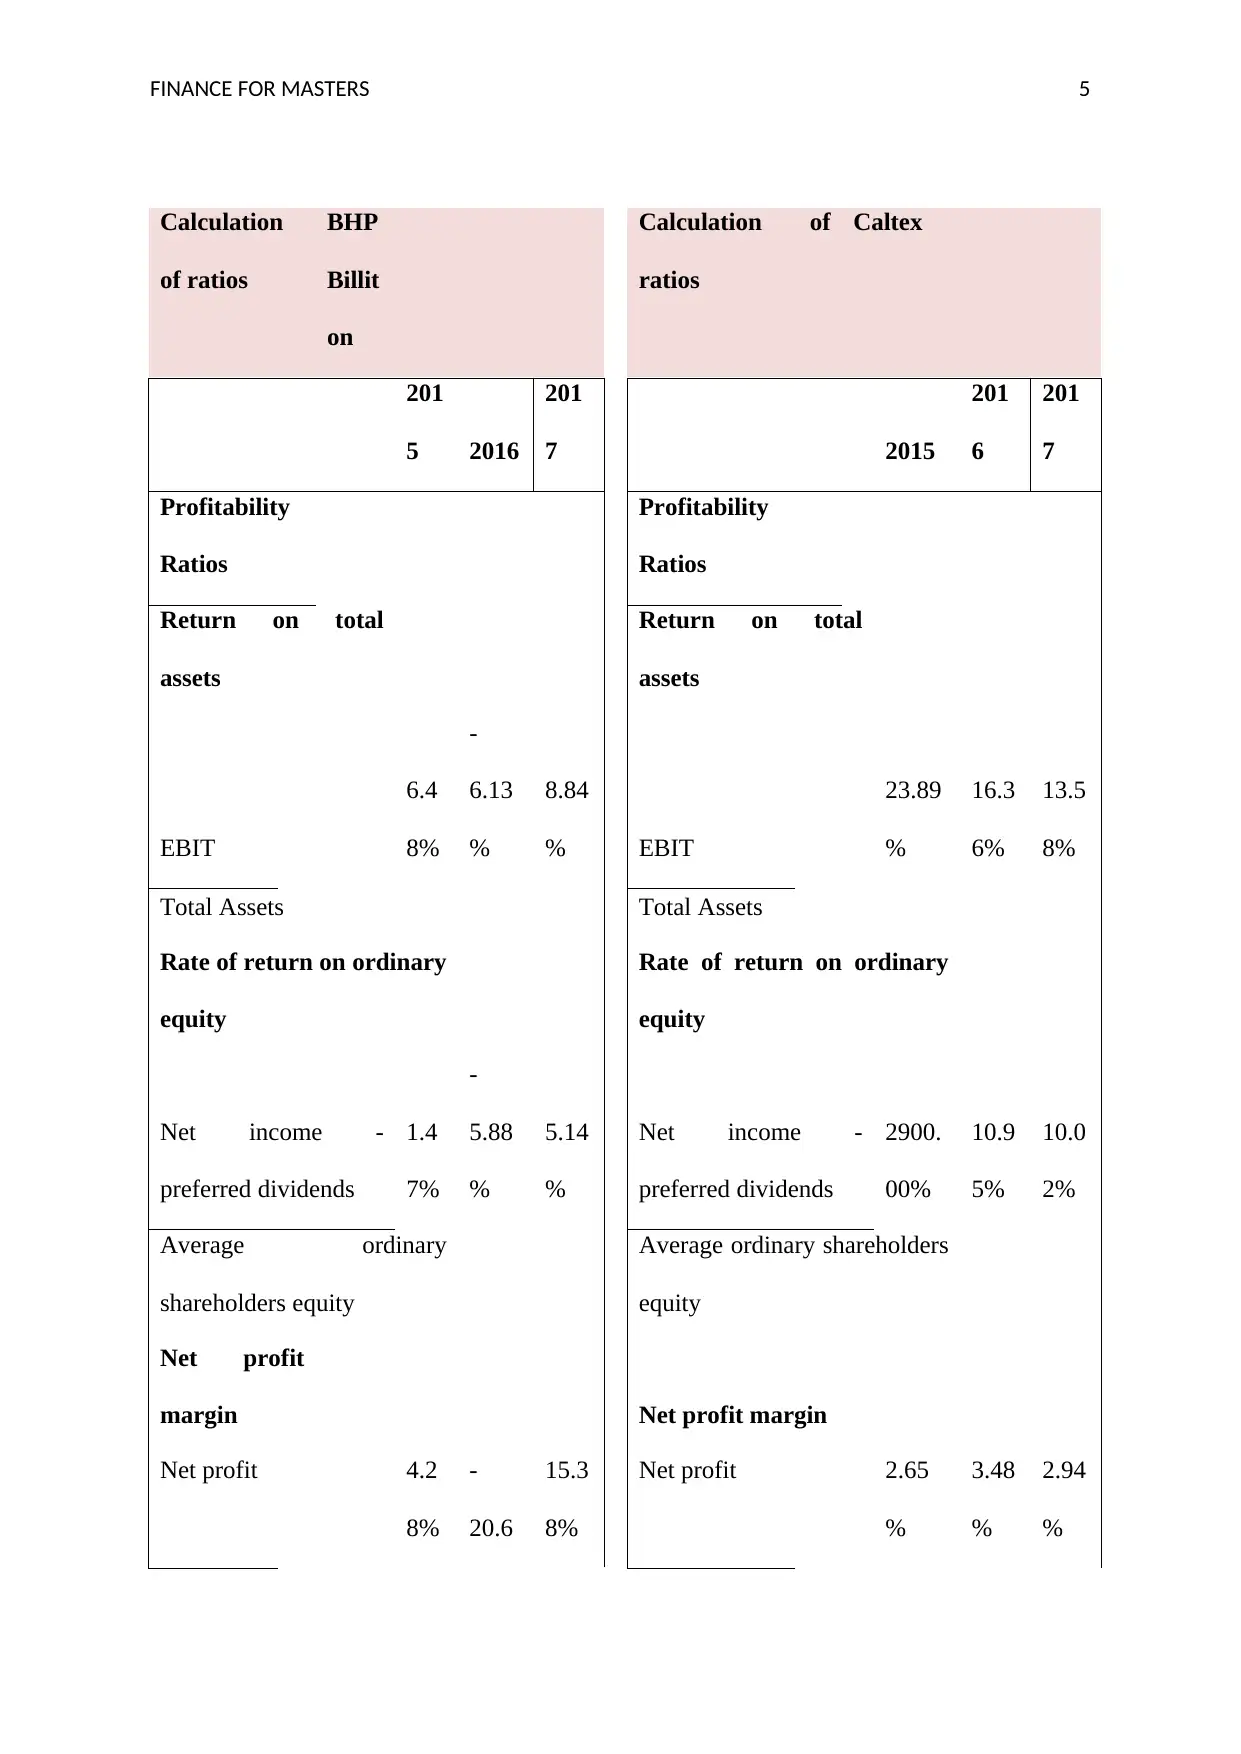
Profitability ratios
It is a type of financial ratio which is used to analyse the profitability of the company Such
type of ratios is used by the financial experts, managers, and the financial analyst in order to
calculate the profitability of the company. Such method of the ratio is used in calculation of
profit generation abilities of the company (Millar, Hepburn, Beddington and Allen, 2018).
company, the company has issued dividends which are up of value of 118 US cents, where
the earning per share of the company is more than 69.9 US cents. The financial position of
the company also shows that the company has reduced its debts from $10.9 US billion dollars
in the year 2018.
Caltex Limited
Caltex limited is one of the Australian multinational companies which is the subsidiary of the
Chevron Corporation. The company came into existence in 1879 and it has served almost 180
countries. The company is engaged in the business of the transport, chemicals manufacturing
and sales. The oil and the natural gas apart from the exploration and production is also
included. The net income of the company is 620 billion and the revenue reported by the
company is 21072.
Calculation of the performance ratios
It is a tool which is used to measure the financial position of the company. The tool analyses
the financial statements of the company. Such tool helps in preparation of various ratios such
as profitability ratios, liquidity ratios, gross turnover ratios etc. As per the case of Caltex
Limited, it can be observed that the profitability ratios and all other financial analysis ratios
are used to generate the financial analysis of the company. The following are the various
types of financial ratios (Olson, 2015).
Profitability ratios
It is a type of financial ratio which is used to analyse the profitability of the company Such
type of ratios is used by the financial experts, managers, and the financial analyst in order to
calculate the profitability of the company. Such method of the ratio is used in calculation of
profit generation abilities of the company (Millar, Hepburn, Beddington and Allen, 2018).
FINANCE FOR MASTERS 5
Calculation
of ratios
BHP
Billit
on
Calculation of
ratios
Caltex
201
5 2016
201
7 2015
201
6
201
7
Profitability
Ratios
Profitability
Ratios
Return on total
assets
Return on total
assets
EBIT
6.4
8%
-
6.13
%
8.84
% EBIT
23.89
%
16.3
6%
13.5
8%
Total Assets Total Assets
Rate of return on ordinary
equity
Rate of return on ordinary
equity
Net income -
preferred dividends
1.4
7%
-
5.88
%
5.14
%
Net income -
preferred dividends
2900.
00%
10.9
5%
10.0
2%
Average ordinary
shareholders equity
Average ordinary shareholders
equity
Net profit
margin Net profit margin
Net profit 4.2
8%
-
20.6
15.3
8%
Net profit 2.65
%
3.48
%
2.94
%
FINANCE FOR MASTERS 6
6%
Sales Sales
Net profit margin
From the above table it can be analysed that the profitability ratios of the BHP Billiton and
the Caltex Limited is recorded. The net profit margin of the BHP is 15.38% which is higher
in comparison to the Caltex Limited which is 2.94% only in the year 2017. The BHP Billiton
revenue decreased and along with that the cost of goods sold also decreased and in case of the
Caltex Company the revenue is 17619 in the year 2016 and the cost of goods sold is 31880
which created the loss 14261. The company is not able to earn the enough revenue to set off
the expenses of the year. Therefore form the above results it can be included that the client
shall invest the funds in the BHP Billiton in comparison to the Caltex Limited (Lee and Eom,
2016).
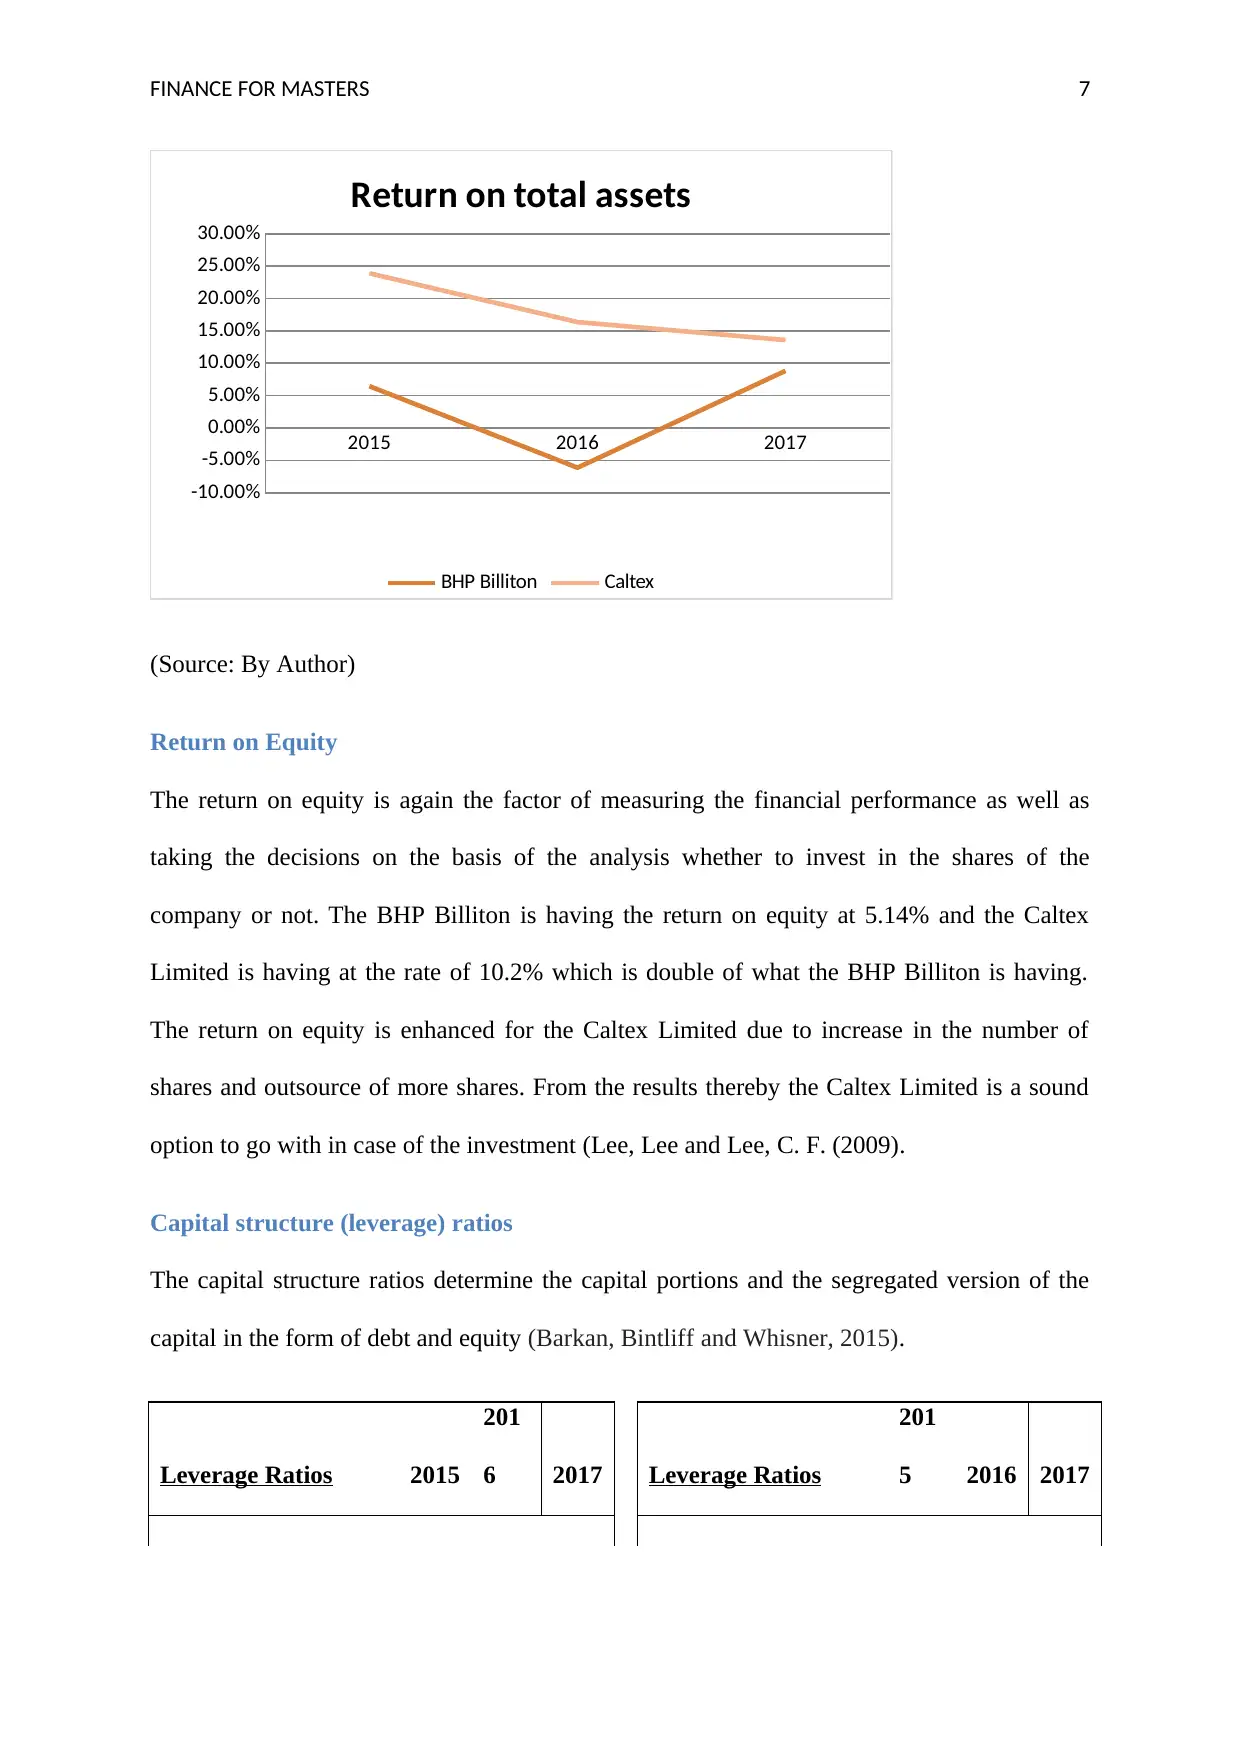
Return on Assets
The return on assets of the company is basically the idea of determining the financial
performance of the company in respect to the assets purchased for generating the revenue and
getting the return for the efforts undertaken. The above table reflects that the return on
Equity of the BHP Billiton and the Caltex Limited are 8.84% and 13.58% respectively. Under
this scenario the situation changed altogether as the return on assets is higher in terms of the
ratios of the Caltex Company in comparison to the BHP Billiton. The company is utilising the
assets efficiently as well as effectively. Henceforth on the basis of the return on the assets the
client shall proceed for the Caltex Limited. This ultimately boosts the performance of the
company (Sari, Nurlaela and Titisari, 2018).
6%
Sales Sales
Net profit margin
From the above table it can be analysed that the profitability ratios of the BHP Billiton and
the Caltex Limited is recorded. The net profit margin of the BHP is 15.38% which is higher
in comparison to the Caltex Limited which is 2.94% only in the year 2017. The BHP Billiton
revenue decreased and along with that the cost of goods sold also decreased and in case of the
Caltex Company the revenue is 17619 in the year 2016 and the cost of goods sold is 31880
which created the loss 14261. The company is not able to earn the enough revenue to set off
the expenses of the year. Therefore form the above results it can be included that the client
shall invest the funds in the BHP Billiton in comparison to the Caltex Limited (Lee and Eom,
2016).
Return on Assets
The return on assets of the company is basically the idea of determining the financial
performance of the company in respect to the assets purchased for generating the revenue and
getting the return for the efforts undertaken. The above table reflects that the return on
Equity of the BHP Billiton and the Caltex Limited are 8.84% and 13.58% respectively. Under
this scenario the situation changed altogether as the return on assets is higher in terms of the
ratios of the Caltex Company in comparison to the BHP Billiton. The company is utilising the
assets efficiently as well as effectively. Henceforth on the basis of the return on the assets the
client shall proceed for the Caltex Limited. This ultimately boosts the performance of the
company (Sari, Nurlaela and Titisari, 2018).
Paraphrase This Document
Need a fresh take? Get an instant paraphrase of this document with our AI Paraphraser
FINANCE FOR MASTERS 7
2015 2016 2017
-10.00%
-5.00%
0.00%
5.00%
10.00%
15.00%
20.00%
25.00%
30.00%
Return on total assets
BHP Billiton Caltex
(Source: By Author)
Return on Equity
The return on equity is again the factor of measuring the financial performance as well as
taking the decisions on the basis of the analysis whether to invest in the shares of the
company or not. The BHP Billiton is having the return on equity at 5.14% and the Caltex
Limited is having at the rate of 10.2% which is double of what the BHP Billiton is having.
The return on equity is enhanced for the Caltex Limited due to increase in the number of
shares and outsource of more shares. From the results thereby the Caltex Limited is a sound
option to go with in case of the investment (Lee, Lee and Lee, C. F. (2009).
Capital structure (leverage) ratios
The capital structure ratios determine the capital portions and the segregated version of the
capital in the form of debt and equity (Barkan, Bintliff and Whisner, 2015).
Leverage Ratios 2015
201
6 2017 Leverage Ratios
201
5 2016 2017
FINANCE FOR MASTERS 8
Interest coverage
ratio
Interest coverage
ratio
EBIT
19.2
7
-
8.56
10.1
4 EBIT 9.02
10.9
6
12.3
3
Interest Expense Interest Expense
Debt to Equity
ratio
Debt to Equity
ratio
Debt 0.43 0.58 0.50 Debt 0.00 0.13 0.14
Equity Equity
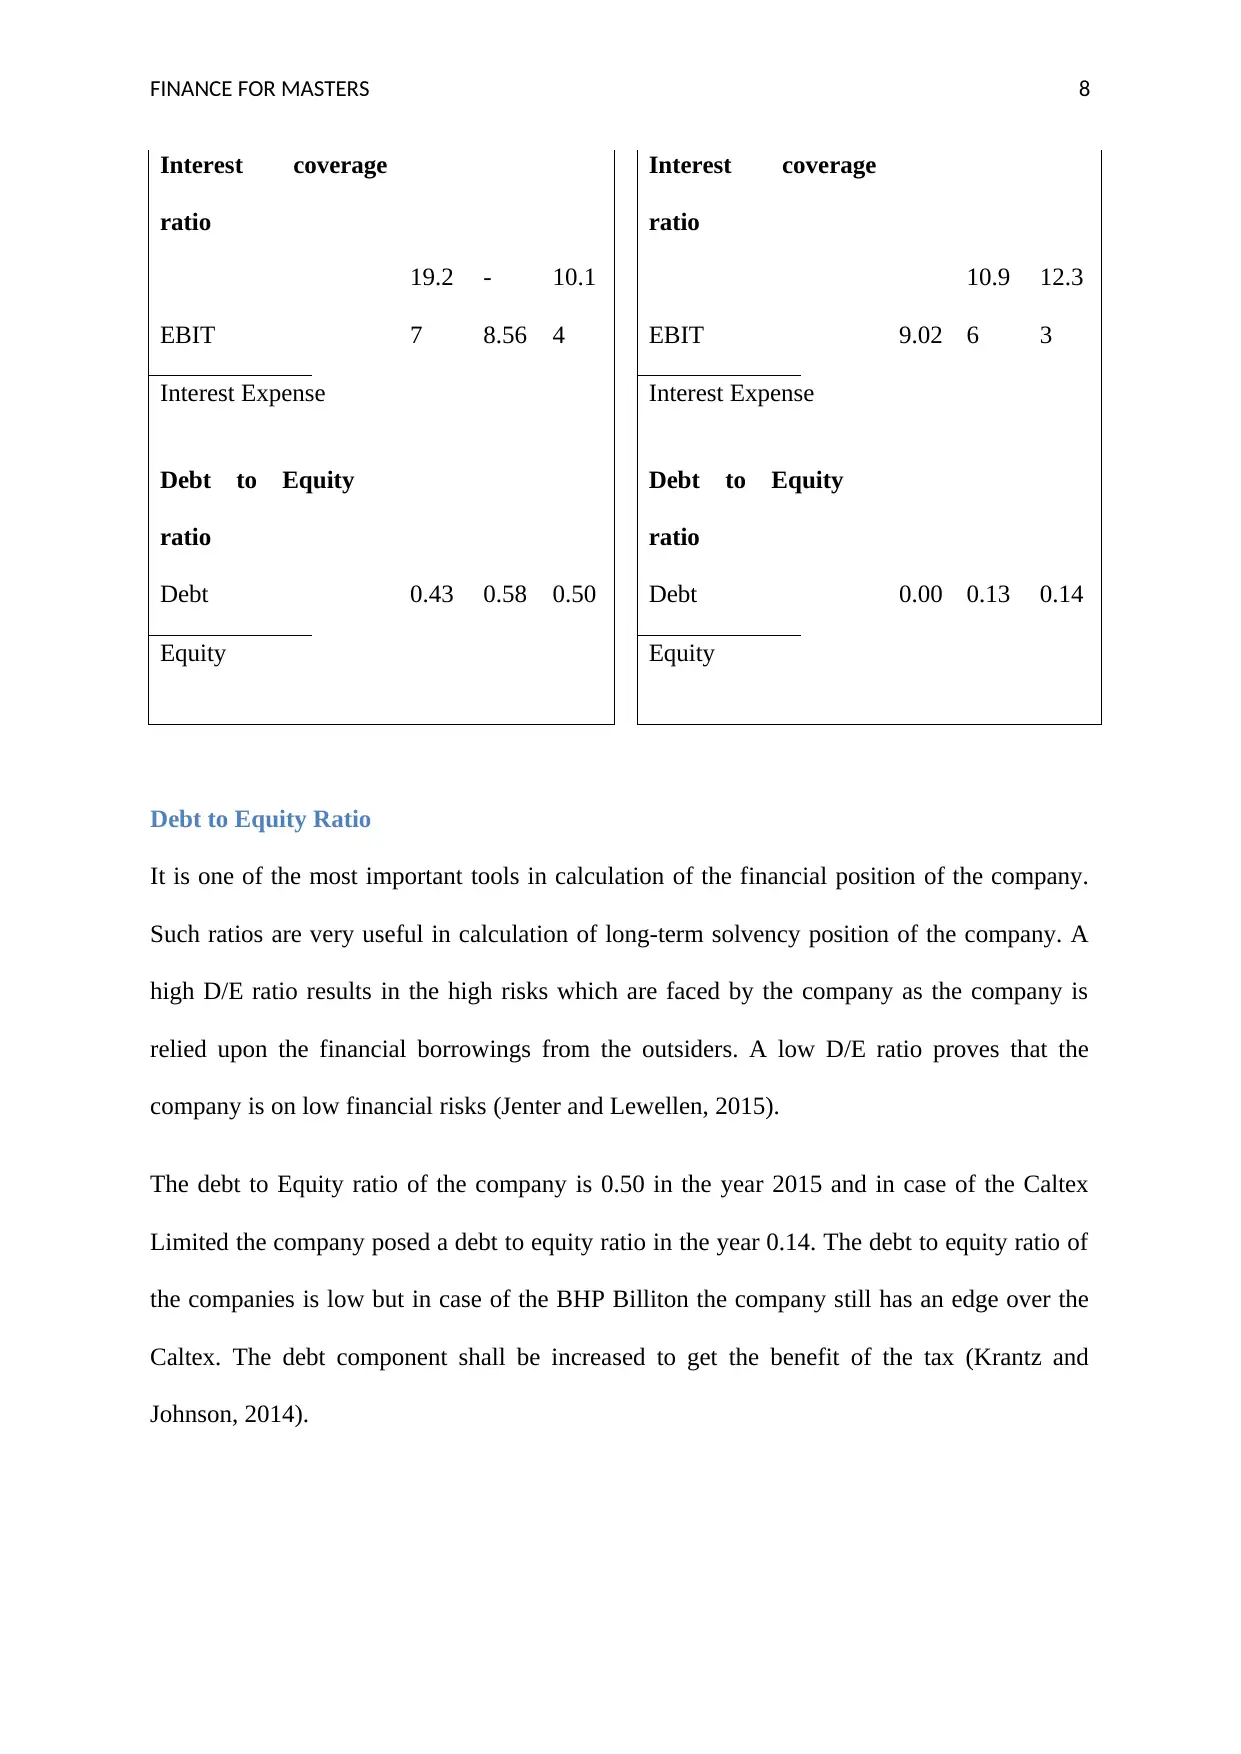
Debt to Equity Ratio
It is one of the most important tools in calculation of the financial position of the company.
Such ratios are very useful in calculation of long-term solvency position of the company. A
high D/E ratio results in the high risks which are faced by the company as the company is
relied upon the financial borrowings from the outsiders. A low D/E ratio proves that the
company is on low financial risks (Jenter and Lewellen, 2015).
The debt to Equity ratio of the company is 0.50 in the year 2015 and in case of the Caltex
Limited the company posed a debt to equity ratio in the year 0.14. The debt to equity ratio of
the companies is low but in case of the BHP Billiton the company still has an edge over the
Caltex. The debt component shall be increased to get the benefit of the tax (Krantz and
Johnson, 2014).
Interest coverage
ratio
Interest coverage
ratio
EBIT
19.2
7
-
8.56
10.1
4 EBIT 9.02
10.9
6
12.3
3
Interest Expense Interest Expense
Debt to Equity
ratio
Debt to Equity
ratio
Debt 0.43 0.58 0.50 Debt 0.00 0.13 0.14
Equity Equity
Debt to Equity Ratio
It is one of the most important tools in calculation of the financial position of the company.
Such ratios are very useful in calculation of long-term solvency position of the company. A
high D/E ratio results in the high risks which are faced by the company as the company is
relied upon the financial borrowings from the outsiders. A low D/E ratio proves that the
company is on low financial risks (Jenter and Lewellen, 2015).
The debt to Equity ratio of the company is 0.50 in the year 2015 and in case of the Caltex
Limited the company posed a debt to equity ratio in the year 0.14. The debt to equity ratio of
the companies is low but in case of the BHP Billiton the company still has an edge over the
Caltex. The debt component shall be increased to get the benefit of the tax (Krantz and
Johnson, 2014).
FINANCE FOR MASTERS 9
Interest Coverage Ratio
It is a type of the ratio which shows the interest paying capabilities of the company. Such
ratios are very useful in calculation of interest paying capability of the company. A high
interest coverage ratio is useful for the company where such ratio is useful to take various
financial decisions of the company whether the company is capable enough to pay the interest
rates of the loan which is applied by the company (Vogel, 2014).
Interest coverage ratio of the Caltex Company is better as it determines how well the
company is able to pay the interest expense on its outstanding debt. The Caltex company
reported the interest coverage ratio at 12.33 for the financial year 2017 and it has increased
form 10.96 in the previous year and 9.02 in the year 2015, whereas the BHP showed a
negative ratio in the year 2016 at -8.56 and it increased to 10.14 in the year 2017.
Liquidity ratios
Liquidity Ratios
201
5 2016 2017 Liquidity Ratios 2015
201
6 2017
Current Ratio Current Ratio
Current assets 1.27 1.39 1.84 Current assets 1.65 1.42 1.16
Current
Liabilities Current Liabilities
Quick Ratio Quick Ratio
Quick assets 0.86 1.09 1.49 Quick assets 0.74 0.60 0.33
Current
Liabilities Current Liabilities
Secure Best Marks with AI Grader
Need help grading? Try our AI Grader for instant feedback on your assignments.
FINANCE FOR MASTERS 10
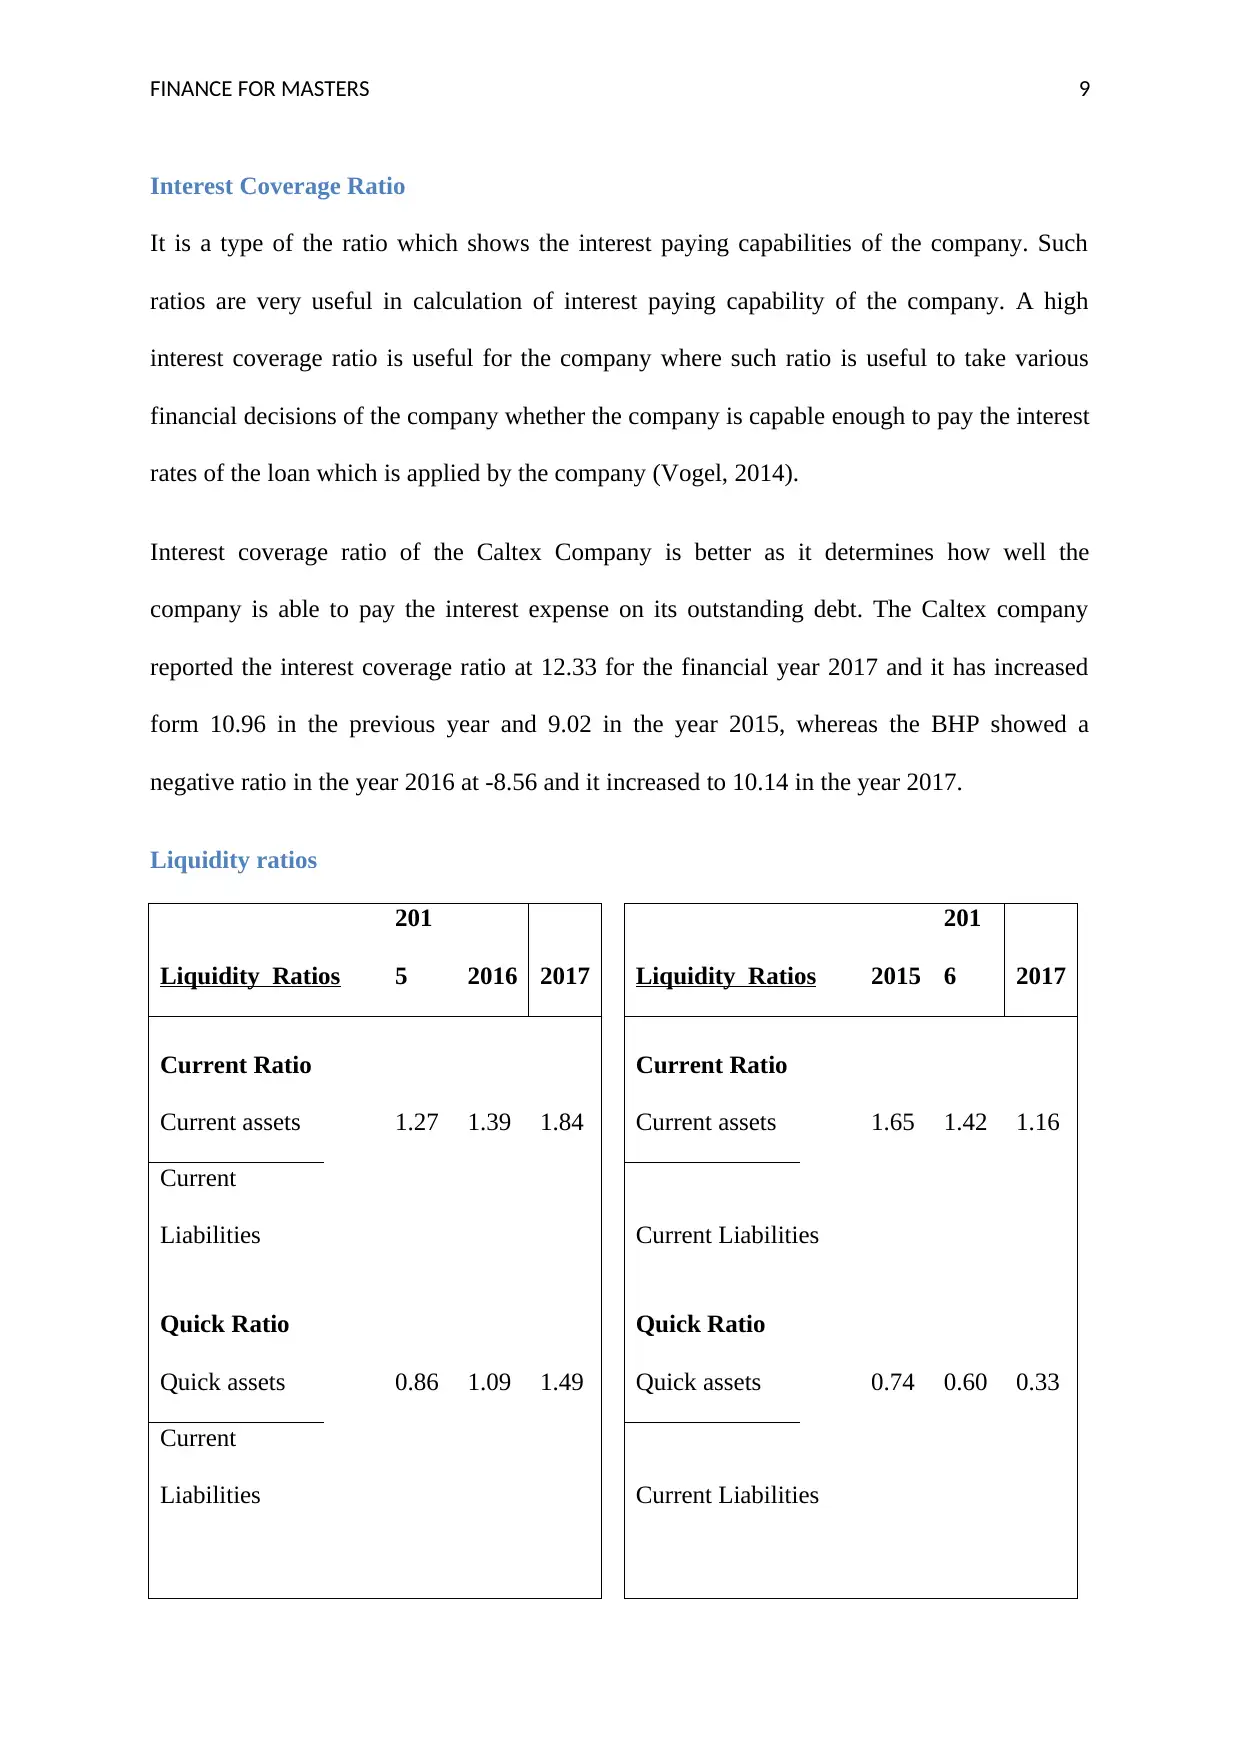
Current Ratio
It is a type of ratio which is used in calculating the liquidity of the company. Under this type
of ratio analysis, the current asserts of the company are compared with the current liabilities
of the company. Such type of ratio analysis helps in finding out the liquidity position which is
availed by the company which can be used for the payment of creditors of the company
(Jenter and Lewellen, 2015).
The current ratio of the company us 1.84 in the year 2017 and has increased from 1.34 in the
year 2016. In case of the Caltex Limited the current ratio is 1.16 which is lower than the
current ratio of the BHP Billiton and henceforth, the client shall definitely go for the BHP
Billiton option as it would convert the assets into liquid form more easily.
Quick ratio
Under this type of ratio, a quick analysis of the company can be done whether the current
liabilities of the company can be paid through the quick funds of the company. Quick funds
are the funds which could compensate the payment of current liabilities. Such payment of
quick liabilities could be done through a quick payment of cash to the creditors of the
company (Jenter and Lewellen, 2015).
The Quick ratio of the company is 1.49 in case of the BHP Billiton and the 0.33 in case of the
Caltex. The liquidity position of the CALTEX is low and therefore the company needs to
improve the ratio. The assets are not utilised properly and ratio is low. Therefore it can be
interpreted from the results that it is better to invest in the BHP Billiton rather than Caltex
Limited (Gitman, Juchau and Flanagan, 2015).
FINANCE FOR MASTERS 11
Share prices movements
BHP Billiton
9/1/2015
11/1/2015
1/1/2016
3/1/2016
5/1/2016
7/1/2016
9/1/2016
11/1/2016
1/1/2017
3/1/2017
5/1/2017
7/1/2017
9/1/2017
11/1/2017
1/1/2018
3/1/2018
5/1/2018
7/1/2018
9/1/2018
-30%
-20%
-10%
0%
10%
20%
30%
Price Moving Calculations
S&P 200 Average return (BHP)
(Source: Yahoo Finance. 2018).
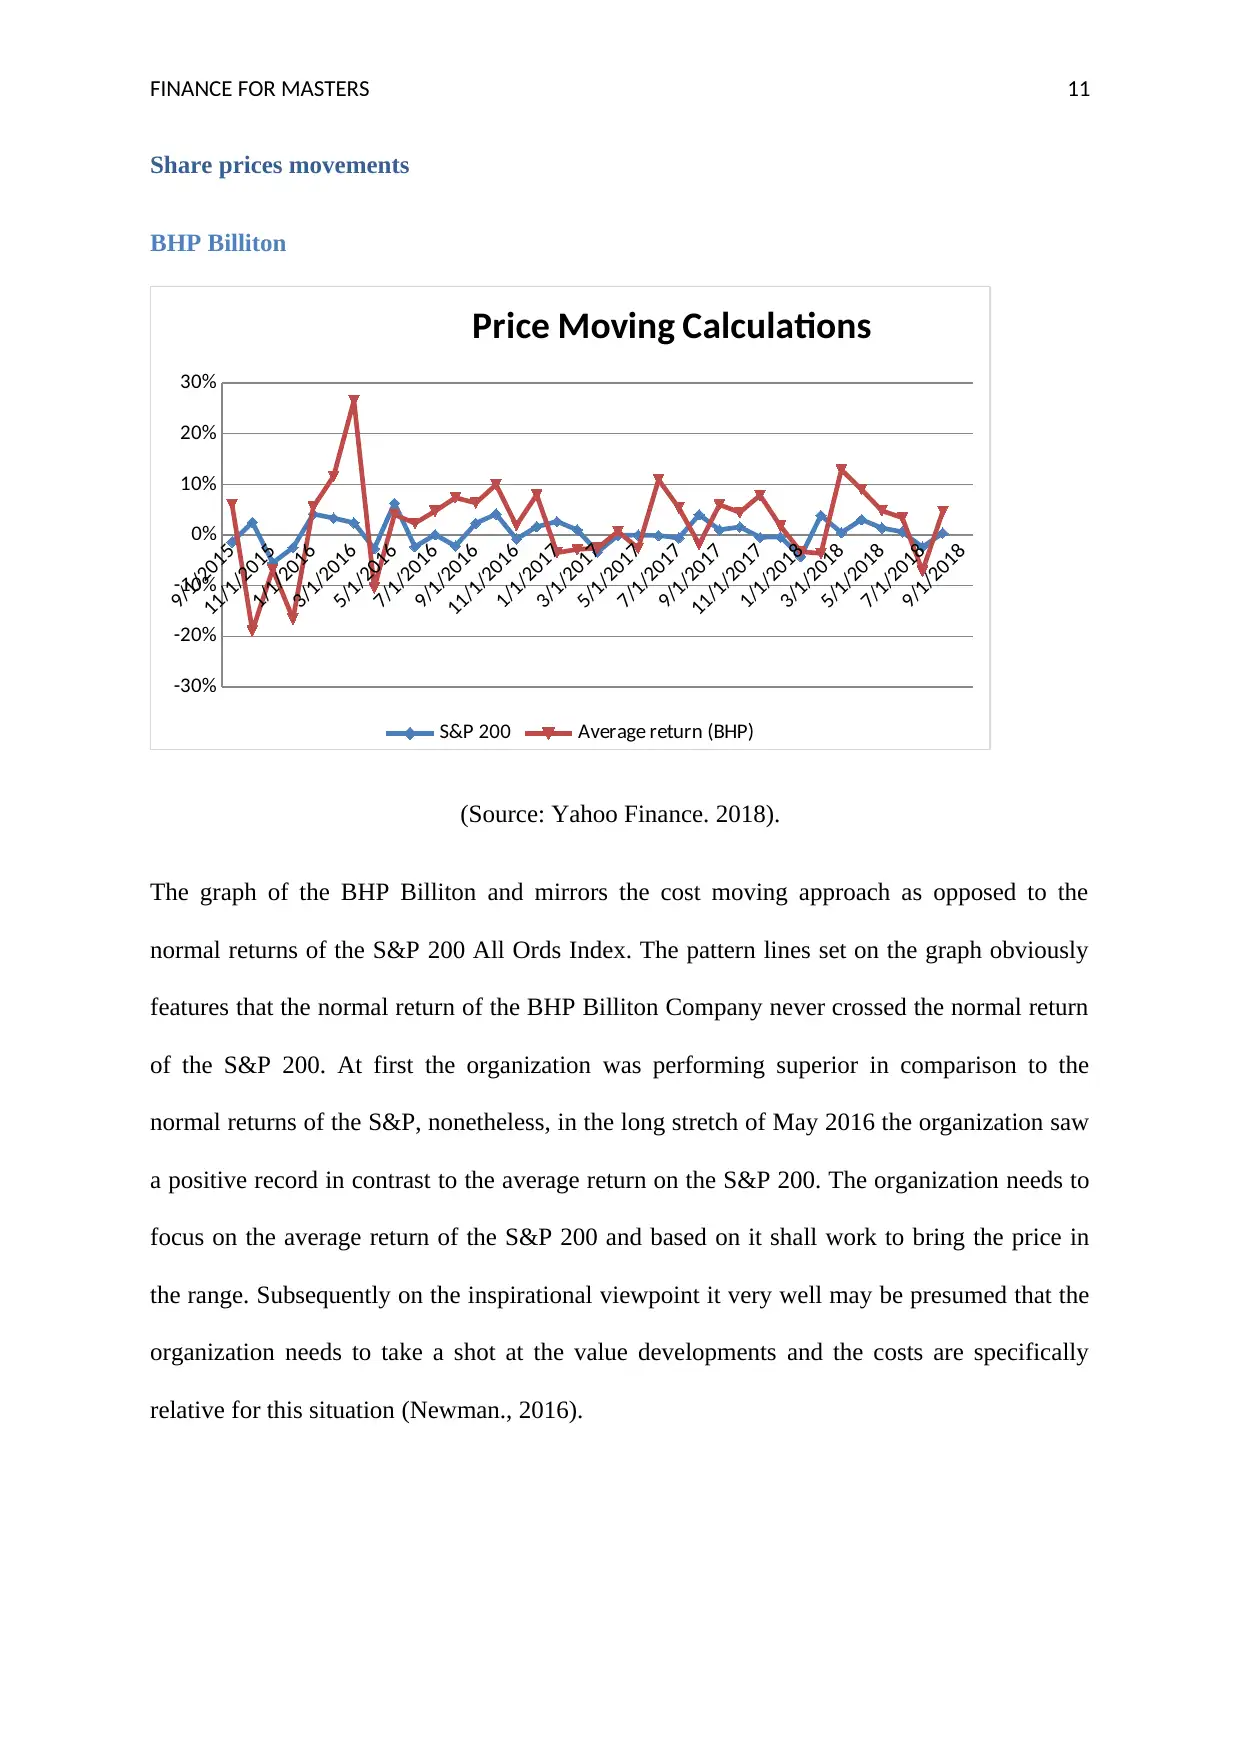
The graph of the BHP Billiton and mirrors the cost moving approach as opposed to the
normal returns of the S&P 200 All Ords Index. The pattern lines set on the graph obviously
features that the normal return of the BHP Billiton Company never crossed the normal return
of the S&P 200. At first the organization was performing superior in comparison to the
normal returns of the S&P, nonetheless, in the long stretch of May 2016 the organization saw
a positive record in contrast to the average return on the S&P 200. The organization needs to
focus on the average return of the S&P 200 and based on it shall work to bring the price in
the range. Subsequently on the inspirational viewpoint it very well may be presumed that the
organization needs to take a shot at the value developments and the costs are specifically
relative for this situation (Newman., 2016).
Share prices movements
BHP Billiton
9/1/2015
11/1/2015
1/1/2016
3/1/2016
5/1/2016
7/1/2016
9/1/2016
11/1/2016
1/1/2017
3/1/2017
5/1/2017
7/1/2017
9/1/2017
11/1/2017
1/1/2018
3/1/2018
5/1/2018
7/1/2018
9/1/2018
-30%
-20%
-10%
0%
10%
20%
30%
Price Moving Calculations
S&P 200 Average return (BHP)
(Source: Yahoo Finance. 2018).
The graph of the BHP Billiton and mirrors the cost moving approach as opposed to the
normal returns of the S&P 200 All Ords Index. The pattern lines set on the graph obviously
features that the normal return of the BHP Billiton Company never crossed the normal return
of the S&P 200. At first the organization was performing superior in comparison to the
normal returns of the S&P, nonetheless, in the long stretch of May 2016 the organization saw
a positive record in contrast to the average return on the S&P 200. The organization needs to
focus on the average return of the S&P 200 and based on it shall work to bring the price in
the range. Subsequently on the inspirational viewpoint it very well may be presumed that the
organization needs to take a shot at the value developments and the costs are specifically
relative for this situation (Newman., 2016).
FINANCE FOR MASTERS 12
Caltex limited
9/1/2015
11/1/2015
1/1/2016
3/1/2016
5/1/2016
7/1/2016
9/1/2016
11/1/2016
1/1/2017
3/1/2017
5/1/2017
7/1/2017
9/1/2017
11/1/2017
1/1/2018
3/1/2018
5/1/2018
7/1/2018
9/1/2018
-15%
-10%
-5%
0%
5%
10%
15%
Price Moving Average
Average return (Caltex) S&P 200
(Source: Yahoo Finance. 2018).
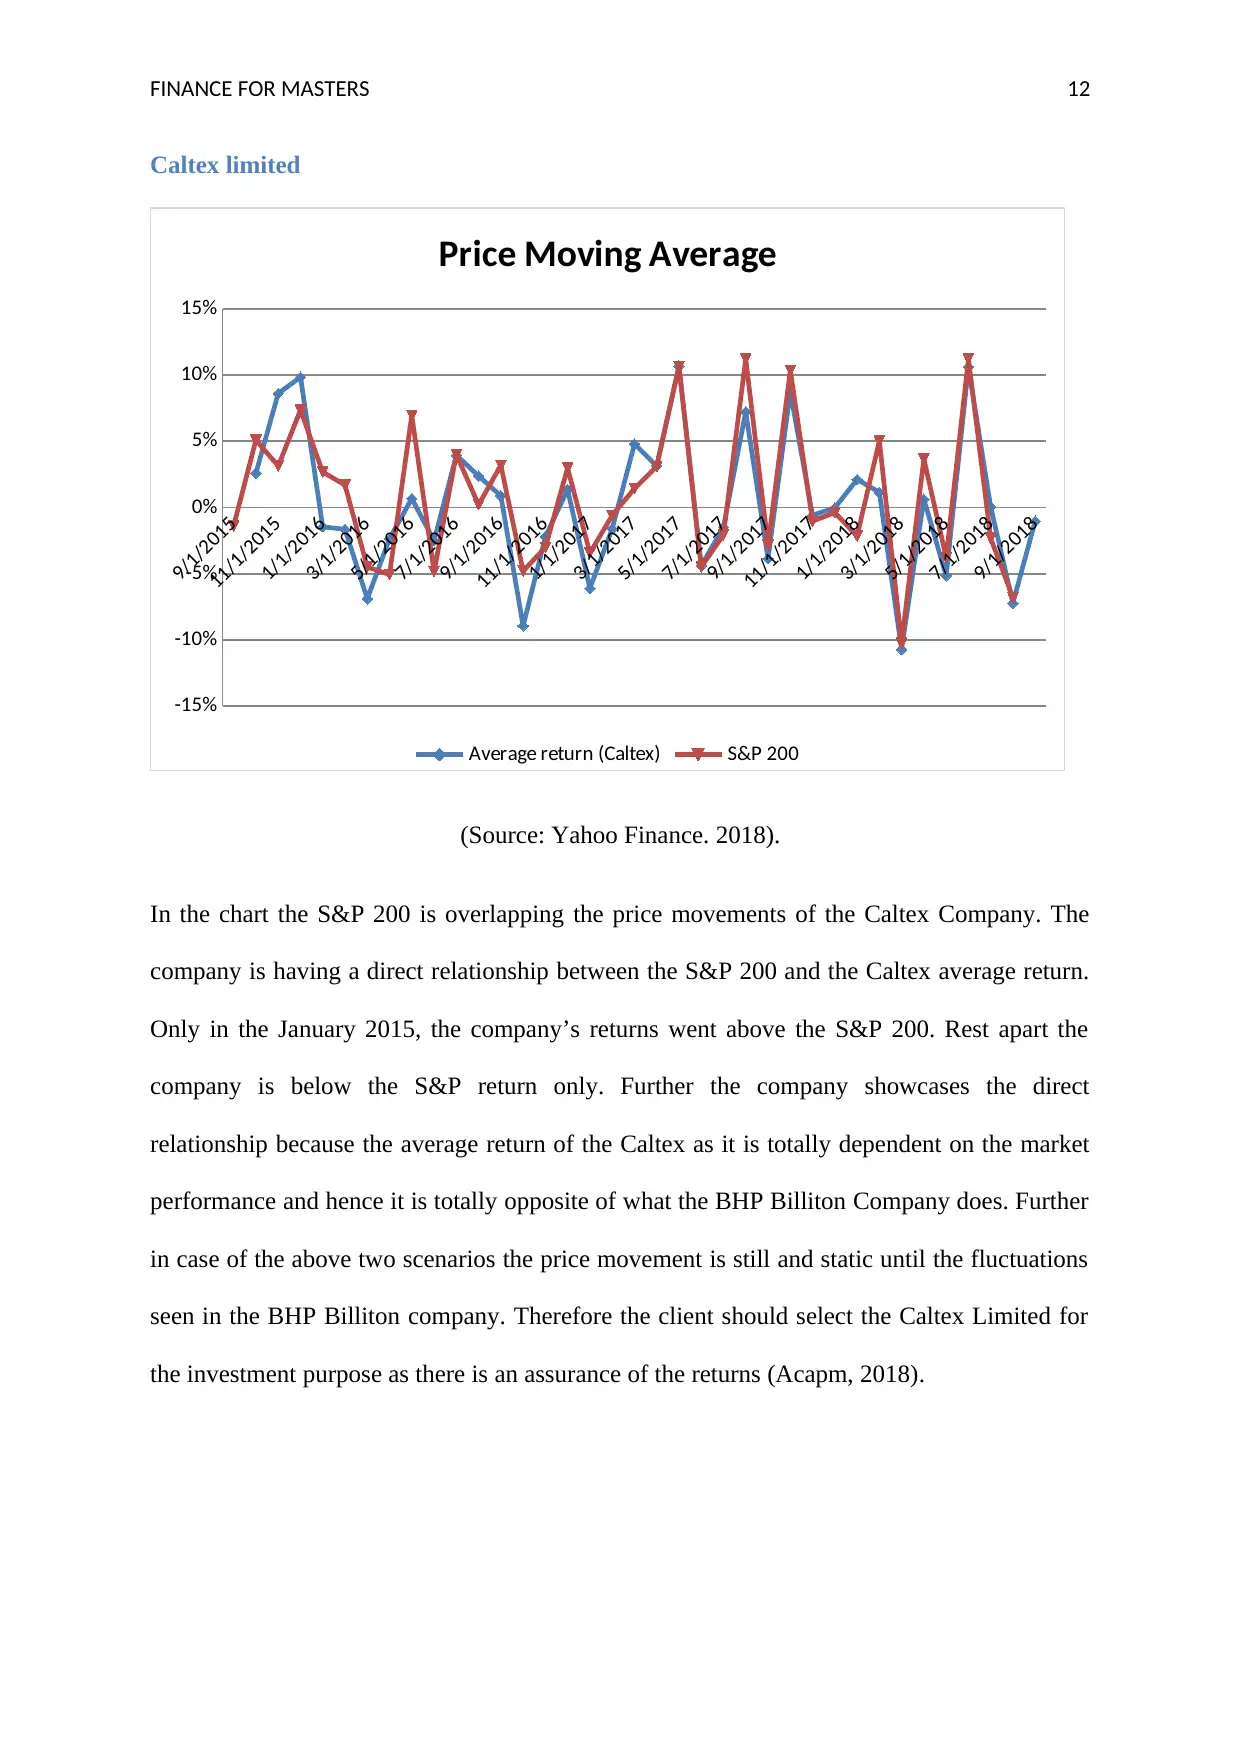
In the chart the S&P 200 is overlapping the price movements of the Caltex Company. The
company is having a direct relationship between the S&P 200 and the Caltex average return.
Only in the January 2015, the company’s returns went above the S&P 200. Rest apart the
company is below the S&P return only. Further the company showcases the direct
relationship because the average return of the Caltex as it is totally dependent on the market
performance and hence it is totally opposite of what the BHP Billiton Company does. Further
in case of the above two scenarios the price movement is still and static until the fluctuations
seen in the BHP Billiton company. Therefore the client should select the Caltex Limited for
the investment purpose as there is an assurance of the returns (Acapm, 2018).
Caltex limited
9/1/2015
11/1/2015
1/1/2016
3/1/2016
5/1/2016
7/1/2016
9/1/2016
11/1/2016
1/1/2017
3/1/2017
5/1/2017
7/1/2017
9/1/2017
11/1/2017
1/1/2018
3/1/2018
5/1/2018
7/1/2018
9/1/2018
-15%
-10%
-5%
0%
5%
10%
15%
Price Moving Average
Average return (Caltex) S&P 200
(Source: Yahoo Finance. 2018).
In the chart the S&P 200 is overlapping the price movements of the Caltex Company. The
company is having a direct relationship between the S&P 200 and the Caltex average return.
Only in the January 2015, the company’s returns went above the S&P 200. Rest apart the
company is below the S&P return only. Further the company showcases the direct
relationship because the average return of the Caltex as it is totally dependent on the market
performance and hence it is totally opposite of what the BHP Billiton Company does. Further
in case of the above two scenarios the price movement is still and static until the fluctuations
seen in the BHP Billiton company. Therefore the client should select the Caltex Limited for
the investment purpose as there is an assurance of the returns (Acapm, 2018).
Paraphrase This Document
Need a fresh take? Get an instant paraphrase of this document with our AI Paraphraser
FINANCE FOR MASTERS 13
Factors affecting the share price
BHP Billiton
The stock seems to be fairly valued at the moment of the recording of the stock through the
valuation model. The trading is around 3.09% below the intrinsic value and therefore the
current market trends suggest that if the investor or the client wants to purchase the BHP
Billiton shares this is the right time. Further there are certain factors which influence the price
of the shares which are outlined below (Newman., 2016).
Resilient commodity prices: The share price of the BHP Billiton affects by the fact that
there is a core dominance of the commodity prices. It continues to strengthen the market
share of the company and hence it has a greater impact on the prices (Newman., 2016).
Dividends : If the elevated prices of the commodity grows and at the same time BHP Billiton
continues to reduce the costs across its business, BHP could remain in the better place and
such move is likely beneficial and accepted by the investors and the shareholders.
Caltex Limited
Again the price fluctuation reason in case of the Caltex Limited is the removal of the Chevron
from the share register typically increases the Caltex’s shares and arguably opens it up for the
purpose of the merger and acquisition activity (Llewellyn, 2016).
The drop in the share price has regularly led to the Caltex stock take a curve towards the
attractive pricing strategy. The dividend yield posts the theories of the Chevron and its exit
has been amazing. This happened because the investors are set to gain an advantage from the
release of franking credits, the major cause of building up due to Chevron (Acapm, 2018).
FINANCE FOR MASTERS 14
Beta values
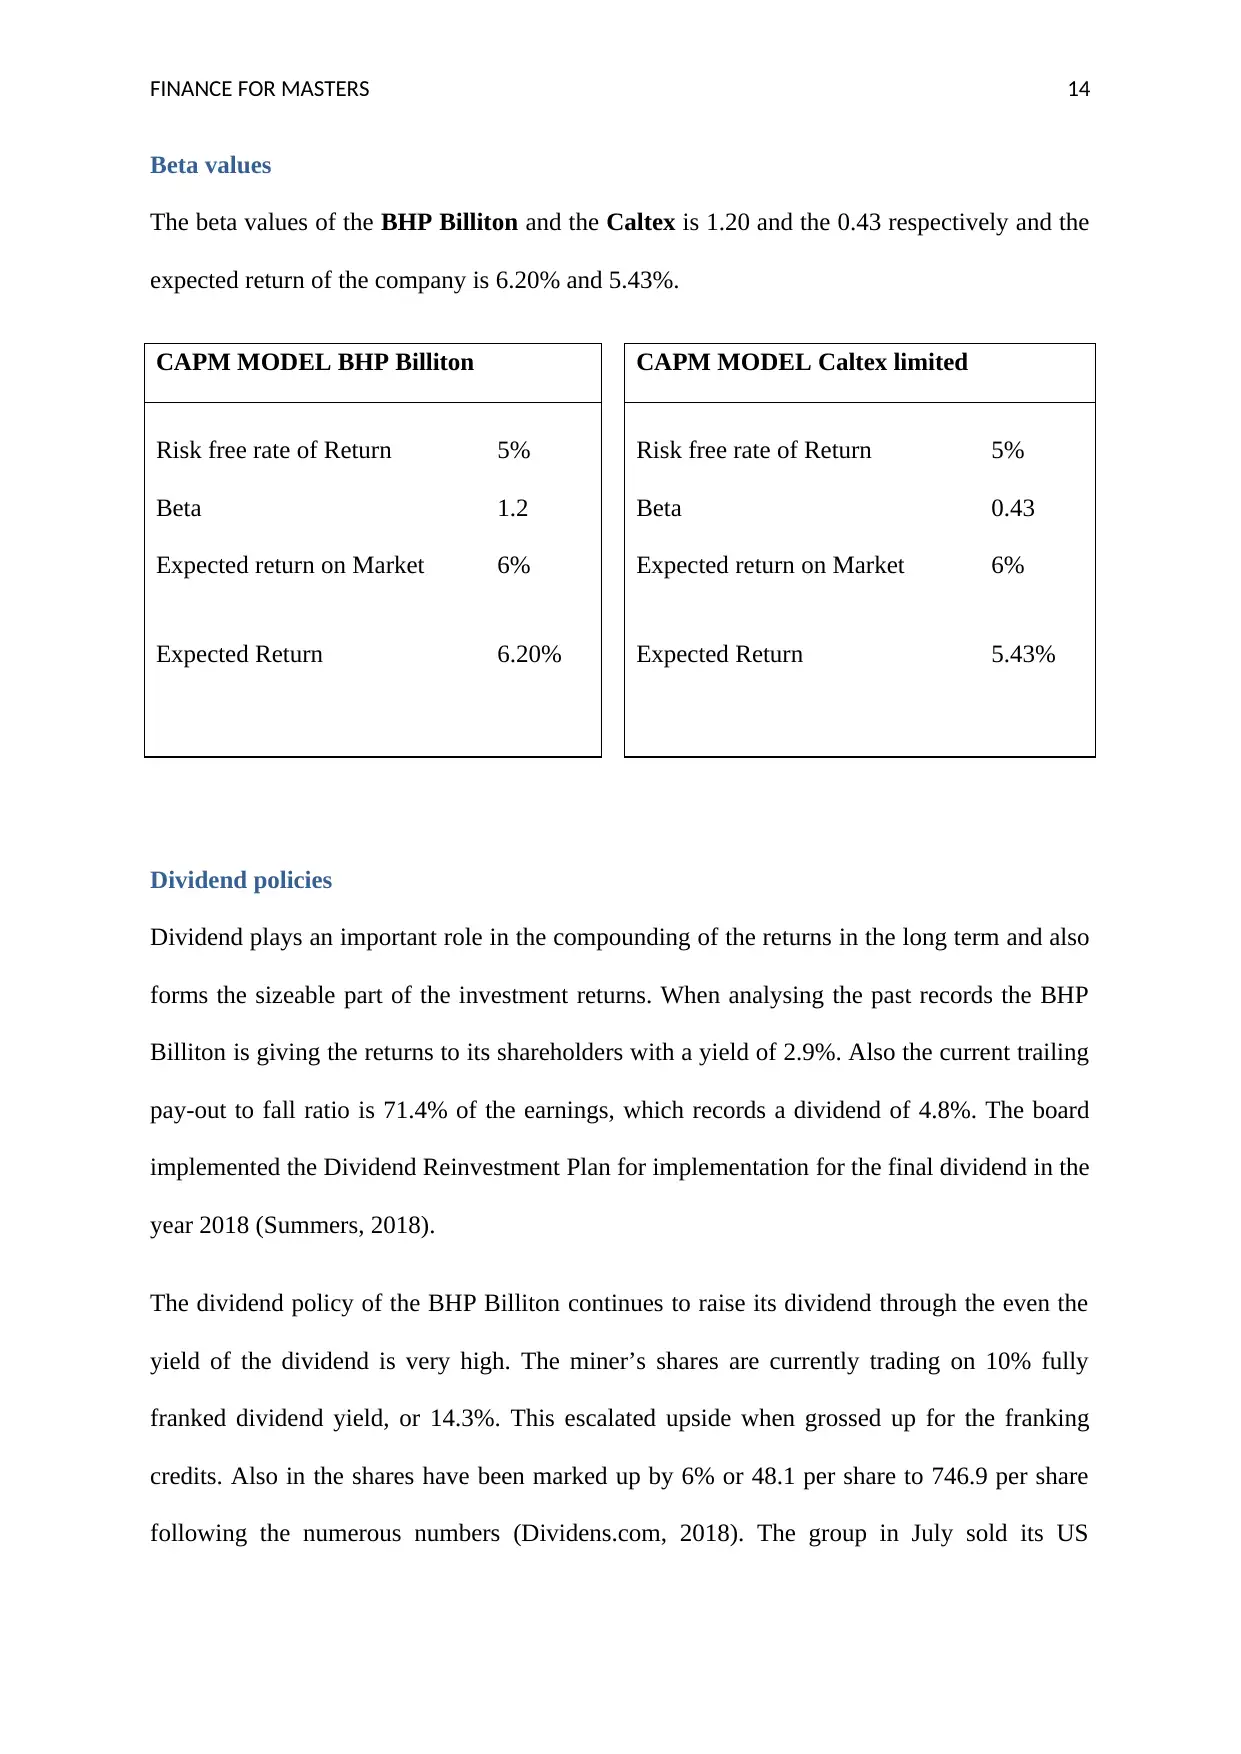
The beta values of the BHP Billiton and the Caltex is 1.20 and the 0.43 respectively and the
expected return of the company is 6.20% and 5.43%.
CAPM MODEL BHP Billiton CAPM MODEL Caltex limited
Risk free rate of Return 5% Risk free rate of Return 5%
Beta 1.2 Beta 0.43
Expected return on Market 6% Expected return on Market 6%
Expected Return 6.20% Expected Return 5.43%
Dividend policies
Dividend plays an important role in the compounding of the returns in the long term and also
forms the sizeable part of the investment returns. When analysing the past records the BHP
Billiton is giving the returns to its shareholders with a yield of 2.9%. Also the current trailing
pay-out to fall ratio is 71.4% of the earnings, which records a dividend of 4.8%. The board
implemented the Dividend Reinvestment Plan for implementation for the final dividend in the
year 2018 (Summers, 2018).
The dividend policy of the BHP Billiton continues to raise its dividend through the even the
yield of the dividend is very high. The miner’s shares are currently trading on 10% fully
franked dividend yield, or 14.3%. This escalated upside when grossed up for the franking
credits. Also in the shares have been marked up by 6% or 48.1 per share to 746.9 per share
following the numerous numbers (Dividens.com, 2018). The group in July sold its US
Beta values
The beta values of the BHP Billiton and the Caltex is 1.20 and the 0.43 respectively and the
expected return of the company is 6.20% and 5.43%.
CAPM MODEL BHP Billiton CAPM MODEL Caltex limited
Risk free rate of Return 5% Risk free rate of Return 5%
Beta 1.2 Beta 0.43
Expected return on Market 6% Expected return on Market 6%
Expected Return 6.20% Expected Return 5.43%
Dividend policies
Dividend plays an important role in the compounding of the returns in the long term and also
forms the sizeable part of the investment returns. When analysing the past records the BHP
Billiton is giving the returns to its shareholders with a yield of 2.9%. Also the current trailing
pay-out to fall ratio is 71.4% of the earnings, which records a dividend of 4.8%. The board
implemented the Dividend Reinvestment Plan for implementation for the final dividend in the
year 2018 (Summers, 2018).
The dividend policy of the BHP Billiton continues to raise its dividend through the even the
yield of the dividend is very high. The miner’s shares are currently trading on 10% fully
franked dividend yield, or 14.3%. This escalated upside when grossed up for the franking
credits. Also in the shares have been marked up by 6% or 48.1 per share to 746.9 per share
following the numerous numbers (Dividens.com, 2018). The group in July sold its US
FINANCE FOR MASTERS 15
onshore oil and shale gas business to energy giant the BP and the merit energy for the amount
of the 10 million. In total the group paid the dividend of the $6.3 billion which is also
inclusive of the $1.8billion above the minimum pay out policy (Dividens.com, 2018).
On 28th August 2018 the Caltex Limited announced the financial results for the six months
ending 30th June 2018. The interim dividend paid by the company is 57 cents per share which
is fully franked and can be cashed as required. The company also represents the pay-out ratio
of 50.3%. The board reviews the policy and the Caltex Limited intends to pay the total
dividends for each section and the record payment dates are 11th September and 5th October
2018 (Acapm, 2018).
Recommendation letter
Dear Client,
This is to inform you that as per the comparative analysis undertaken of both the firm such as
the BHP Billiton and the Caltex Limited it can be inferred from the figures that the
profitability position of the Caltex Limited is much better than the BHP. The leverage ratios
of the BHP company is low in terms of the ICR, however the Debt to Equity ratio is sound in
case of the BHP so there is a mixed result (Jenter and Lewellen, 2015). Lastly looking at the
liquidity position of the company the BHP is sound. Moreover in terms of the price
movements the BHP is the sound partner and according to the CAPM model the beta value of
the BHP is high and so are the returns at 6.20% in comparison to the 0.43 beta value of the
Caltex and the expected return being the 5.43% which is lower than the BHP. Hence in
overall scenario the BHP is performing better and the company can expect the good returns if
the investment is made.
Yours Sincerely
Secure Best Marks with AI Grader
Need help grading? Try our AI Grader for instant feedback on your assignments.

FINANCE FOR MASTERS 16
Investment Analyst
Conclusion
From the above analysis it can be deduced that the crucial ideas and the monetary
investigation of the organization is equally necessary to get a comprehension of how the
organization is performing from each edge and accordingly the examination of the ratios and
price movements have been taken to shape a hold. This won't just help the financial
specialists and the investors in settling on the choice whether to contribute hold or sell the
shares however they will likewise know about any dynamic advances or changes that are to
be taken by the organization which will assist them with having the future and the long term
benefits.
FINANCE FOR MASTERS 17
References
Acapm, (2018) 3 reasons now could be the time to buy Caltex Australia Limited [Online]
Available from https://acapmag.com.au/2015/04/3-reasons-now-could-be-the-time-to-buy-
caltex-australia-limited/ [Accessed on 30th September 2018]
Barkan, S.M., Bintliff, B. and Whisner, M., (2015) Fundamentals of legal research. United
States: John and Wiley sons.
Dividens.com, (2018) BHP Billiton: Dividend Policy in Focus [Online] Available from
http://www.dividend.com/news/2015/11/20/bhp-billiton-dividend-policy-in-focus/ [Accessed
on 30th September 2018]
Gitman, L.J., Juchau, R. and Flanagan, J. (2015) Principles of managerial finance. Australia:
Pearson Higher Education AU.
Jenter, D. and Lewellen, K. (2015).CEO preferences and acquisitions.The Journal of
Finance, 70(6), 2813-2852.
Kimmel, P. D., Weygandt, J. J., and Kieso, D. E. (2010) Financial accounting: tools for
business decision making. New Jersey: John Wiley and Sons.
Krantz, M., and Johnson, R. R. (2014) Investment Banking for Dummies. New Jersy: John
Wiley and Sons.
Lee, A. C., Lee, J. C., and Lee, C. F. (2009) Financial analysis, planning and forecasting:
Theory and application. Singapore: World Scientific Publishing Co Inc. California:
Routledge.
Lee, J.Y. and Eom, J.G., (2016) Analysis of Corporate Recruitment through ser-M Model:
Case Study of GS Caltex. 16(3), pp.181-194.
Llewellyn, K.N., (2016) The common law tradition: Deciding appeals United States of
America: Quid Pro Books.
FINANCE FOR MASTERS 18
Millar, R.J., Hepburn, C., Beddington, J. and Allen, M.R., (2018) Principles to guide
investment towards a stable climate. Nature Climate Change, 8(1), p.2.
Newman., R. (2016) 3 ways the BHP Billiton Limited share price could go higher in 2017
[Online] Available from https://www.fool.com.au/2016/12/23/3-ways-the-bhp-billiton-
limited-share-price-could-go-higher-in-2017/ [Accessed on 30th September 2018]
Nikolai, L. A., Bazley, J. D., and Jones, J. P. (2009) Intermediate Accounting. USA: Cengage
Learning.
Olson, D.M., (2015) Democratic Legislative Institutions: A Comparative View: A
Comparative View. California: Routledge.
Sari, R.K., Nurlaela, S. and Titisari, K.H., (2018) The Effect of Liquidity Ratio, Profitability
Ratio, Company Size, and Leverage on Bond Rating in Construction and Real Estate
Company. In PROCEEDING ICTESS (Internasional Conference on Technology, Education
and Social Sciences).
Summers., L. (2018) What Does BHP Billiton Limited’s (ASX:BHP) Share Price Indicate
[Online] Available from https://simplywall.st/stocks/au/materials/asx-bhp/bhp-billiton-
shares/news/what-does-bhp-billiton-limiteds-asxbhp-share-price-indicate/ [Accessed on 30th
September 2018]
Vogel, H.L. (2014). Entertainment industry economics: A guide for financial analysis. New
York: Cambridge University Press.
1 out of 19
Related Documents


Your All-in-One AI-Powered Toolkit for Academic Success.
+13062052269
info@desklib.com
Available 24*7 on WhatsApp / Email
![[object Object]](/_next/static/media/star-bottom.7253800d.svg)
Unlock your academic potential
© 2024 | Zucol Services PVT LTD | All rights reserved.