Financial Analysis (Definition, Guide)
Added on 2022-08-26
35 Pages9194 Words20 Views
Running head: FINANCIAL ANALYSIS
Financial Analysis
Name of the Student:
Name of the University:
Author’s Note:
Financial Analysis
Name of the Student:
Name of the University:
Author’s Note:
FINANCIAL ANALYSIS1
Table of Contents
1.0 Introduction.......................................................................................................... 2
1.1 Overview of Strategic Financial Analysis...........................................................2
1.2 Background of Companies................................................................................. 2
1.3 Purpose of the report........................................................................................ 2
1.4 Structure of the report...................................................................................... 2
Ratio Analysis....................................................................................................... 2
Common Size Statement...................................................................................... 3
DuPont................................................................................................................. 3
2.0 Strategic Financial Analysis..................................................................................3
2.1 Ratio analysis – 3-Year Trend, year on year trend analysis...............................3
2.1.1 Profitability.................................................................................................. 3
2.1.2 Liquidity...................................................................................................... 5
2.1.3 Solvency...................................................................................................... 7
2.1.4 Efficiency..................................................................................................... 8
2.1.5 Investor..................................................................................................... 10
2.2 Common Size statement................................................................................. 12
2.2.1 Vertical common size analysis..................................................................12
2.2.2 Horizontal common size analysis..............................................................12
2.3 DuPont............................................................................................................ 12
3.0 Analysis and Evaluation of Limitations and Strengths of Methods......................13
3.1 Ratio Analysis.................................................................................................. 13
3.1.1 Ratio Analysis – Limitations and Strengths................................................13
3.1.2. Contemporary Methods Proposed to Minimize Limitations of Ratio Analysis
........................................................................................................................... 13
3.2 Common Size Statement Analysis...................................................................14
3.2.1 Common Size Statement Analysis – Limitations and Strengths................14
3.2.2 Contemporary Methods Proposed to Minimize Common Size Statement
Analysis.............................................................................................................. 14
3.3 DuPont Analysis............................................................................................... 14
3.3.1 Common Size Statement Analysis – Limitations and Strengths................15
3.3.2 Contemporary Methods Proposed to Minimize DuPont Analysis................15
4.0 Conclusion and Recommendations.....................................................................15
6.0 Appendix............................................................................................................ 16
FINANCIAL ANALYSIS2
6.1 Vertical............................................................................................................ 16
6.2 Horizontal........................................................................................................ 20
References............................................................................................................... 26
FINANCIAL ANALYSIS3
1.0 Introduction
1.1 Overview of Strategic Financial Analysis
Strategic financial analysis is the method of combination tool to interpret the financial
information to foresee whether the organization is moving towards in achieving the goals from
the financial perspective. Strategic financial analysis provides information and helps in assisting
the company and their stake holders to accomplish their mission. It helps to seek answers for
whether the company has performed successfully, comparatively to its own past performance
and to its competitors and helps to analyse future performance or the value of the company and
shares it issues. Strategic financial analysis uses data such as company’s annual report, financial
statements and notes, and management commentary (operating and financial review or
management’s discussion and analysis) to identify financial risks and key ratio is used to
calculate the financial health (Elaine Henry 2011 and Prager 2005).
1.2 Background of Companies
Wolseley was discovered in 1887 by Frederick York Wolseley started as Wolseley Sheep
Shearing Machine Company. The company then further extended to manufacture. During the
period 1901, the company started to sell car and machine tool business which became a part of
Morris Motors, BMC, British Leyland and Rover Group. On 31st July 2017 Wolseley plc
changed its name to Ferguson plc. Ferguson has over 1 million customers served by 35,000
associates in 2,280 locations (corporate.wolseley.co.uk).
Tate & Lyle was founded by Henry Tate & sons and Abram Lyle & Sons in 1921 where
the initially started as sugar refining business. After 1970’s they started to expanded to raw
materials such as corn and tapioca into ingredients that add taste, texture, and nutrients to food
and beverages. Now the Tate &Lyle is well known for the global supplier of food and beverage
ingredients to industrial market. Tate & Lyle started as a small factory in Liverpool to now
delivering from 30 countries from over 70 location (tateandlyle.com)
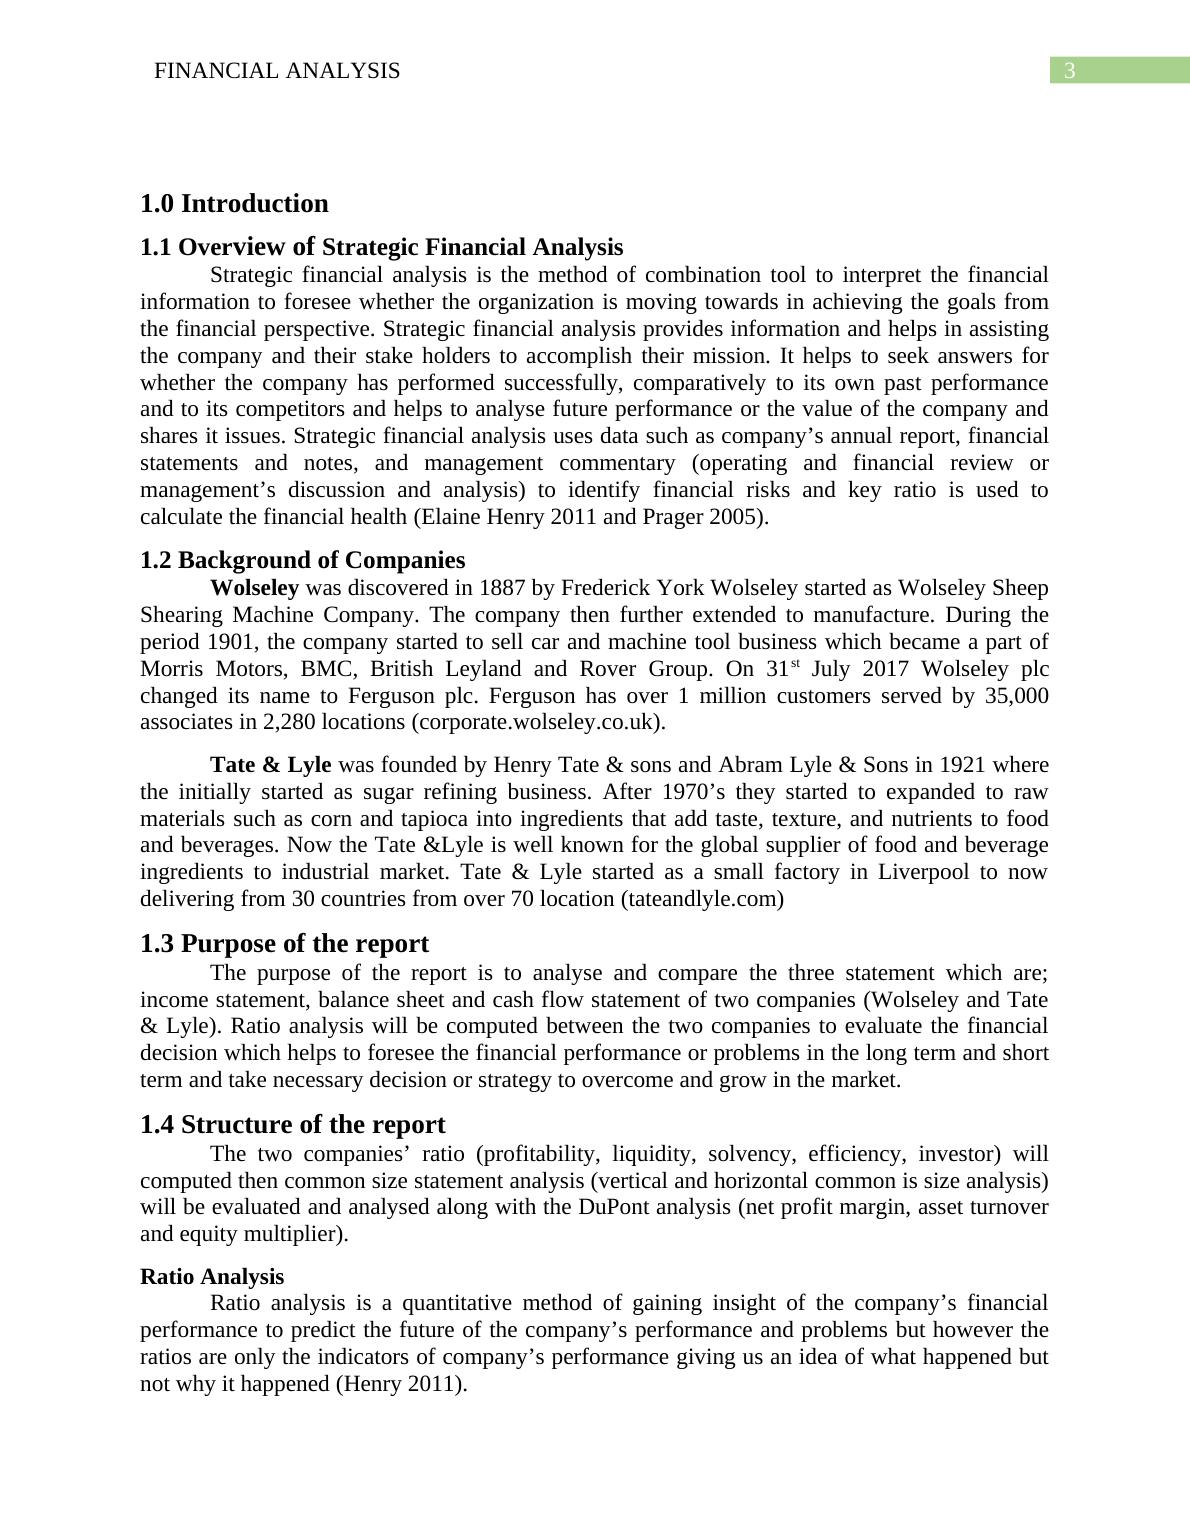
1.3 Purpose of the report
The purpose of the report is to analyse and compare the three statement which are;
income statement, balance sheet and cash flow statement of two companies (Wolseley and Tate
& Lyle). Ratio analysis will be computed between the two companies to evaluate the financial
decision which helps to foresee the financial performance or problems in the long term and short
term and take necessary decision or strategy to overcome and grow in the market.
1.4 Structure of the report
The two companies’ ratio (profitability, liquidity, solvency, efficiency, investor) will
computed then common size statement analysis (vertical and horizontal common is size analysis)
will be evaluated and analysed along with the DuPont analysis (net profit margin, asset turnover
and equity multiplier).
Ratio Analysis
Ratio analysis is a quantitative method of gaining insight of the company’s financial
performance to predict the future of the company’s performance and problems but however the
ratios are only the indicators of company’s performance giving us an idea of what happened but
not why it happened (Henry 2011).
1.0 Introduction
1.1 Overview of Strategic Financial Analysis
Strategic financial analysis is the method of combination tool to interpret the financial
information to foresee whether the organization is moving towards in achieving the goals from
the financial perspective. Strategic financial analysis provides information and helps in assisting
the company and their stake holders to accomplish their mission. It helps to seek answers for
whether the company has performed successfully, comparatively to its own past performance
and to its competitors and helps to analyse future performance or the value of the company and
shares it issues. Strategic financial analysis uses data such as company’s annual report, financial
statements and notes, and management commentary (operating and financial review or
management’s discussion and analysis) to identify financial risks and key ratio is used to
calculate the financial health (Elaine Henry 2011 and Prager 2005).
1.2 Background of Companies
Wolseley was discovered in 1887 by Frederick York Wolseley started as Wolseley Sheep
Shearing Machine Company. The company then further extended to manufacture. During the
period 1901, the company started to sell car and machine tool business which became a part of
Morris Motors, BMC, British Leyland and Rover Group. On 31st July 2017 Wolseley plc
changed its name to Ferguson plc. Ferguson has over 1 million customers served by 35,000
associates in 2,280 locations (corporate.wolseley.co.uk).
Tate & Lyle was founded by Henry Tate & sons and Abram Lyle & Sons in 1921 where
the initially started as sugar refining business. After 1970’s they started to expanded to raw
materials such as corn and tapioca into ingredients that add taste, texture, and nutrients to food
and beverages. Now the Tate &Lyle is well known for the global supplier of food and beverage
ingredients to industrial market. Tate & Lyle started as a small factory in Liverpool to now
delivering from 30 countries from over 70 location (tateandlyle.com)
1.3 Purpose of the report
The purpose of the report is to analyse and compare the three statement which are;
income statement, balance sheet and cash flow statement of two companies (Wolseley and Tate
& Lyle). Ratio analysis will be computed between the two companies to evaluate the financial
decision which helps to foresee the financial performance or problems in the long term and short
term and take necessary decision or strategy to overcome and grow in the market.
1.4 Structure of the report
The two companies’ ratio (profitability, liquidity, solvency, efficiency, investor) will
computed then common size statement analysis (vertical and horizontal common is size analysis)
will be evaluated and analysed along with the DuPont analysis (net profit margin, asset turnover
and equity multiplier).
Ratio Analysis
Ratio analysis is a quantitative method of gaining insight of the company’s financial
performance to predict the future of the company’s performance and problems but however the
ratios are only the indicators of company’s performance giving us an idea of what happened but
not why it happened (Henry 2011).
FINANCIAL ANALYSIS4
Common Size Statement
Common size statement is an income statement where each item in the income statement
is expressed as percentage of sales or revenue which is also known as vertical common analysis.
Common size statement can be divided into vertical and horizontal common size analysis (Ryan
2016). Horizontal analysis which is also knowns as the trend analysis is the method to analysis
the financial statement which shows the changes in the amounts of corresponding financial
statement items over a period of time (accountingformanagement.org).
DuPont
DuPont analysis is used evaluate the performance of the company such as the how well
the company assets are being used, to determine the profitability and to know the financial
position of the company. DuPont analysis uses profit margin, asset turnover and equity multiplier
ratio to analyse the company’s performance (Nurul 2018).
2.0 Strategic Financial Analysis
2.1 Ratio analysis – 3-Year Trend, year on year trend analysis
According to Myers, “Ratio analysis is a study of relationship among various financial
factors in a business” (Grewal 2016). Thus, it Is a method analysing the financial statement by
computing the ratio such as profitability, liquidity, solvency, efficiency and investors ratio. Ratio
analysis is to express the proportional relationship between the figures in the financial statement.
It is based on the balance sheet, income statement and cash flow (Sergio 2016).
2.1.1 Profitability
Profitability ratio is the measure that indicates of the ability of the company to earn profit.
Profitability of the company is analysed through Gross Profit Ratio (GPR), Operating Ratio (or),
Operating Profit Ratio (OPR), Net Profit Ratio (NPR) and Return on Investment or capital
Employed (ROI/ROCE) (Grewal 2016). Most of the organization uses Gross Profit Ratio
(GPR) and Net Profit Ratio (NPR) which will be used to calculate profitability ratio of
Wolseley and Tate & Lyle.
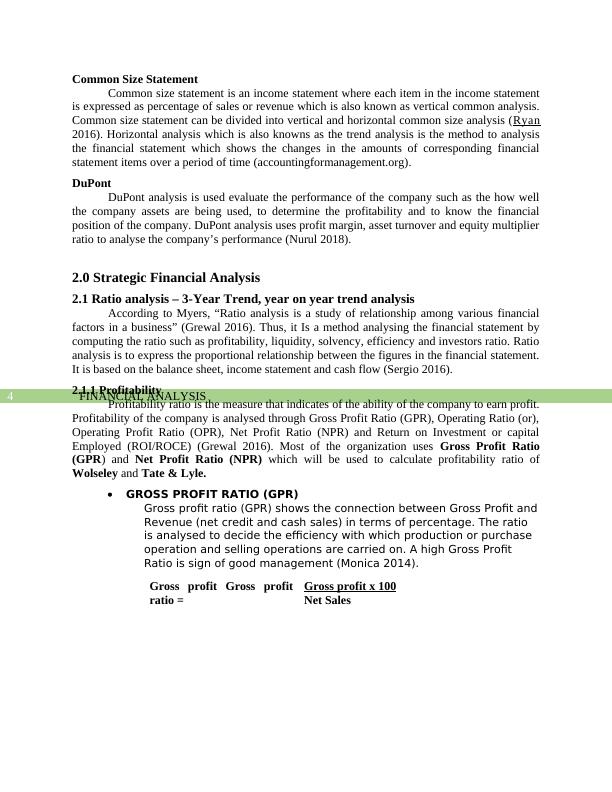
GROSS PROFIT RATIO (GPR)
Gross profit ratio (GPR) shows the connection between Gross Profit and
Revenue (net credit and cash sales) in terms of percentage. The ratio
is analysed to decide the efficiency with which production or purchase
operation and selling operations are carried on. A high Gross Profit
Ratio is sign of good management (Monica 2014).
Gross profit Gross profit
ratio =
Gross profit x 100
Net Sales
Common Size Statement
Common size statement is an income statement where each item in the income statement
is expressed as percentage of sales or revenue which is also known as vertical common analysis.
Common size statement can be divided into vertical and horizontal common size analysis (Ryan
2016). Horizontal analysis which is also knowns as the trend analysis is the method to analysis
the financial statement which shows the changes in the amounts of corresponding financial
statement items over a period of time (accountingformanagement.org).
DuPont
DuPont analysis is used evaluate the performance of the company such as the how well
the company assets are being used, to determine the profitability and to know the financial
position of the company. DuPont analysis uses profit margin, asset turnover and equity multiplier
ratio to analyse the company’s performance (Nurul 2018).
2.0 Strategic Financial Analysis
2.1 Ratio analysis – 3-Year Trend, year on year trend analysis
According to Myers, “Ratio analysis is a study of relationship among various financial
factors in a business” (Grewal 2016). Thus, it Is a method analysing the financial statement by
computing the ratio such as profitability, liquidity, solvency, efficiency and investors ratio. Ratio
analysis is to express the proportional relationship between the figures in the financial statement.
It is based on the balance sheet, income statement and cash flow (Sergio 2016).
2.1.1 Profitability
Profitability ratio is the measure that indicates of the ability of the company to earn profit.
Profitability of the company is analysed through Gross Profit Ratio (GPR), Operating Ratio (or),
Operating Profit Ratio (OPR), Net Profit Ratio (NPR) and Return on Investment or capital
Employed (ROI/ROCE) (Grewal 2016). Most of the organization uses Gross Profit Ratio
(GPR) and Net Profit Ratio (NPR) which will be used to calculate profitability ratio of
Wolseley and Tate & Lyle.
GROSS PROFIT RATIO (GPR)
Gross profit ratio (GPR) shows the connection between Gross Profit and
Revenue (net credit and cash sales) in terms of percentage. The ratio
is analysed to decide the efficiency with which production or purchase
operation and selling operations are carried on. A high Gross Profit
Ratio is sign of good management (Monica 2014).
Gross profit Gross profit
ratio =
Gross profit x 100
Net Sales
FINANCIAL ANALYSIS5
2017 2018 2019
0.00%
5.00%
10.00%
15.00%
20.00%
25.00%
30.00%
35.00%
40.00%
45.00%
Gross Margin
Wolseley Tate & Lyle
year
percentage
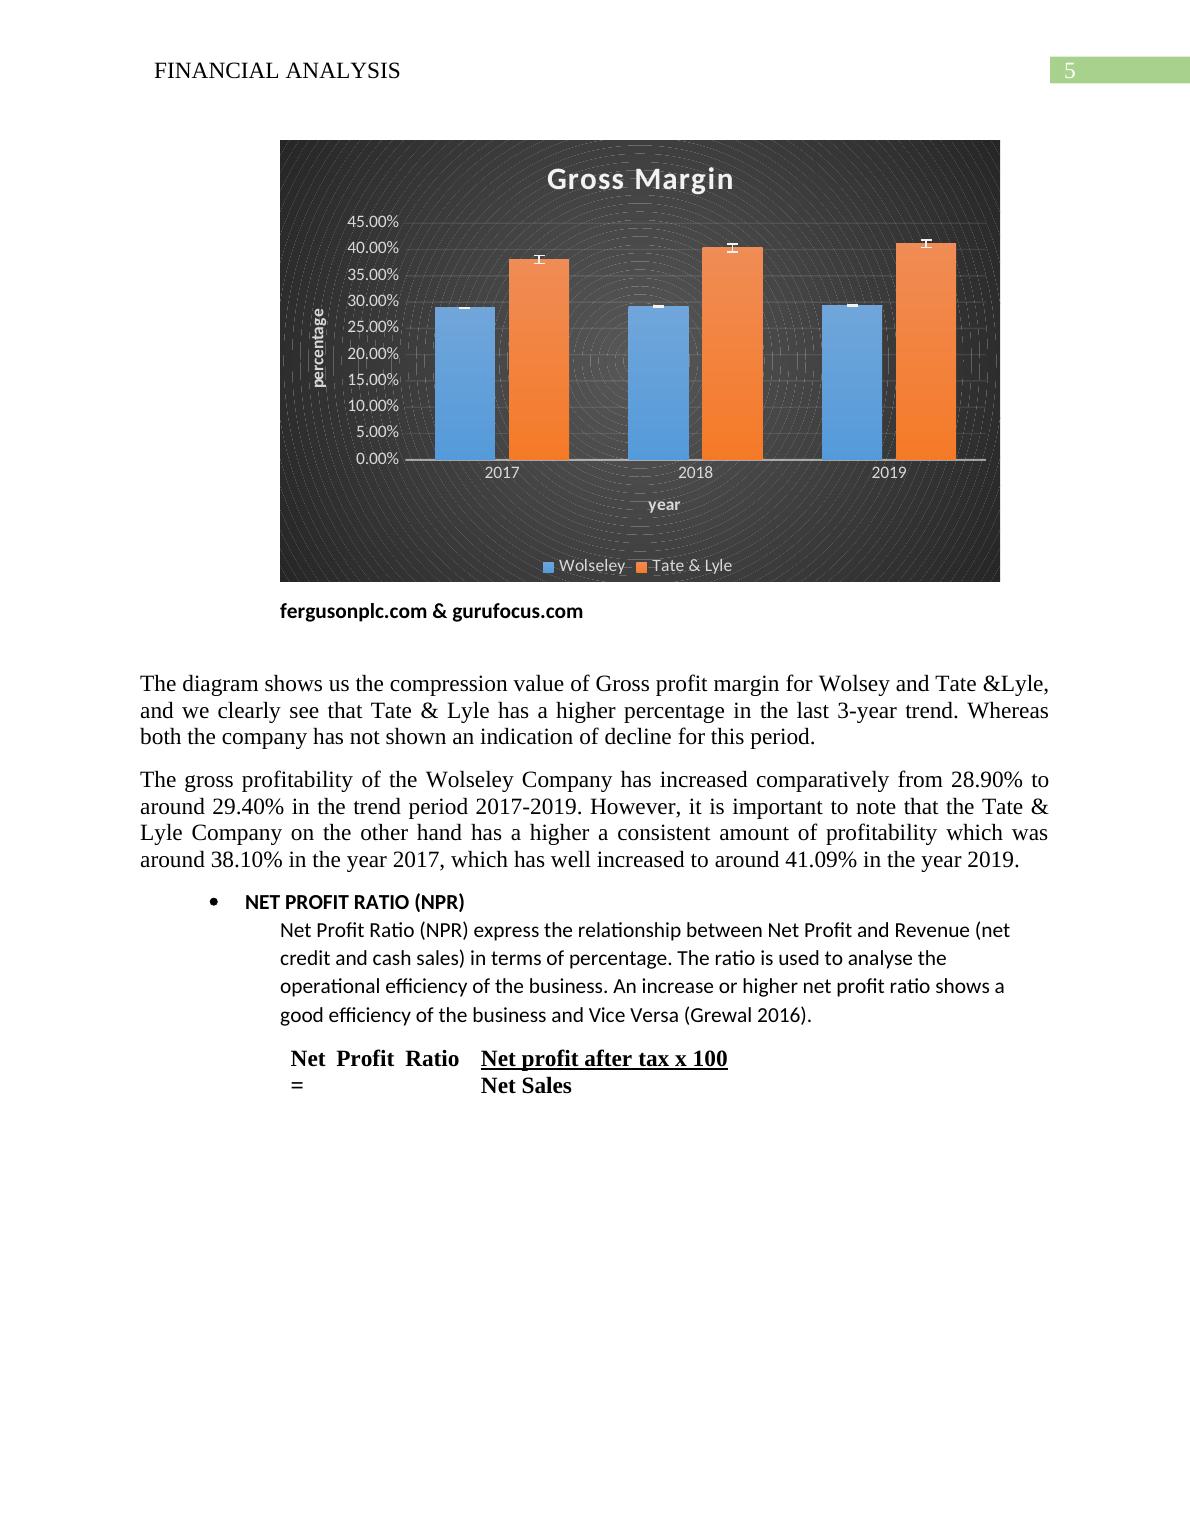
fergusonplc.com & gurufocus.com
The diagram shows us the compression value of Gross profit margin for Wolsey and Tate &Lyle,
and we clearly see that Tate & Lyle has a higher percentage in the last 3-year trend. Whereas
both the company has not shown an indication of decline for this period.
The gross profitability of the Wolseley Company has increased comparatively from 28.90% to
around 29.40% in the trend period 2017-2019. However, it is important to note that the Tate &
Lyle Company on the other hand has a higher a consistent amount of profitability which was
around 38.10% in the year 2017, which has well increased to around 41.09% in the year 2019.
NET PROFIT RATIO (NPR)
Net Profit Ratio (NPR) express the relationship between Net Profit and
Revenue (net credit and cash sales) in terms of percentage. The ratio
is used to analyse the operational efficiency of the business. An
increase or higher net profit ratio shows a good efficiency of the
business and Vice Versa (Grewal 2016).
Net Profit Ratio
=
Net profit after tax x 100
Net Sales
2017 2018 2019
0.00%
5.00%
10.00%
15.00%
20.00%
25.00%
30.00%
35.00%
40.00%
45.00%
Gross Margin
Wolseley Tate & Lyle
year
percentage
fergusonplc.com & gurufocus.com
The diagram shows us the compression value of Gross profit margin for Wolsey and Tate &Lyle,
and we clearly see that Tate & Lyle has a higher percentage in the last 3-year trend. Whereas
both the company has not shown an indication of decline for this period.
The gross profitability of the Wolseley Company has increased comparatively from 28.90% to
around 29.40% in the trend period 2017-2019. However, it is important to note that the Tate &
Lyle Company on the other hand has a higher a consistent amount of profitability which was
around 38.10% in the year 2017, which has well increased to around 41.09% in the year 2019.
NET PROFIT RATIO (NPR)
Net Profit Ratio (NPR) express the relationship between Net Profit and
Revenue (net credit and cash sales) in terms of percentage. The ratio
is used to analyse the operational efficiency of the business. An
increase or higher net profit ratio shows a good efficiency of the
business and Vice Versa (Grewal 2016).
Net Profit Ratio
=
Net profit after tax x 100
Net Sales
FINANCIAL ANALYSIS6
2017 2018 2018
0.00%
2.00%
4.00%
6.00%
8.00%
10.00%
12.00%
4.52%
6.11%
5.03%
9.30% 9.78%
6.57%
Net Profi t Margin
Wolseley Tate & Lyle
year
percentage
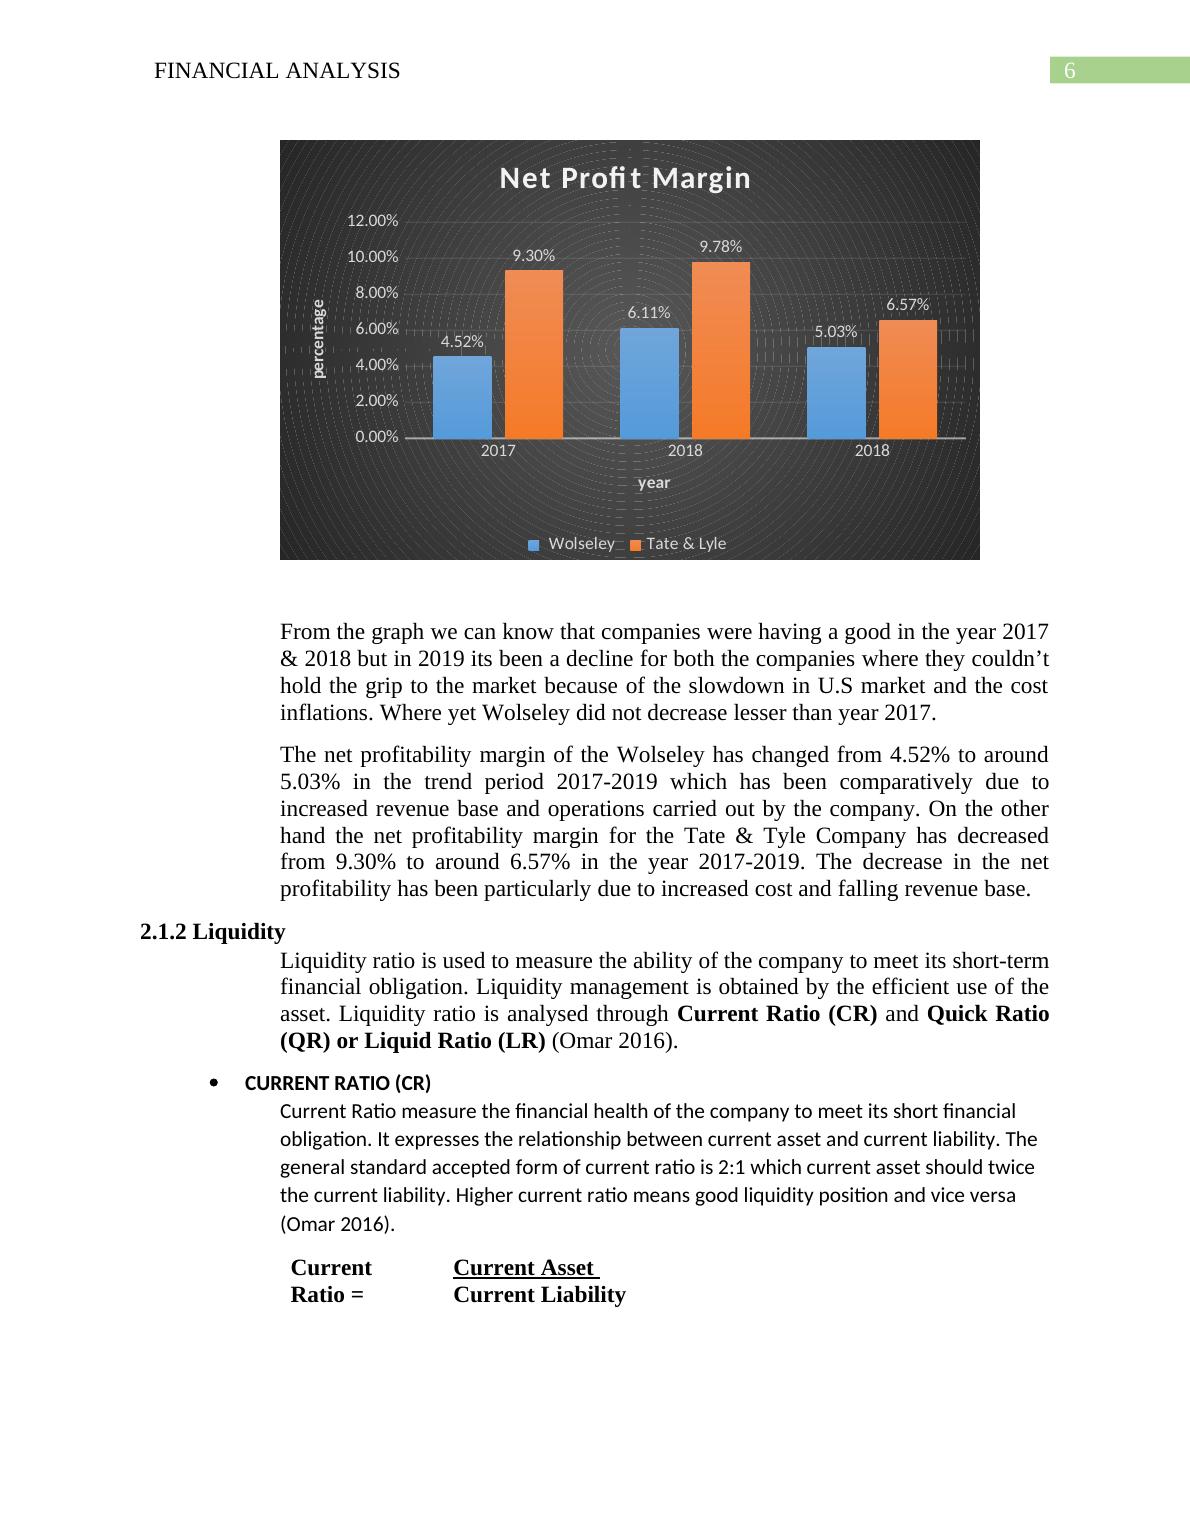
From the graph we can know that companies were having a good in the year 2017
& 2018 but in 2019 its been a decline for both the companies where they couldn’t
hold the grip to the market because of the slowdown in U.S market and the cost
inflations. Where yet Wolseley did not decrease lesser than year 2017.
The net profitability margin of the Wolseley has changed from 4.52% to around
5.03% in the trend period 2017-2019 which has been comparatively due to
increased revenue base and operations carried out by the company. On the other
hand the net profitability margin for the Tate & Tyle Company has decreased
from 9.30% to around 6.57% in the year 2017-2019. The decrease in the net
profitability has been particularly due to increased cost and falling revenue base.
2.1.2 Liquidity
Liquidity ratio is used to measure the ability of the company to meet its short-term
financial obligation. Liquidity management is obtained by the efficient use of the
asset. Liquidity ratio is analysed through Current Ratio (CR) and Quick Ratio
(QR) or Liquid Ratio (LR) (Omar 2016).
CURRENT RATIO (CR)
Current Ratio measure the financial health of the company to meet its
short financial obligation. It expresses the relationship between current
asset and current liability. The general standard accepted form of
current ratio is 2:1 which current asset should twice the current
liability. Higher current ratio means good liquidity position and vice
versa (Omar 2016).
Current
Ratio =
Current Asset
Current Liability
2017 2018 2018
0.00%
2.00%
4.00%
6.00%
8.00%
10.00%
12.00%
4.52%
6.11%
5.03%
9.30% 9.78%
6.57%
Net Profi t Margin
Wolseley Tate & Lyle
year
percentage
From the graph we can know that companies were having a good in the year 2017
& 2018 but in 2019 its been a decline for both the companies where they couldn’t
hold the grip to the market because of the slowdown in U.S market and the cost
inflations. Where yet Wolseley did not decrease lesser than year 2017.
The net profitability margin of the Wolseley has changed from 4.52% to around
5.03% in the trend period 2017-2019 which has been comparatively due to
increased revenue base and operations carried out by the company. On the other
hand the net profitability margin for the Tate & Tyle Company has decreased
from 9.30% to around 6.57% in the year 2017-2019. The decrease in the net
profitability has been particularly due to increased cost and falling revenue base.
2.1.2 Liquidity
Liquidity ratio is used to measure the ability of the company to meet its short-term
financial obligation. Liquidity management is obtained by the efficient use of the
asset. Liquidity ratio is analysed through Current Ratio (CR) and Quick Ratio
(QR) or Liquid Ratio (LR) (Omar 2016).
CURRENT RATIO (CR)
Current Ratio measure the financial health of the company to meet its
short financial obligation. It expresses the relationship between current
asset and current liability. The general standard accepted form of
current ratio is 2:1 which current asset should twice the current
liability. Higher current ratio means good liquidity position and vice
versa (Omar 2016).
Current
Ratio =
Current Asset
Current Liability
FINANCIAL ANALYSIS7
2017 2018 2019
0.00
0.50
1.00
1.50
2.00
2.50
1.43
1.61 1.71
2.10
2.31
1.61
Current Ratio
Wolsely Tate & Lyle
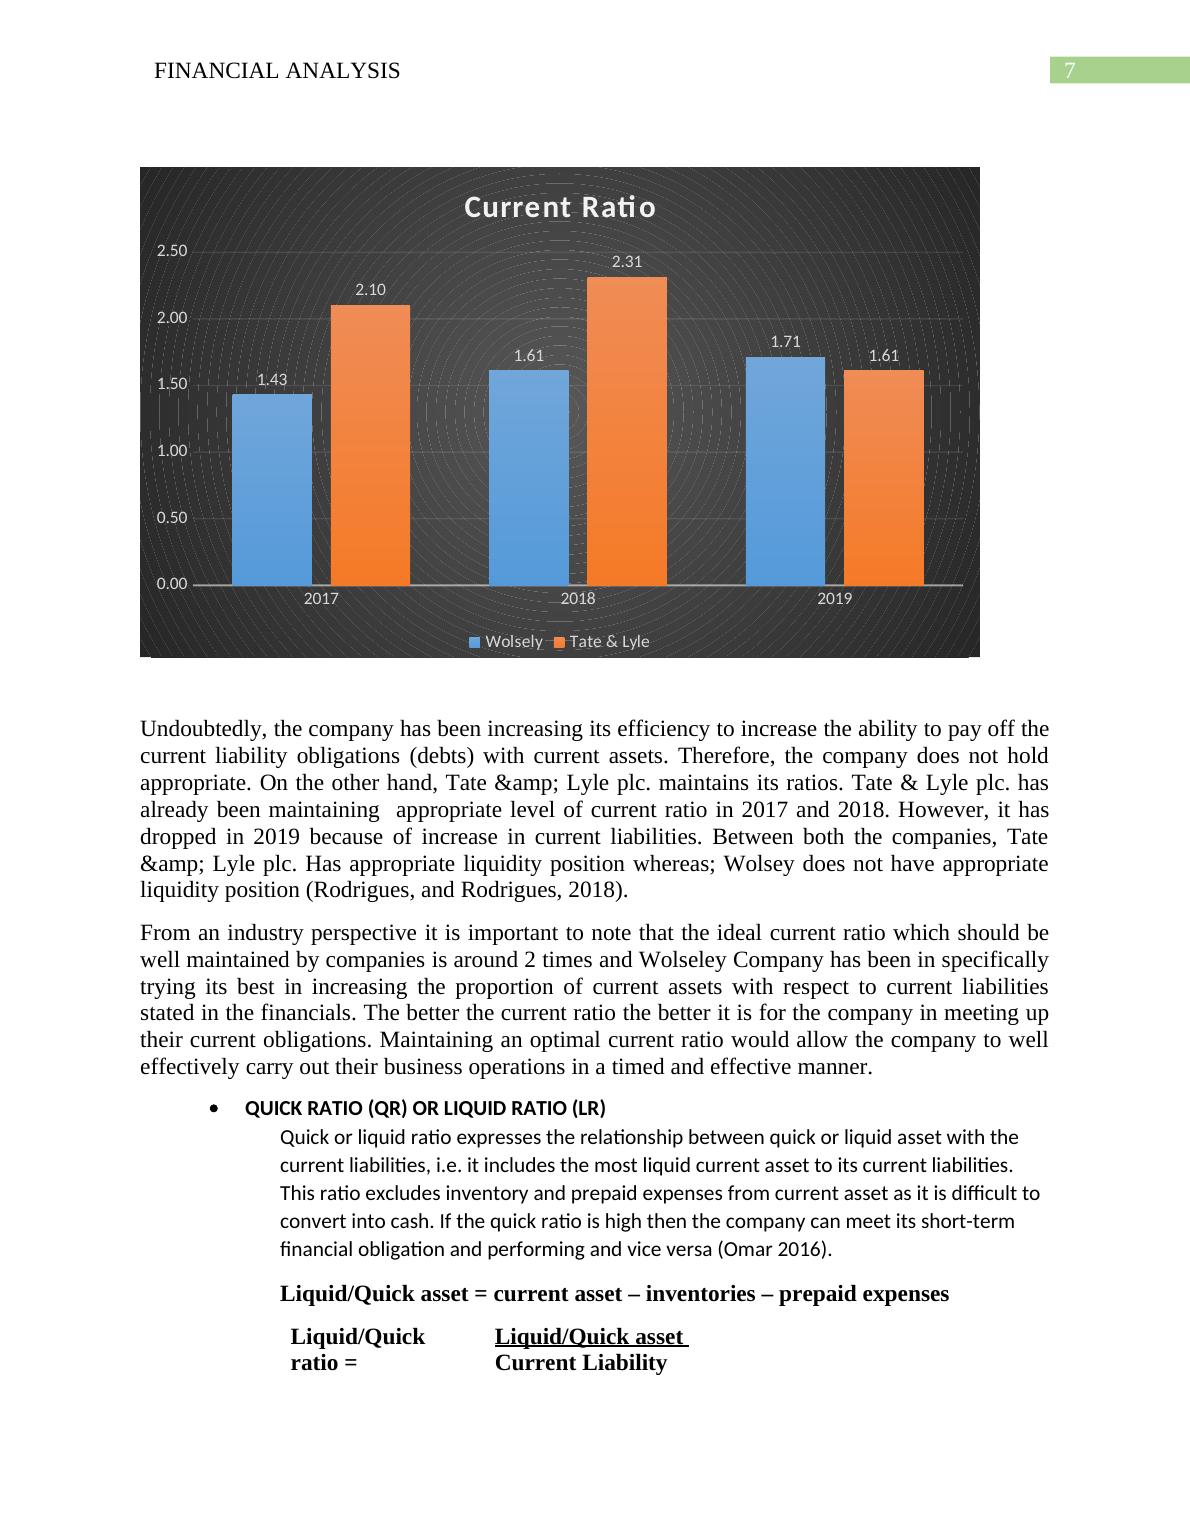
Undoubtedly, the company has been increasing its efficiency to increase the ability to pay off the
current liability obligations (debts) with current assets. Therefore, the company does not hold
appropriate. On the other hand, Tate & Lyle plc. maintains its ratios. Tate & Lyle plc. has
already been maintaining appropriate level of current ratio in 2017 and 2018. However, it has
dropped in 2019 because of increase in current liabilities. Between both the companies, Tate
& Lyle plc. Has appropriate liquidity position whereas; Wolsey does not have appropriate
liquidity position (Rodrigues, and Rodrigues, 2018).
From an industry perspective it is important to note that the ideal current ratio which should be
well maintained by companies is around 2 times and Wolseley Company has been in specifically
trying its best in increasing the proportion of current assets with respect to current liabilities
stated in the financials. The better the current ratio the better it is for the company in meeting up
their current obligations. Maintaining an optimal current ratio would allow the company to well
effectively carry out their business operations in a timed and effective manner.
QUICK RATIO (QR) OR LIQUID RATIO (LR)
Quick or liquid ratio expresses the relationship between quick or liquid
asset with the current liabilities, i.e. it includes the most liquid current
asset to its current liabilities. This ratio excludes inventory and
prepaid expenses from current asset as it is difficult to convert into
cash. If the quick ratio is high then the company can meet its short-
term financial obligation and performing and vice versa (Omar 2016).
Liquid/Quick asset = current asset – inventories – prepaid expenses
Liquid/Quick
ratio =
Liquid/Quick asset
Current Liability
2017 2018 2019
0.00
0.50
1.00
1.50
2.00
2.50
1.43
1.61 1.71
2.10
2.31
1.61
Current Ratio
Wolsely Tate & Lyle
Undoubtedly, the company has been increasing its efficiency to increase the ability to pay off the
current liability obligations (debts) with current assets. Therefore, the company does not hold
appropriate. On the other hand, Tate & Lyle plc. maintains its ratios. Tate & Lyle plc. has
already been maintaining appropriate level of current ratio in 2017 and 2018. However, it has
dropped in 2019 because of increase in current liabilities. Between both the companies, Tate
& Lyle plc. Has appropriate liquidity position whereas; Wolsey does not have appropriate
liquidity position (Rodrigues, and Rodrigues, 2018).
From an industry perspective it is important to note that the ideal current ratio which should be
well maintained by companies is around 2 times and Wolseley Company has been in specifically
trying its best in increasing the proportion of current assets with respect to current liabilities
stated in the financials. The better the current ratio the better it is for the company in meeting up
their current obligations. Maintaining an optimal current ratio would allow the company to well
effectively carry out their business operations in a timed and effective manner.
QUICK RATIO (QR) OR LIQUID RATIO (LR)
Quick or liquid ratio expresses the relationship between quick or liquid
asset with the current liabilities, i.e. it includes the most liquid current
asset to its current liabilities. This ratio excludes inventory and
prepaid expenses from current asset as it is difficult to convert into
cash. If the quick ratio is high then the company can meet its short-
term financial obligation and performing and vice versa (Omar 2016).
Liquid/Quick asset = current asset – inventories – prepaid expenses
Liquid/Quick
ratio =
Liquid/Quick asset
Current Liability
End of preview
Want to access all the pages? Upload your documents or become a member.
Related Documents
Overview of Strategic Financial Analysislg...
|20
|4417
|17
Strategic Financial Analysislg...
|55
|8602
|68
Strategic Financial Analysis TABLE OF CONTENTSlg...
|57
|13738
|400
Strategic Financial Analysis - Assignmentlg...
|32
|4920
|422
(DOC) Complete Strategic Finance Assignmentlg...
|46
|10766
|192
Financial Statements Analysis Processlg...
|25
|4694
|27