SWOT Analysis of Apple and Samsung
24 Pages5519 Words319 Views
Added on 2020-11-12
About This Document
FINANCIAL ANALYSIS MANAGEMENT AND ENTERPRISE INTRODUCTION 1 TASK 1(A)1 1.1: Comparing the financial performance and the position of both companies 1 TASK 1(B)10 SWOT Analysis of Samsung: 10 SWOT analysis of Apple:11 TASK 212 2.1: Critical analysis of CSR sections over the last couple of years 12 CONCLUSION 15 REFERENCES 16 APPENDIX 17 Income statement of Samsung 17 Balance sheet of Samsung 18 Income statement of Apple Plc.
SWOT Analysis of Apple and Samsung
Added on 2020-11-12
ShareRelated Documents
FINANCIAL ANALYSIS
MANAGEMENT AND
ENTERPRISE
MANAGEMENT AND
ENTERPRISE
Table of Contents
INTRODUCTION...........................................................................................................................1
TASK 1(A).......................................................................................................................................1
1.1: Comparing the financial performance and the position of both companies........................1
TASK 1(B).....................................................................................................................................10
SWOT Analysis of Samsung:...................................................................................................10
SWOT analysis of Apple:.........................................................................................................11
TASK 2..........................................................................................................................................12
2.1: Critical analysis of CSR sections over the last couple of years.........................................12
CONCLUSION..............................................................................................................................15
REFERENCES..............................................................................................................................16
APPENDIX....................................................................................................................................17
Income statement of Samsung..................................................................................................17
Balance sheet of Samsung ........................................................................................................18
Income statement of Apple Plc.................................................................................................20
Balance sheet of Apple Plc.......................................................................................................21
INTRODUCTION
Financial analysis management is the process which is related to evaluation of the
activities of business, its budgets and all of the finance related activities that are undertaken in
the organisation so that the managers of the company can analyse the profitability and
performance of the business. Financial analysis is the process that is related to analysing whether
the business organisation is operating in an stable, consistent, liquid, solvent or gainful enough
to invest in the monetary funds. The major purpose behind the financial analysis for an enterprise
is to find the issues that are faced by the company by comparing it with the past performances
and troubleshooting them. The analysis is performed by various method such as Ratio analysis of
the company and Vertical and horizontal analysis.
This project reports is prepared on the two major players in the telecommunication sector
namely Samsung and Apple. The analysis of their financial performance is done using ratio
analysis and by using charts and their strengths and weakness are also discussed here. Finally,
the project will tell which of the two companies have stronger financial grounds. The reports also
discusses the CSR activities undertaken by the companies.
TASK 1(A)
1.1: Comparing the financial performance and the position of both companies
Introduction to Samsung electronics company: Samsung electronics was established in
1969 which has grown rapidly. Now, this can be found that Samsung is currently managing 220
subsidiaries around the globe and is successfully generating a revenue of more than 200 Trillion
KRW per year. Samsung electronics is currently involved in the production of innovative
products and is making serious effort for the purpose of achieving continuous growth and
shaping the future of the consumers by doing continuous Innovations and modifications in the
products which they manufacture. Samsung electronics is currently engaged in providing
consumer products such as printers, monitors, televisions, Refrigerators, Air conditioners, and
the most important technology of the modern world which is Tablets and smartphones. Samsung
main vision behind the manufacturing of its products and services is to create value, generate
convenience and encouraging a smart and fast lifestyle for its consumers around the world
(Arena, 2011).
1
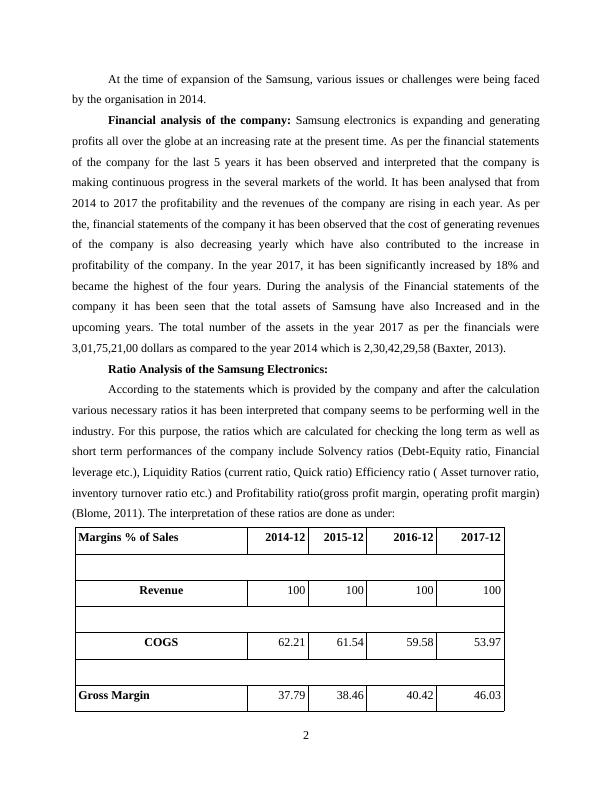
At the time of expansion of the Samsung, various issues or challenges were being faced
by the organisation in 2014.
Financial analysis of the company: Samsung electronics is expanding and generating
profits all over the globe at an increasing rate at the present time. As per the financial statements
of the company for the last 5 years it has been observed and interpreted that the company is
making continuous progress in the several markets of the world. It has been analysed that from
2014 to 2017 the profitability and the revenues of the company are rising in each year. As per
the, financial statements of the company it has been observed that the cost of generating revenues
of the company is also decreasing yearly which have also contributed to the increase in
profitability of the company. In the year 2017, it has been significantly increased by 18% and
became the highest of the four years. During the analysis of the Financial statements of the
company it has been seen that the total assets of Samsung have also Increased and in the
upcoming years. The total number of the assets in the year 2017 as per the financials were
3,01,75,21,00 dollars as compared to the year 2014 which is 2,30,42,29,58 (Baxter, 2013).
Ratio Analysis of the Samsung Electronics:
According to the statements which is provided by the company and after the calculation
various necessary ratios it has been interpreted that company seems to be performing well in the
industry. For this purpose, the ratios which are calculated for checking the long term as well as
short term performances of the company include Solvency ratios (Debt-Equity ratio, Financial
leverage etc.), Liquidity Ratios (current ratio, Quick ratio) Efficiency ratio ( Asset turnover ratio,
inventory turnover ratio etc.) and Profitability ratio(gross profit margin, operating profit margin)
(Blome, 2011). The interpretation of these ratios are done as under:
Margins % of Sales 2014-12 2015-12 2016-12 2017-12
Revenue 100 100 100 100
COGS 62.21 61.54 59.58 53.97
Gross Margin 37.79 38.46 40.42 46.03
2
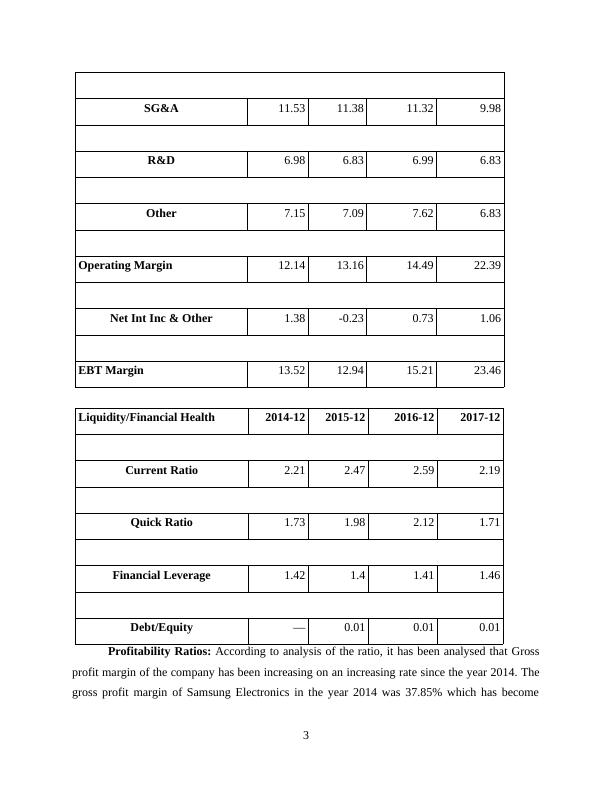
SG&A 11.53 11.38 11.32 9.98
R&D 6.98 6.83 6.99 6.83
Other 7.15 7.09 7.62 6.83
Operating Margin 12.14 13.16 14.49 22.39
Net Int Inc & Other 1.38 -0.23 0.73 1.06
EBT Margin 13.52 12.94 15.21 23.46
Liquidity/Financial Health 2014-12 2015-12 2016-12 2017-12
Current Ratio 2.21 2.47 2.59 2.19
Quick Ratio 1.73 1.98 2.12 1.71
Financial Leverage 1.42 1.4 1.41 1.46
Debt/Equity — 0.01 0.01 0.01
Profitability Ratios: According to analysis of the ratio, it has been analysed that Gross
profit margin of the company has been increasing on an increasing rate since the year 2014. The
gross profit margin of Samsung Electronics in the year 2014 was 37.85% which has become
3
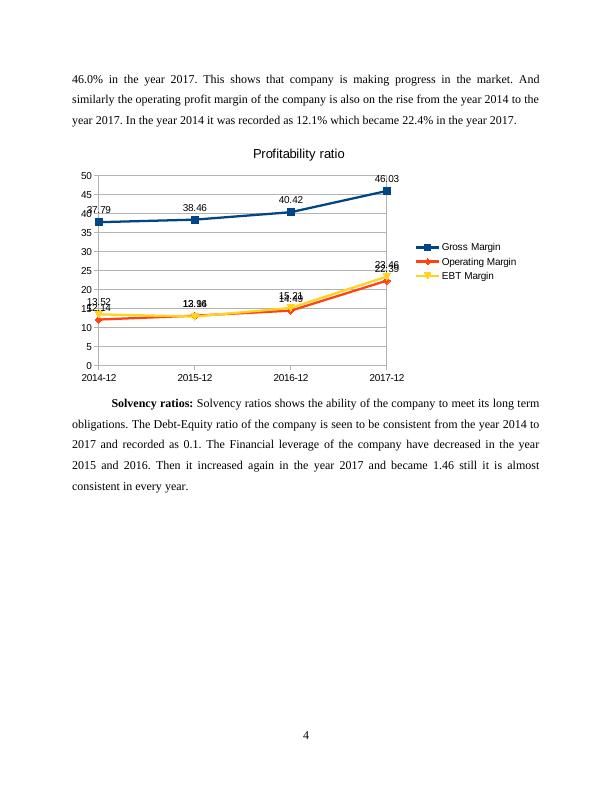
46.0% in the year 2017. This shows that company is making progress in the market. And
similarly the operating profit margin of the company is also on the rise from the year 2014 to the
year 2017. In the year 2014 it was recorded as 12.1% which became 22.4% in the year 2017.
2014-12 2015-12 2016-12 2017-12
0
5
10
15
20
25
30
35
40
45
50
37.79 38.46 40.42
46.03
12.14 13.16 14.49
22.39
13.52 12.94 15.21
23.46
Profitability ratio
Gross Margin
Operating Margin
EBT Margin
Solvency ratios: Solvency ratios shows the ability of the company to meet its long term
obligations. The Debt-Equity ratio of the company is seen to be consistent from the year 2014 to
2017 and recorded as 0.1. The Financial leverage of the company have decreased in the year
2015 and 2016. Then it increased again in the year 2017 and became 1.46 still it is almost
consistent in every year.
4
End of preview
Want to access all the pages? Upload your documents or become a member.
Related Documents
Financial Analysis Managament and Enterpriselg...
|18
|4870
|436
Financial Analysis of Samsung and Applelg...
|22
|4606
|499
Financial Performance & Analysis of Apple & Samsung Research Paper 2022lg...
|20
|2927
|23
Financial Analysis Management & Entrepreneurship (pdf)lg...
|12
|3405
|473
Financial Analysis Samsung Electronicslg...
|21
|3948
|433
Financial Analysis Management & Entrepreneurship- FAMElg...
|20
|3807
|488