Financial Analysis Samsung Electronics
21 Pages3948 Words433 Views
Added on 2020-10-22
Financial Analysis Samsung Electronics
Added on 2020-10-22
ShareRelated Documents
Financial AnalysisManagement & Enterprise
Table of ContentsINTRODUCTION...........................................................................................................................1TASK 1(A).......................................................................................................................................11.1: Comparison of financial Performance and Financial position of given companies........1Horizontal analyses of Samsung Electronics:........................................................................6Vertical analyses of Samsung Electronics:............................................................................6Horizontal analyses of Apple:..............................................................................................10Vertical analyses of Apple: ................................................................................................10TASK 2..........................................................................................................................................112.1: Critical analysis of CSR sections over the last couple of years....................................11CONCLUSION..............................................................................................................................13REFERENCES..............................................................................................................................15APPENDIX....................................................................................................................................16
INTRODUCTIONFinancial analyses is the process of evaluating business statements of an organisationwhich helps in ascertaining a true and fair position of a company. In this project report, financialanalyses of two companies are conducted which are Apple Inc. and Samsung electronics. Boththe companies are engaged in manufacturing electronics such as smartphones, tablets etc. Due tothe competitive environment between these two companies, various analyses are conducted.Ratio analyses is performed to ascertain various profitability and liquidity of the companies.Horizontal analyses is performed to determine most challenging year by considering a period asthe base year and vertical analyses is performed to evaluate most challenging and profitable yearby calculating percentages of various costs and incomes involved in the organisation. In this project report, various financial analyses of above mentioned companies areconducted in order to evaluate strengths and weaknesses of both the companies.TASK 1(A)1.1: Comparison of financial Performance and Financial position of given companiesSamsung company: Samsung is a multinational company which deals mainly in electronics, textiles,insurance etc. and has headquarters in Seoul. Founded in 1938. Samsung electronics is atelecommunication company which has 220 subsidiaries which generates annual revenue ofaround 220 trillion euros. Product range of Samsung includes printers, computers, smartphones,televisions, refrigerators, tablets, air conditioners and many more. The mission of this companyis to produce innovative products which can improve standard of living of their consumers.Samsung has the major market share in the field of smartphones along with which it isconsidered as the world's largest manufacturer of television. The new vision statement ofSamsung electronics is “Inspire the world, create the future” which focuses on growing theirstrengths such as new technology and innovative products (Chapman, 2011).Ratio analysis of Samsung Electronics:Ratio analyses is a tool which is used to analyse financial position of an organisation.Here, ratio analyses of Samsung is conducted in order to identify their profitability, solvency andliquidity so that a true and fair picture can be framed. Various ratios with their interpretations arediscussed below: 1
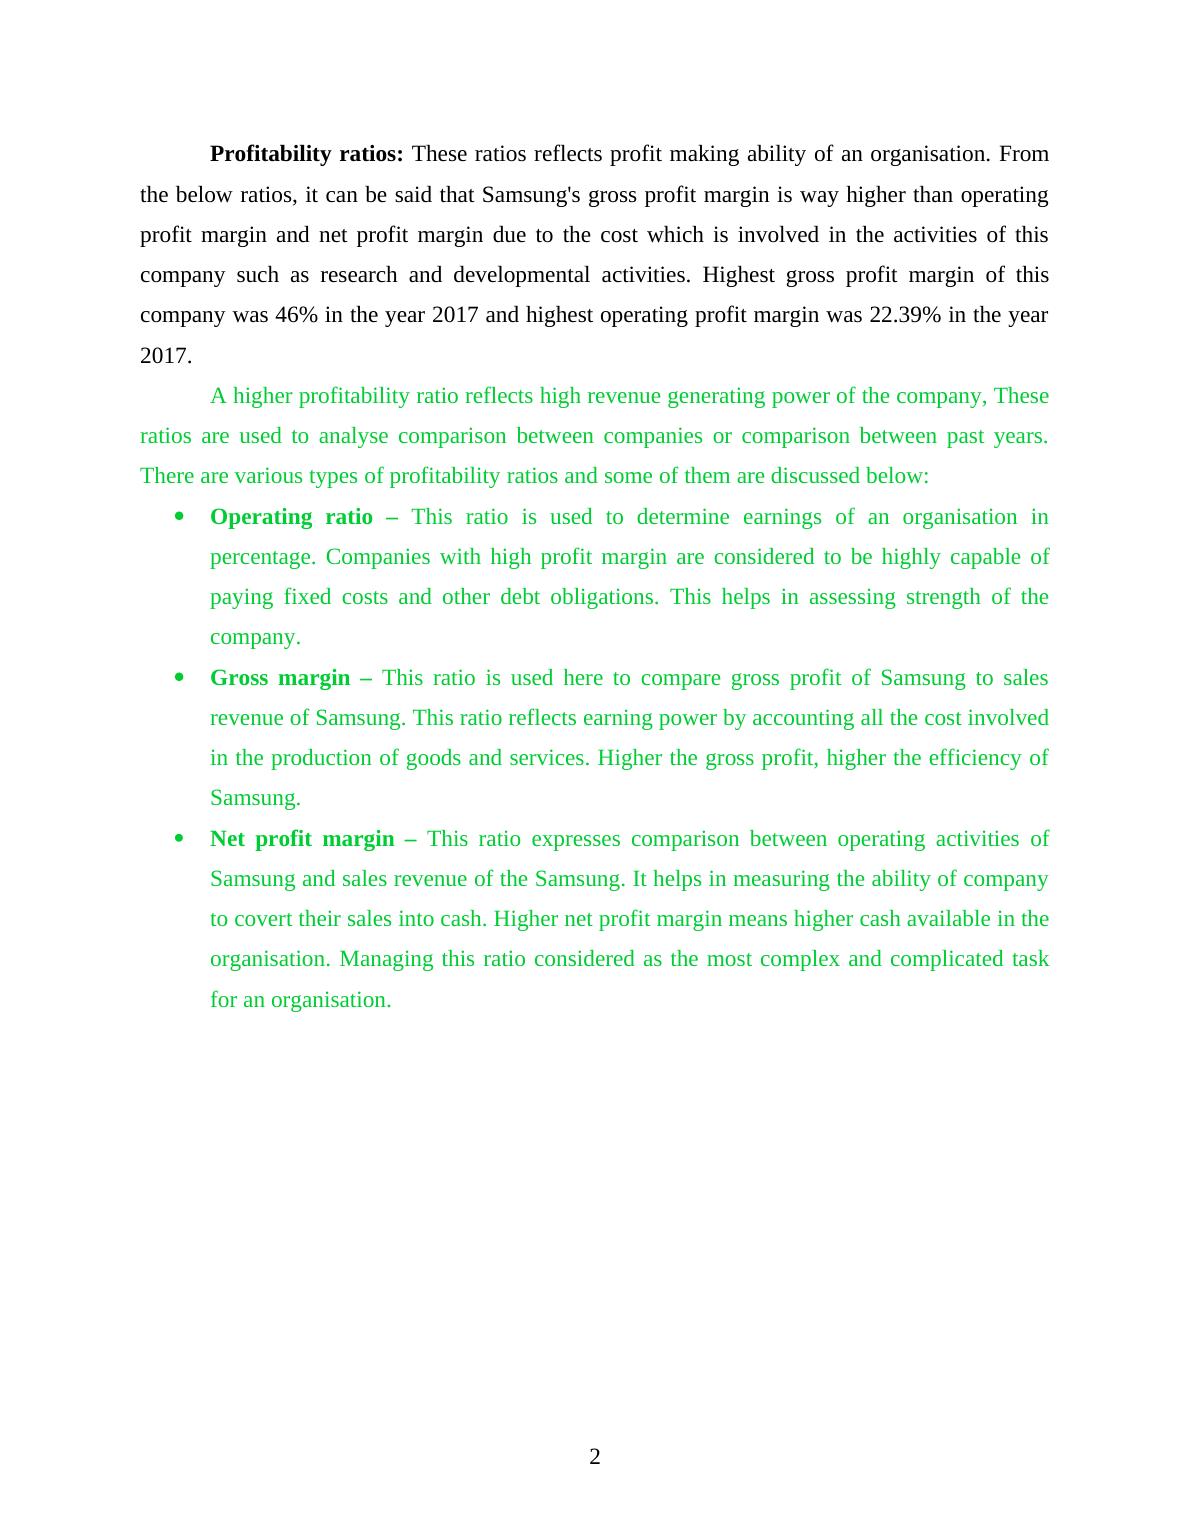
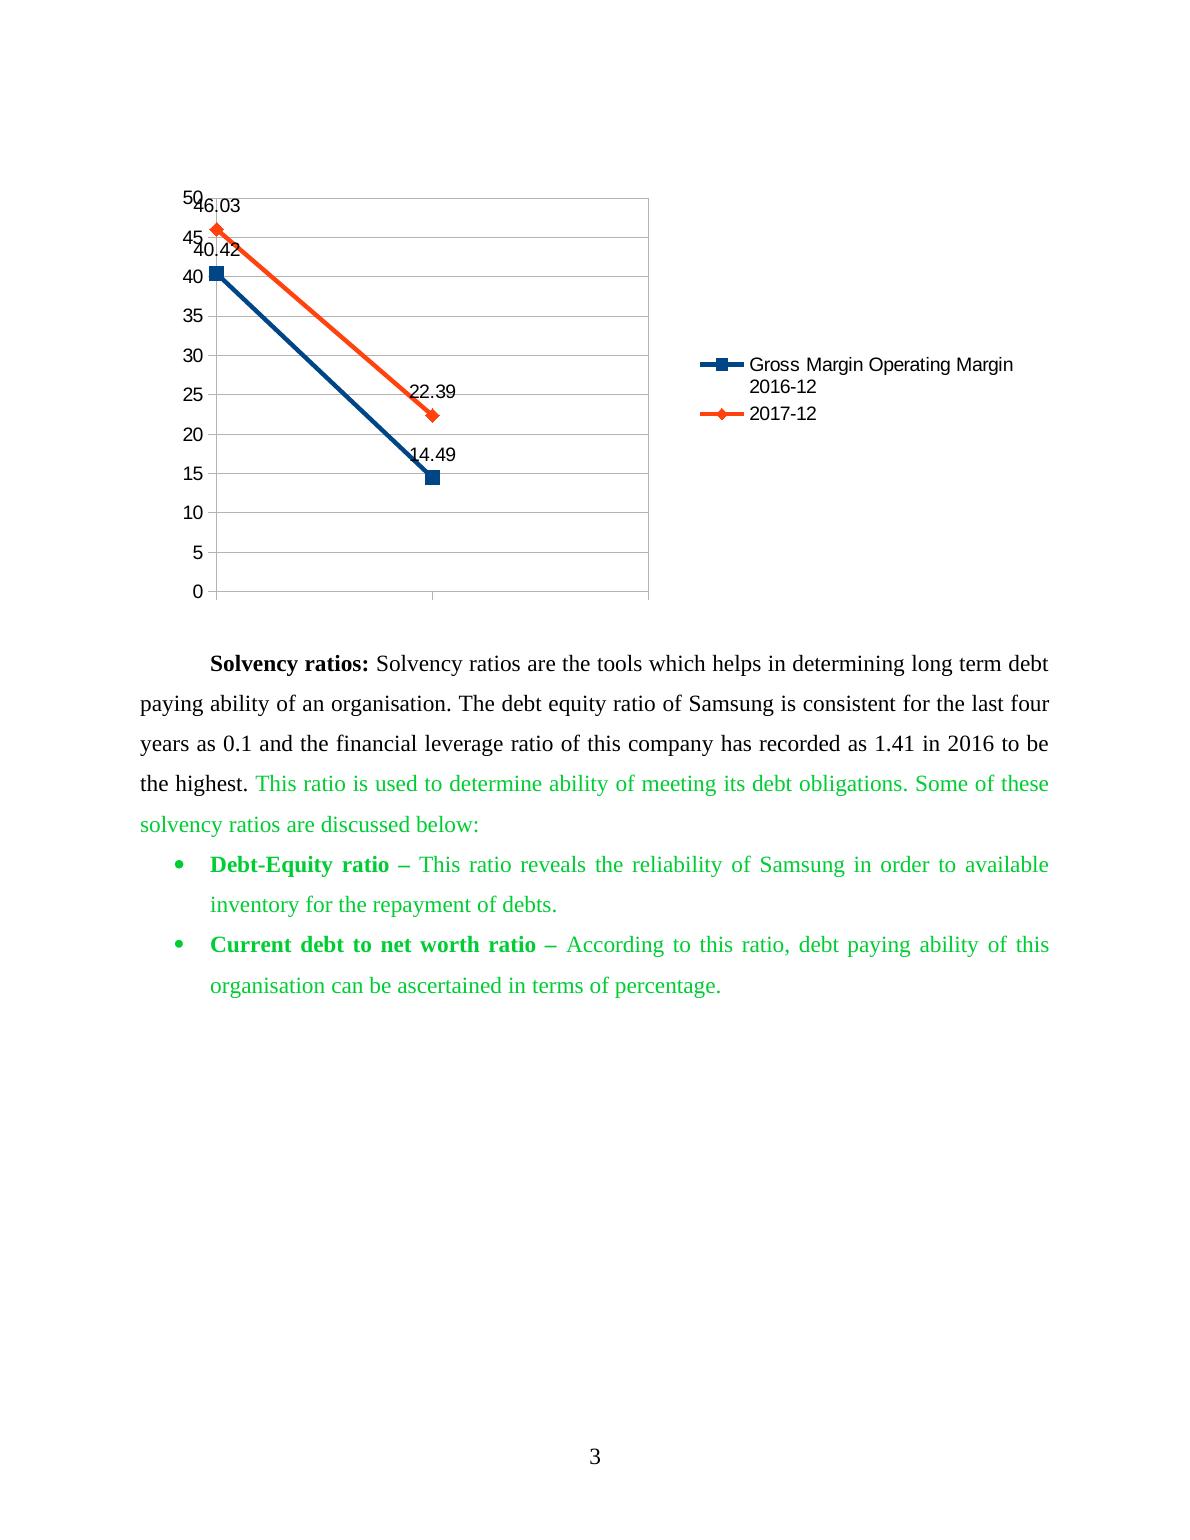
Profitability ratios: These ratios reflects profit making ability of an organisation. Fromthe below ratios, it can be said that Samsung's gross profit margin is way higher than operatingprofit margin and net profit margin due to the cost which is involved in the activities of thiscompany such as research and developmental activities. Highest gross profit margin of thiscompany was 46% in the year 2017 and highest operating profit margin was 22.39% in the year2017. A higher profitability ratio reflects high revenue generating power of the company, Theseratios are used to analyse comparison between companies or comparison between past years.There are various types of profitability ratios and some of them are discussed below:Operating ratio – This ratio is used to determine earnings of an organisation inpercentage. Companies with high profit margin are considered to be highly capable ofpaying fixed costs and other debt obligations. This helps in assessing strength of thecompany.Gross margin – This ratio is used here to compare gross profit of Samsung to salesrevenue of Samsung. This ratio reflects earning power by accounting all the cost involvedin the production of goods and services. Higher the gross profit, higher the efficiency ofSamsung.Net profit margin – This ratio expresses comparison between operating activities ofSamsung and sales revenue of the Samsung. It helps in measuring the ability of companyto covert their sales into cash. Higher net profit margin means higher cash available in theorganisation. Managing this ratio considered as the most complex and complicated taskfor an organisation.2
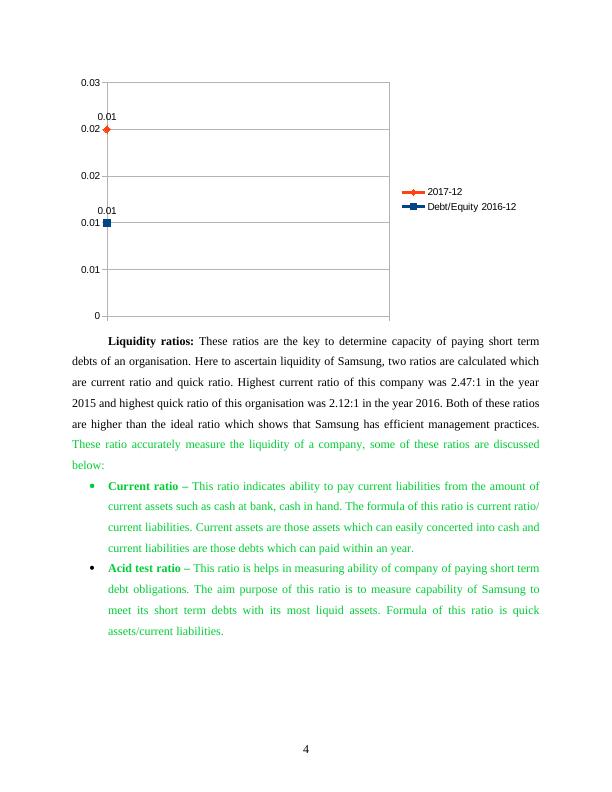
0510152025303540455040.4214.4946.0322.39Gross Margin Operating Margin 2016-122017-12Solvency ratios: Solvency ratios are the tools which helps in determining long term debtpaying ability of an organisation. The debt equity ratio of Samsung is consistent for the last fouryears as 0.1 and the financial leverage ratio of this company has recorded as 1.41 in 2016 to bethe highest. This ratio is used to determine ability of meeting its debt obligations. Some of thesesolvency ratios are discussed below:Debt-Equity ratio – This ratio reveals the reliability of Samsung in order to availableinventory for the repayment of debts.Current debt to net worth ratio – According to this ratio, debt paying ability of thisorganisation can be ascertained in terms of percentage.3
00.010.010.020.020.030.010.012017-12Debt/Equity 2016-12Liquidity ratios: These ratios are the key to determine capacity of paying short termdebts of an organisation. Here to ascertain liquidity of Samsung, two ratios are calculated whichare current ratio and quick ratio. Highest current ratio of this company was 2.47:1 in the year2015 and highest quick ratio of this organisation was 2.12:1 in the year 2016. Both of these ratiosare higher than the ideal ratio which shows that Samsung has efficient management practices.These ratio accurately measure the liquidity of a company, some of these ratios are discussedbelow:Current ratio – This ratio indicates ability to pay current liabilities from the amount ofcurrent assets such as cash at bank, cash in hand. The formula of this ratio is current ratio/current liabilities. Current assets are those assets which can easily concerted into cash andcurrent liabilities are those debts which can paid within an year. Acid test ratio – This ratio is helps in measuring ability of company of paying short termdebt obligations. The aim purpose of this ratio is to measure capability of Samsung tomeet its short term debts with its most liquid assets. Formula of this ratio is quickassets/current liabilities.4
End of preview
Want to access all the pages? Upload your documents or become a member.
Related Documents
Financial Analysis Management and Enterpriseslg...
|15
|3955
|373
Financial Analysis Management & Enterprise PDFlg...
|14
|3378
|281
SWOT Analysis of Apple and Samsunglg...
|24
|5519
|319
Financial Analysis Managament and Enterpriselg...
|18
|4870
|436
Financial Analysis of Samsung and Applelg...
|22
|4606
|499
Financial Analysis Management - Apple and Samsunglg...
|42
|5846
|362