Financial Analysis Management - Apple and Samsung
42 Pages5846 Words362 Views
Added on 2020-10-22
Financial Analysis Management - Apple and Samsung
Added on 2020-10-22
ShareRelated Documents
Financial Analysis Management
And
Entrepreneurship
And
Entrepreneurship
TABLE OF CONTENTS
INTRODUCTION........................................................................................................................................................................................................3
Comparing and contrasting financial performance of Apple & Samsung over the period of four years.................................................................3
Presenting CSR activities of Apple and Samsung with respect to last couple of years.........................................................................................24
CONCLUSION..........................................................................................................................................................................................................27
REFERENCES...........................................................................................................................................................................................................28
APPENDIX................................................................................................................................................................................................................30
1. Ratio analysis of Apple......................................................................................................................................................................................30
2. Ratio analysis of Samsung.................................................................................................................................................................................32
3. Horizontal analysis of Apple..............................................................................................................................................................................34
4. Vertical analysis of Apple..................................................................................................................................................................................39
INTRODUCTION
Financial management implies for the activities undertaken by the organization for making optimum use of monetary resources. In the
business unit, manager develops competent financial strategic as well as policy framework and thereby make contribution in the achievement of
organizational goals. Further, financial analysis refers to evaluation of final accounts which in turn present the extent to which company is
performing well. Financial analysis report is highly significant which in turn provides stakeholders with valuable framework for decision
making. The present report is based on Apple and Samsung which falls into the category of leading units within electronics market. This report
will provide deeper insight about financial performance and position of Apple as well as Samsung pertaining to the period of four years. It
depicts how ratio analysis tool can be used for analyzing financial performance of the company. Along with this, it also reflects CSR initiatives
undertaken by such companies in previous years.
Comparing and contrasting financial performance of Apple & Samsung over the period of four years
Ratio analysis is served as a quantitative tool which furnishes information about company’s performance as well as position from several
perspectives. It includes profitability, liquidity, solvency and efficiency which in turn assists company as well as its stakeholders in developing
competent framework (Setiawan and Amboningtyas, 2018).
Ratio analysis of Apple and Samsung: A comparative analysis
Profitability ratio analysis
GP ratio
Gross profit / net sales * 100 (Mohanram, Saiy and Vyas, 2018)
Years Apple Samsung
2014 38.59% 37.79%
2015 40.06% 38.46%
2016 39.08% 40.42%
2017 38.47% 46.03%
2014 2015 2016 2017
0.00%
5.00%
10.00%
15.00%
20.00%
25.00%
30.00%
35.00%
40.00%
45.00%
50.00%
Apple
Samsung
2014 38.59% 37.79%
2015 40.06% 38.46%
2016 39.08% 40.42%
2017 38.47% 46.03%
2014 2015 2016 2017
0.00%
5.00%
10.00%
15.00%
20.00%
25.00%
30.00%
35.00%
40.00%
45.00%
50.00%
Apple
Samsung
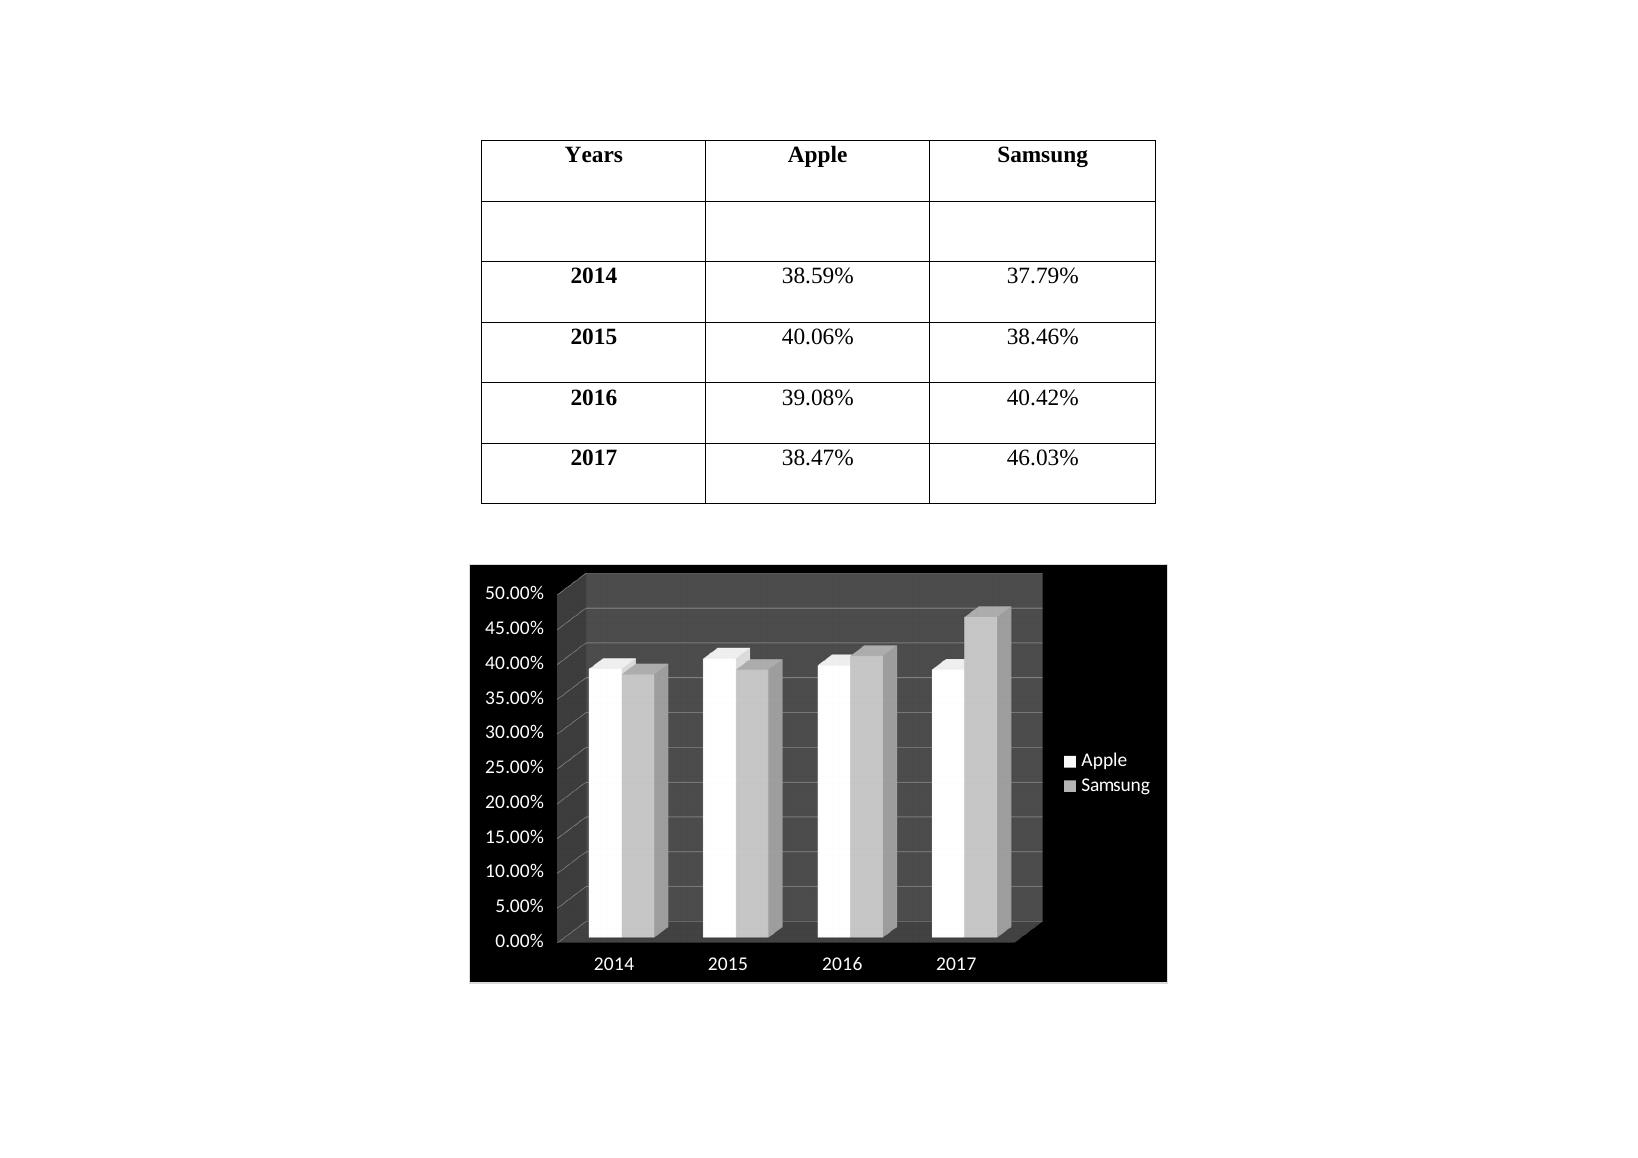
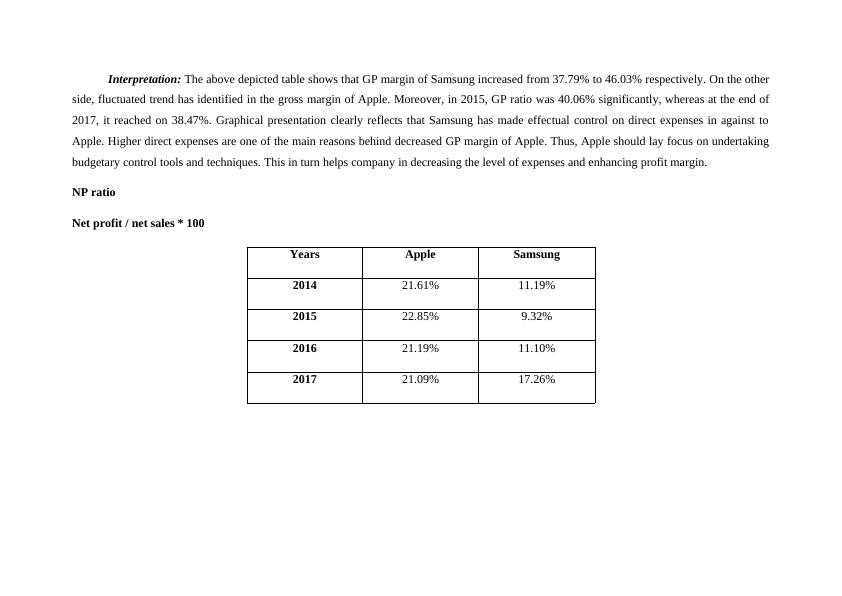
Interpretation: The above depicted table shows that GP margin of Samsung increased from 37.79% to 46.03% respectively. On the other
side, fluctuated trend has identified in the gross margin of Apple. Moreover, in 2015, GP ratio was 40.06% significantly, whereas at the end of
2017, it reached on 38.47%. Graphical presentation clearly reflects that Samsung has made effectual control on direct expenses in against to
Apple. Higher direct expenses are one of the main reasons behind decreased GP margin of Apple. Thus, Apple should lay focus on undertaking
budgetary control tools and techniques. This in turn helps company in decreasing the level of expenses and enhancing profit margin.
NP ratio
Net profit / net sales * 100
Years Apple Samsung
2014 21.61% 11.19%
2015 22.85% 9.32%
2016 21.19% 11.10%
2017 21.09% 17.26%
2014 2015 2016 2017
0.00%
5.00%
10.00%
15.00%
20.00%
25.00%
Apple
Samsung
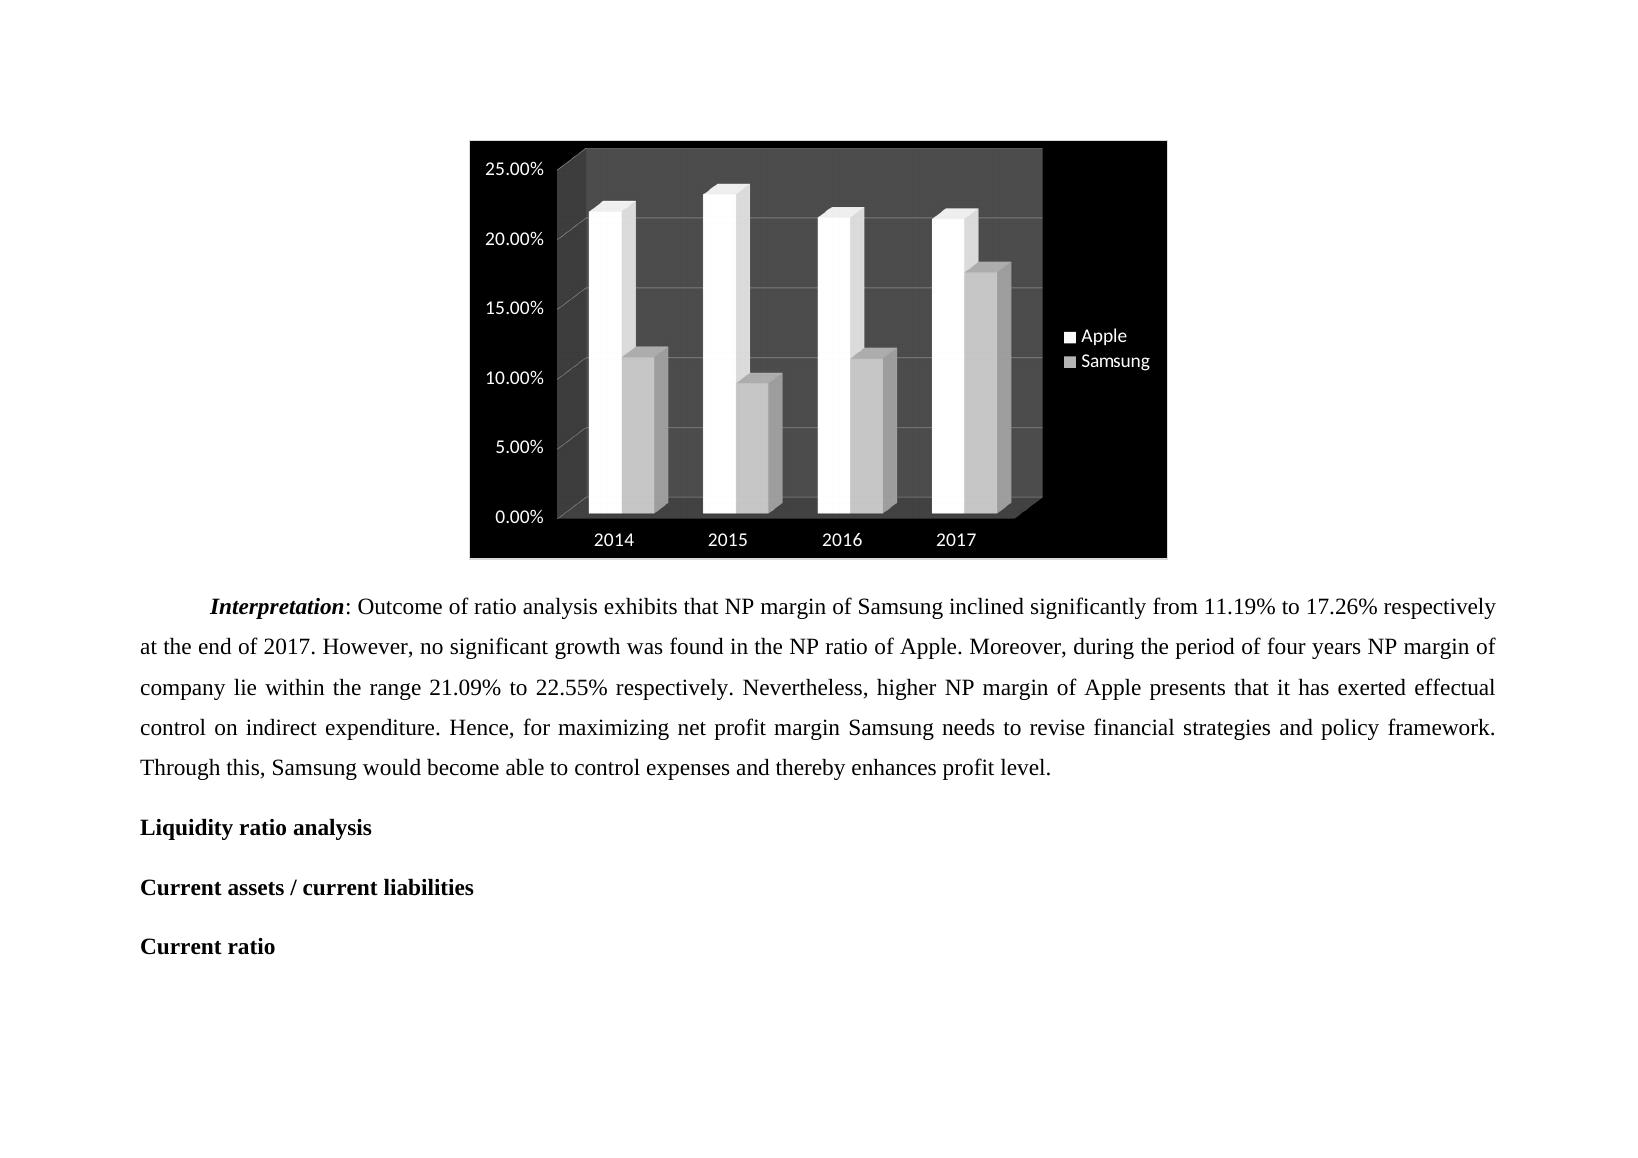
Interpretation: Outcome of ratio analysis exhibits that NP margin of Samsung inclined significantly from 11.19% to 17.26% respectively
at the end of 2017. However, no significant growth was found in the NP ratio of Apple. Moreover, during the period of four years NP margin of
company lie within the range 21.09% to 22.55% respectively. Nevertheless, higher NP margin of Apple presents that it has exerted effectual
control on indirect expenditure. Hence, for maximizing net profit margin Samsung needs to revise financial strategies and policy framework.
Through this, Samsung would become able to control expenses and thereby enhances profit level.
Liquidity ratio analysis
Current assets / current liabilities
Current ratio
0.00%
5.00%
10.00%
15.00%
20.00%
25.00%
Apple
Samsung
Interpretation: Outcome of ratio analysis exhibits that NP margin of Samsung inclined significantly from 11.19% to 17.26% respectively
at the end of 2017. However, no significant growth was found in the NP ratio of Apple. Moreover, during the period of four years NP margin of
company lie within the range 21.09% to 22.55% respectively. Nevertheless, higher NP margin of Apple presents that it has exerted effectual
control on indirect expenditure. Hence, for maximizing net profit margin Samsung needs to revise financial strategies and policy framework.
Through this, Samsung would become able to control expenses and thereby enhances profit level.
Liquidity ratio analysis
Current assets / current liabilities
Current ratio
Years Apple Samsung
2014 1.08 2.21
2015 1.11 2.47
2016 1.35 2.59
2017 1.28 2.19
2014 2015 2016 2017
0
0.5
1
1.5
2
2.5
3
1.08 1.11
1.35 1.28
2.21
2.47 2.59
2.19
Apple
Samsung
2014 1.08 2.21
2015 1.11 2.47
2016 1.35 2.59
2017 1.28 2.19
2014 2015 2016 2017
0
0.5
1
1.5
2
2.5
3
1.08 1.11
1.35 1.28
2.21
2.47 2.59
2.19
Apple
Samsung
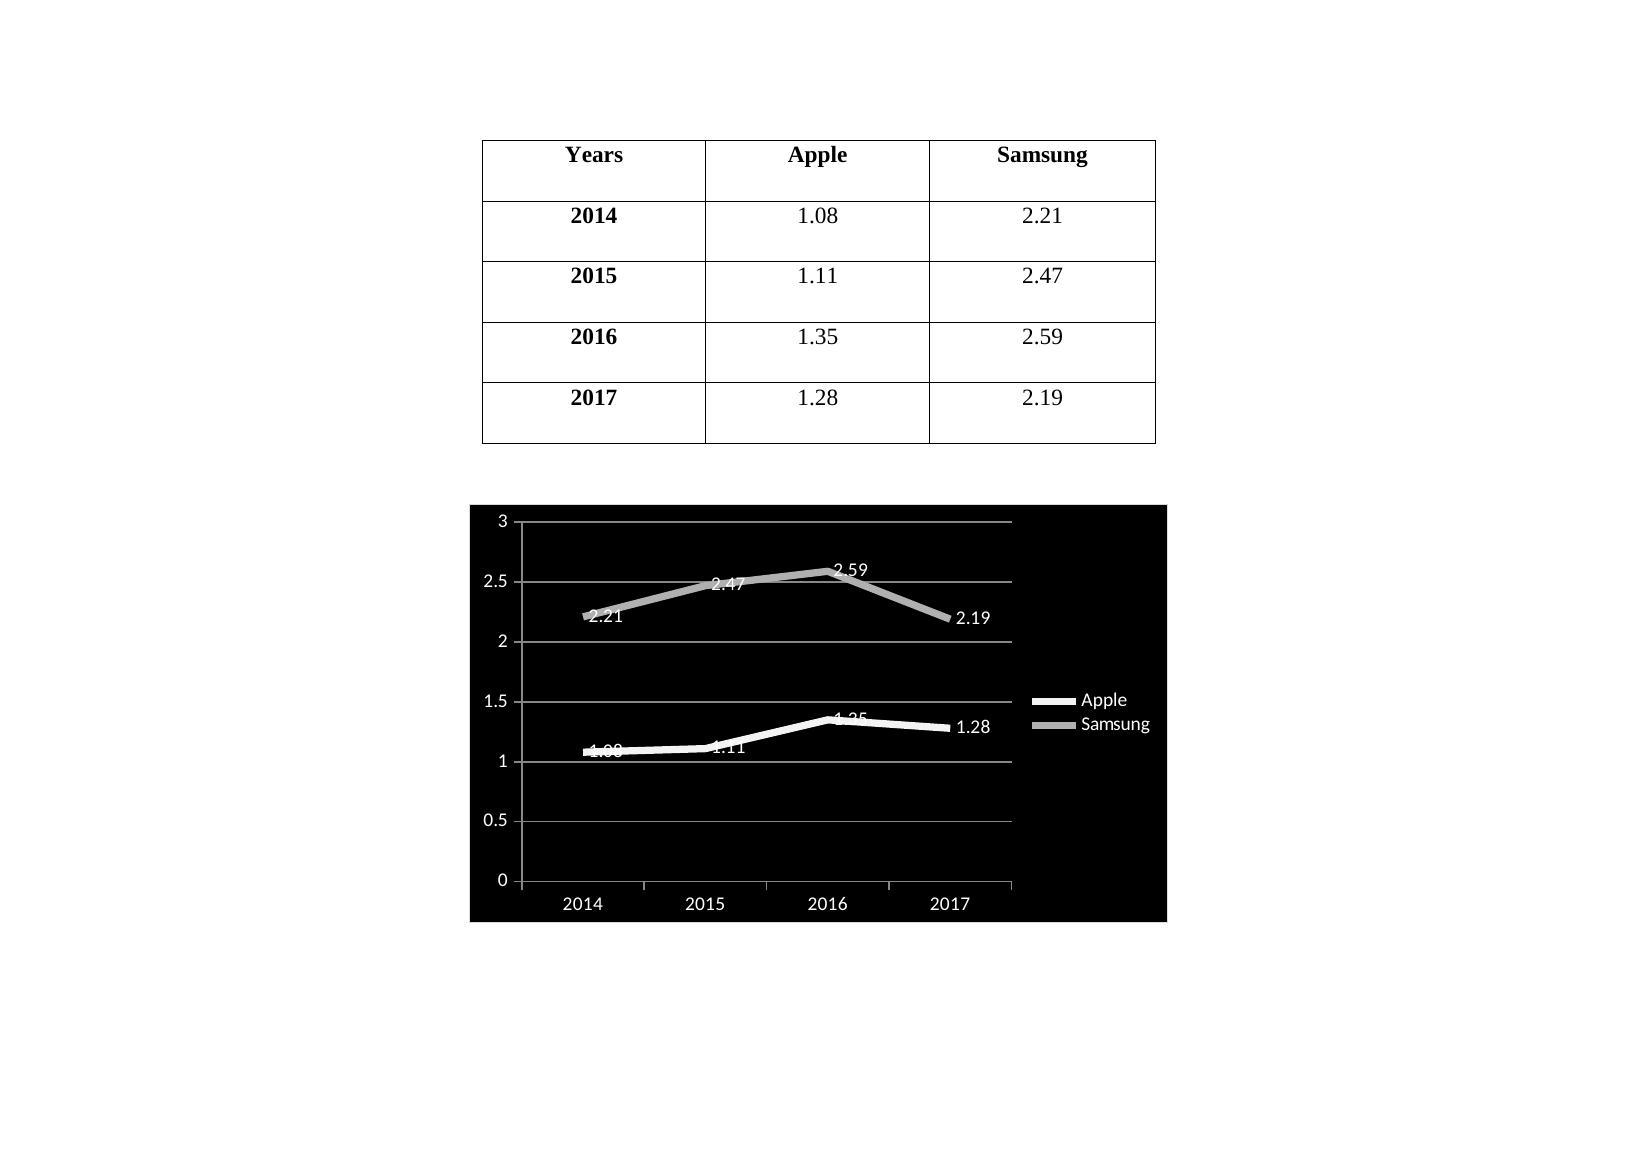
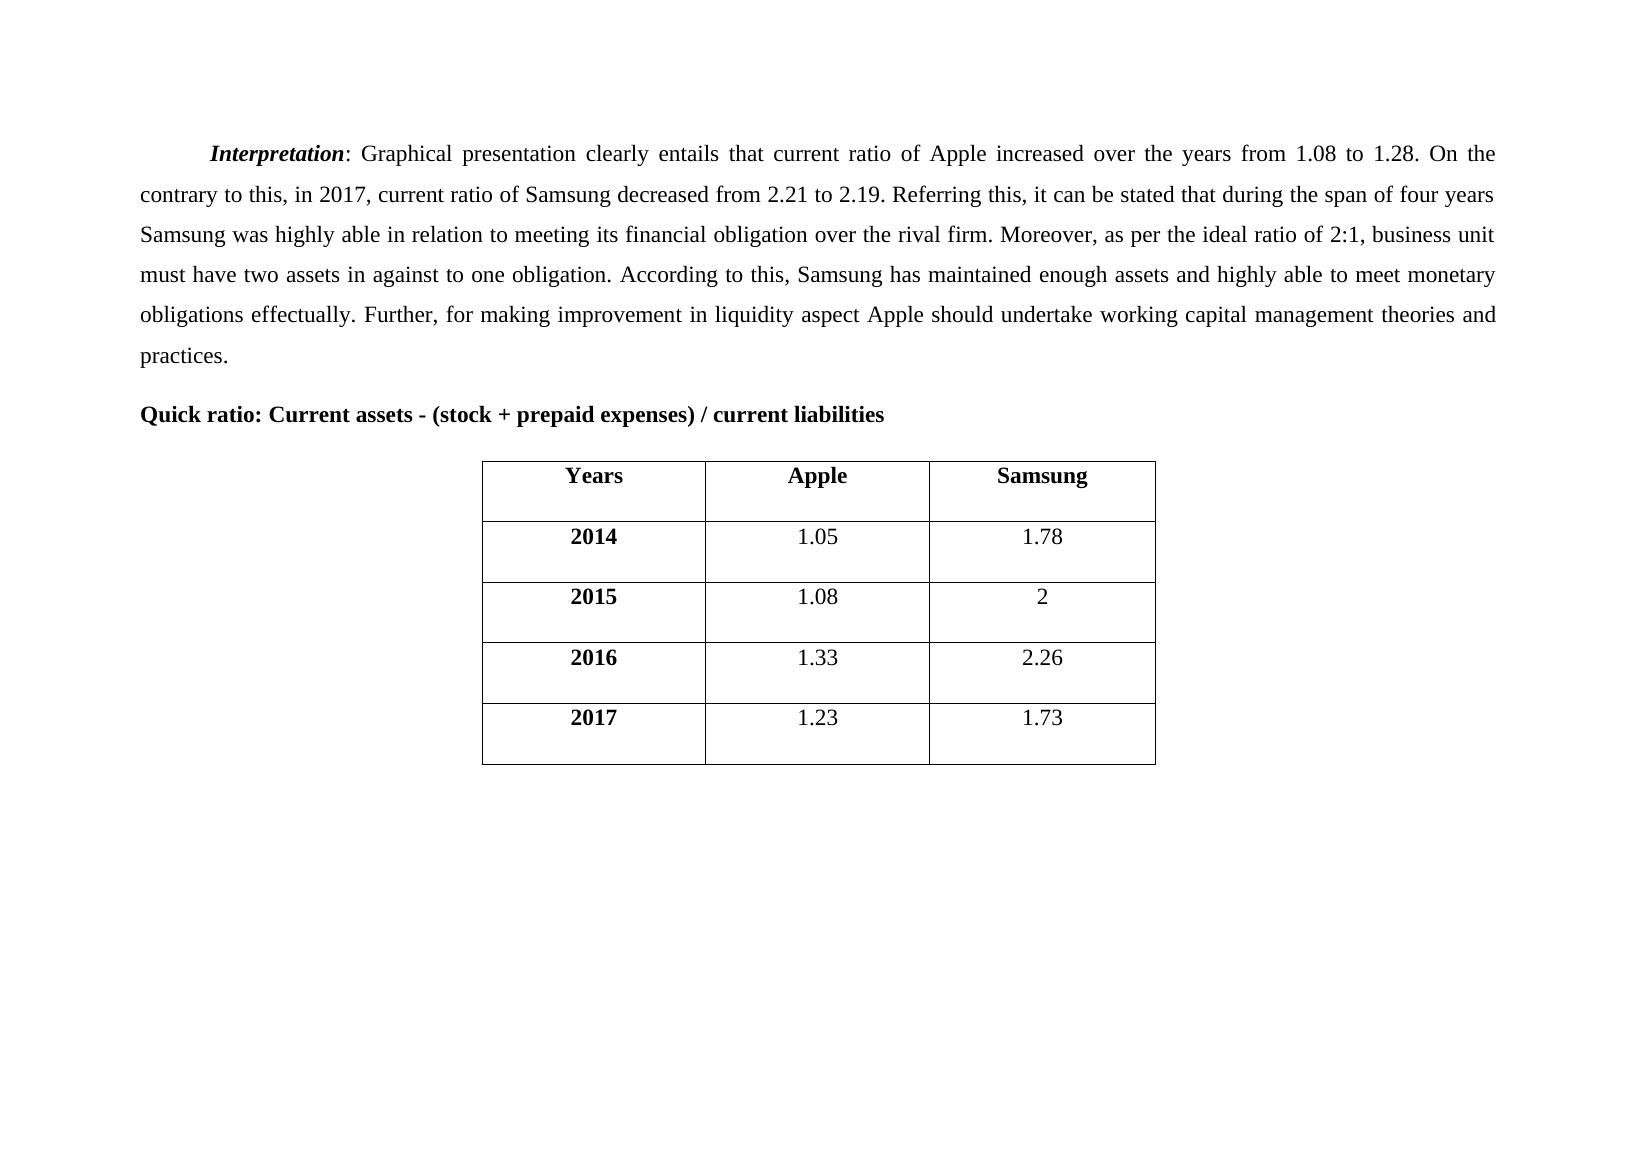
Interpretation: Graphical presentation clearly entails that current ratio of Apple increased over the years from 1.08 to 1.28. On the
contrary to this, in 2017, current ratio of Samsung decreased from 2.21 to 2.19. Referring this, it can be stated that during the span of four years
Samsung was highly able in relation to meeting its financial obligation over the rival firm. Moreover, as per the ideal ratio of 2:1, business unit
must have two assets in against to one obligation. According to this, Samsung has maintained enough assets and highly able to meet monetary
obligations effectually. Further, for making improvement in liquidity aspect Apple should undertake working capital management theories and
practices.
Quick ratio: Current assets - (stock + prepaid expenses) / current liabilities
Years Apple Samsung
2014 1.05 1.78
2015 1.08 2
2016 1.33 2.26
2017 1.23 1.73
End of preview
Want to access all the pages? Upload your documents or become a member.
Related Documents
Financial Analysis of Samsung and Applelg...
|22
|4606
|499
Financial Analysis Management & Entrepreneurship- FAMElg...
|20
|3807
|488
Financial Performance Analysis of Apple and Samsunglg...
|38
|3940
|89
Financial Analysis of Applelg...
|6
|1233
|56
Financial Analysis Management & Enterprise- Assignmentlg...
|36
|6391
|129
Financial Analysis Management & Enterprise Assignmentlg...
|14
|3605
|102