Financial Performance Analysis of Apple and Samsung
38 Pages3940 Words89 Views
Added on 2021-01-02
Financial Performance Analysis of Apple and Samsung
Added on 2021-01-02
ShareRelated Documents
FAME

Table of ContentsINTRODUCTION...........................................................................................................................1MAIN BODY...................................................................................................................................11. Critically comparing and contrasting financial performance of Samsung and Apple for lastfour years.....................................................................................................................................1.....................................................................................................................................................3.....................................................................................................................................................42. Analysing CSR sections of companies and commenting on findings...................................15CONCLUSION..............................................................................................................................16REFERENCES..............................................................................................................................18APPENDIXES...............................................................................................................................19
INTRODUCTIONFinancial management and information have significant role in assessing overall financialposition in effective manner. Present report deals with Apple and Samsung both are tech-giantsand comparison of financial performance of companies will be undertaken in the report. Foraccomplishing this, widely used technique, ratio analysis will be applied for assessingperformance over four years starting from 2014-2017. Moreover, vertical and horizontal analysisfor both companies will be applied for same period. Apart from it, CSR sections of companieswill be analysed and explained in report. Thus, overall financial performance of organisationswill be assessed and interpreted and better performing firm will be analysed.MAIN BODY1. Critically comparing and contrasting financial performance of Samsung and Apple for lastfour yearsFinancial Ratios of Samsung and Apple are listed below-Profitability Ratios SamsungApple Particulars Formula20172016201520142017201620152014Profitability RatiosNet profit372978841959426016848022067918148351456875339439510Gross profit9750423470345428682147656888286688186842639362670537Sales Revenue211811887174047940177365404182273479229234215639233715182795Gross profit marginGross profit/Sales revenue0.460.40.380.370.380.390.40.38Net profit marginNet profit/Sal0.170.110.090.110.210.210.220.211
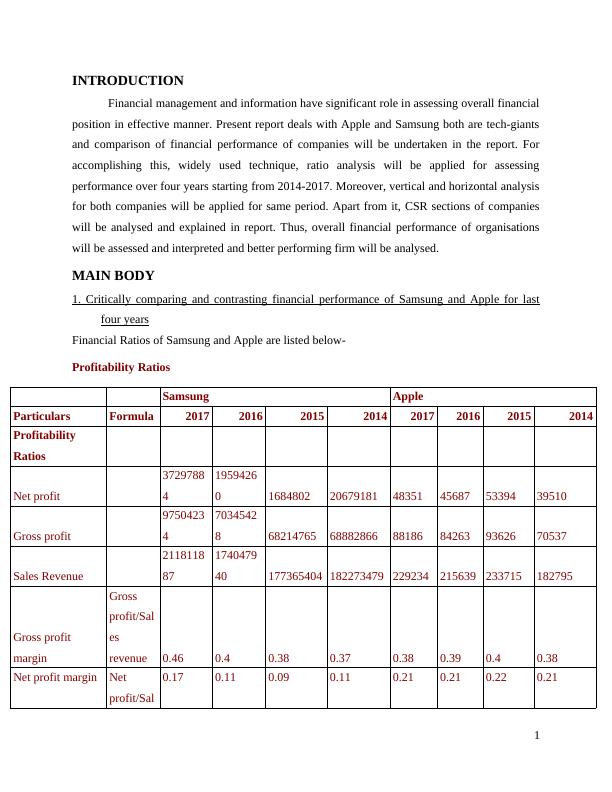
es revenue2

Illustration 1: Gross profit ratioIllustration 2: Net profit ratio3
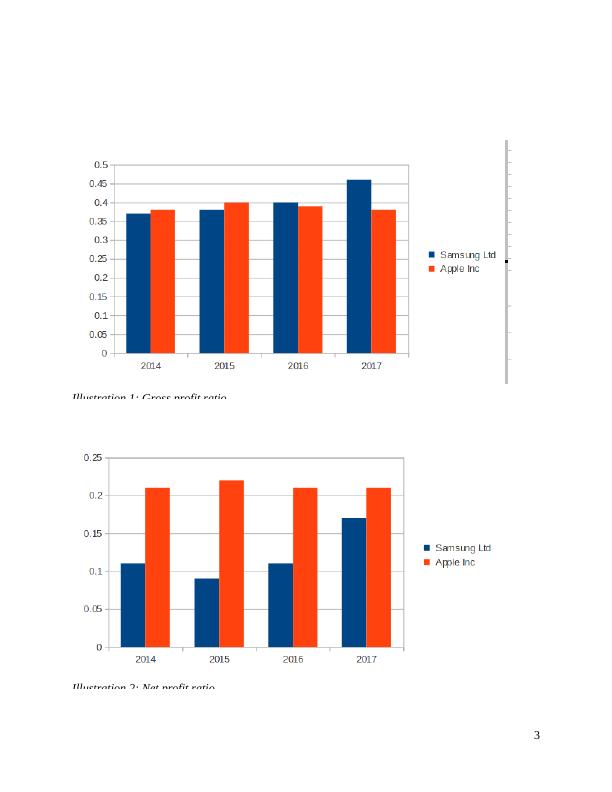
Interpretation-It can be interpreted from above graphs that profitability ratios are being computed forboth companies. Gross profit is one of the important profitability measure which is carried out bydeducting cost of goods manufactured from sales revenue. It can be analysed that Apple hadgross profit ratio of 0.38 in 2014 which reached to 0.40 in 2015. This clearly shows that firm isable to reduce expenses on sales and thus, ratio is improved. Moreover, in 2016, it was reducedand come to 0.39 and further to 0.38 in 2017. It shows that ratio is steady over last four years. Onthe other hand, Samsung had ratio of 0.37 in 2014. While, in next year, 0.38 was attained and0.40 in 2016. In 2017, gross profit ratio had reached record high of 0.46 (Annual report ofSamsung. 2017). This shows that firm is able to initiate reduction upon its expenses in the bestmanner possible. Net profit is calculated which shows operational and non-operational expenditures whichare deducted from gross profit to arrive at net income. Taxes and interest are accounted for andsubtracted from profit and as a result, it is also known as PAT (Profit After Tax). It can beassessed that Samsung had net profit ratio of 0.11 in 2014, reached to 0.09 in 2015. It reached to0.11 in 2016 and increased to 0.17 in next period. This shows that it has initiated good controlover the expenses in order to ascertain good quantum of profits in the best manner possible.Apple had ratio of 0.21 in 2014 which increased in 2015 to 0.22 showing that it had goodposition in comparison to Samsung in following two years. On the other hand, it can be analysedthat in 2016 and 2017, ratio was 0.21. It can be assessed that in accordance to gross profit ratio, Samsung has more of it as it isable to control its expenses in a better manner. On the other hand, net profit ratio of Apple isgood as overall expenditures are being controlled in a better manner. This shows that collectivelyApple has good profitability position as all expenses are being controlled and monitored fromtime-to-time leading to have profitable position in effective manner (Annual report of Apple.2017). It is required that Samsung should control its manufacturing and interest expenses so thathigher profits may be attained in a better manner. This will be beneficial for the firm in long runand rivalries will be outreached with ease. Hence, profitability ratios shows financial health ofcompany which is required to ascertained in a better way. Liquidity Ratios 4
SamsungApple Particulars Formula20172016201520142017201620152014Liquidity RatiosCurrent Assets1299492191219395931103285821017820441286451068698973868531Current Liabilities59390443471654464464148245977117100814790068061063448Stock220881281582424816628475153076144855213223492111Prepaid Expenses33907703019469280264529581840000Quick/ Liquidassets254788981884371719431120182657984855213223492111Total liquid assets(Current Assets-Liquid assets)10447302110309587690897462835162461237901047378702966420Current ratioCurrentAssets/Currentliabilities2.182.582.472.231.271.351.11.08Quick ratioLiquidAssets/Currentliabilities1.752.182.031.811.221.321.071.045
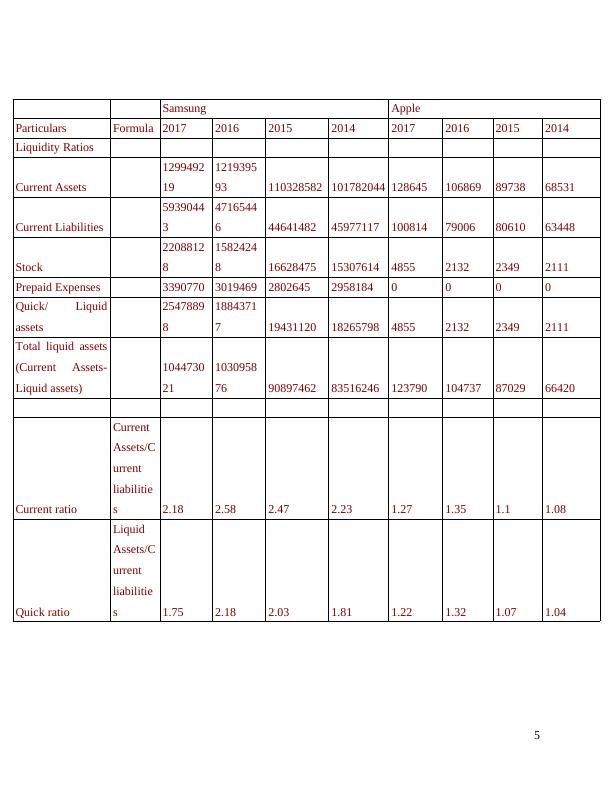
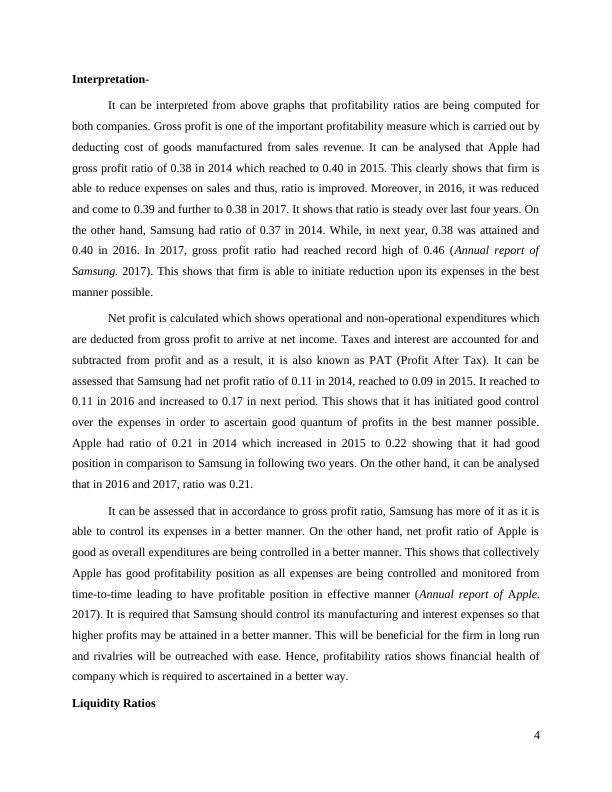
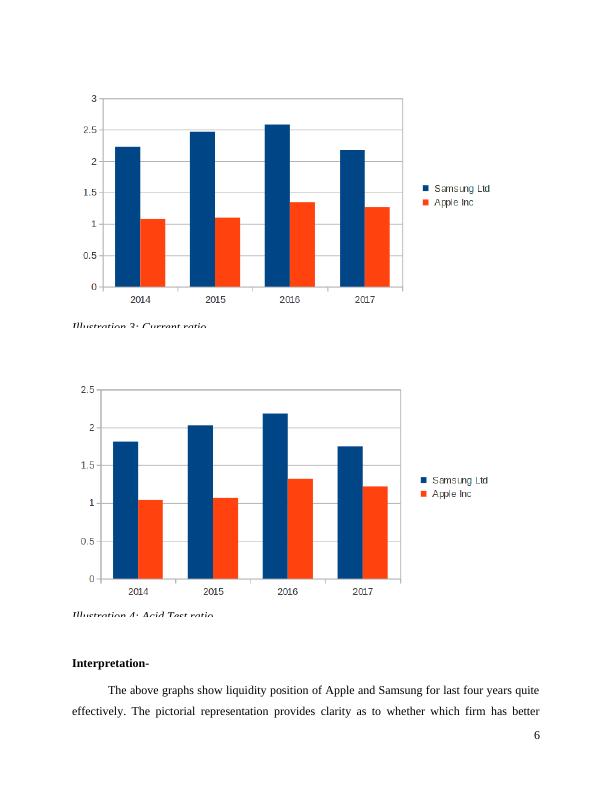
Illustration 3: Current ratioIllustration 4: Acid Test ratioInterpretation-The above graphs show liquidity position of Apple and Samsung for last four years quiteeffectively. The pictorial representation provides clarity as to whether which firm has better6
End of preview
Want to access all the pages? Upload your documents or become a member.
Related Documents
Financial Analysis Management & Entrepreneurship Assignmentlg...
|18
|1325
|176
Financial Analysis Management & Enterprise- Assignmentlg...
|36
|6391
|129
Financial Analysis Management & Enterprise Essaylg...
|19
|3828
|49
Financial Analysis Management - Apple and Samsunglg...
|42
|5846
|362
Financial Analysis of Samsung and Applelg...
|22
|4606
|499
Financial Analysis Management & Entrepreneurship- FAMElg...
|20
|3807
|488