Financial Analysis Report: Comparing Farsons and Heiniken Financials
VerifiedAdded on 2023/01/18
|24
|3501
|53
Report
AI Summary
This report presents a detailed financial analysis of Farsons and Heiniken, two companies operating in the beer production industry. The analysis encompasses vertical, horizontal, and ratio analysis techniques applied to their financial statements from 2015 to 2018. The report examines key financial metrics such as gross profit, net profit, shareholder's equity, and various ratios like the net profit ratio, to assess the companies' performance, stability, solvency, liquidity, and profitability. The analysis includes comparative insights, highlighting trends and fluctuations in financial indicators. The findings offer a comprehensive understanding of each company's financial position, providing valuable information for strategic decision-making and evaluating their financial health over the specified period. The report provides insights into how these companies manage their finances.

Financial Analysis
Management Enterprise
Management Enterprise
Paraphrase This Document
Need a fresh take? Get an instant paraphrase of this document with our AI Paraphraser
INTRODUCTION
Financial analysis is characterised as a method of assessing monetary information of
companies for a specific time frame. In other words, the financial analysis is an component of the
general role of corporate finance involving the review of statistical information to obtain insight
on a corporation's present and potential financial safety. In a wide range of cases, financial
analysis can be used to provide business executives with the knowledge required to make
strategic decisions. Finance is an organizational term. Financially, business goals or objectives
are established and financially quantified. Flexibility in the dialect of financial services, the
ability to learn and comprehend financial information and the current evidence in the form of
financial statements are among the skills needed for understanding and managing a firm. Every
business manager needs the ability to comprehend financial data. In other word, this may be
understood as a way of analysing businesses, projects and budgets in order to assess financial
condition of corporations (Morden, 2016). Basically, it is beneficial for assessing stability,
solvency, liquidity and profitability. The report is based on evaluation of monetary performance
and condition of two entities that are Farsons and Heiniken. These companies operate in
production of beer. The Farsons Company is located in Malta and Heiniken Company at
Netherlands.
MAIN BODY
Task 1. A detailed vertical, horizontal and ratio analysis of the financial statements of the
Farsons and Heiniken companies.
In order to assess financial position, there are different ranges of methods that are applied
by corporations. Some common analysing techniques are horizontal and vertical analysis which
is mentioned below in respect of above mentioned companies:
Vertical analysis- It can be understood as an analysis of financial statement in which element of
financial statement is listed as percentage of another element (Farrell and Gallagher, 2015). It
can understand by an example of income statement in which each item is based on the
percentage of gross sales. Heiniken Company:
Income statement-
⊘ This is a preview!⊘
Do you want full access?
Subscribe today to unlock all pages.
Trusted by 1+ million students worldwide
One of the three primary financial statements used to disclose a company's financial results over
a particular accounting cycle is an income document, with the other two main accounts being the
balance sheet and the cash flow statement. A declaration of revenue and loss or a related to
financial is also known as a statement of financial position and the assertion of income and costs.
The declaration is split into periods which follow the operation of the firm logically. Quarterly
(methodology) are the most prevalent recurrent divisions, but some firms may use a 13-year
cycle. These recurrent declarations are summarized in the quarterly or annual outcomes in path
coefficients. This presentation is an excellent way to begin a financial plan, because the balance
sheet and cash flow statements need the least level of info. The income statement is therefore a
precursor of the other two main reports, in terms of quality.
As per of vertical analysis of income statement of above company, this may be assessed
that their gross profits are decreasing in a significant manner as compare to their sales revenues.
While, value of net profit is fluctuating in all four years. Such as in year 2015, it was of 4.67%
which decreased till 3.75%. Though in 2017, it increased in become of 4.46 but again in 2018, it
fell down till 4.28%
Statement of financial position:
The financial statement, also comparative balance sheet, is a document which, on a specified
date, lists a company's assets, liabilities and equities. In other terms, on a given day it describes a
company's finances, responsibilities, and property information. In the context that this assertion
is a cultural report, this concept is true. This reveals just the posts on the same day the study was
published. This is opposed to other annual disclosures such as the analyzed by calculating which
portrays the operations of the business over an amount of time. Only the business collected from
two on the last day of the income statement is recorded. In other words, the word for the balance
sheet is the declaration of financial condition. During the audit time, the report reports an
institution's properties, liabilities and equities. For an array of investment studies, such as
contrasting debt to equity or trying to compare liquidity ratios, the details on the financial
statements can be used. This is one of the financial reports, as well as the balance sheet and the
income assertion. It is one of the effective financial statements which can be used by business
entities in order to take crucial decisions for different purpose. As well as it is also used by
different stakeholders in order to take critical decisions. Such as internal stakeholders take many
decisions on the behalf of actual financial position.
Paraphrase This Document
Need a fresh take? Get an instant paraphrase of this document with our AI Paraphraser
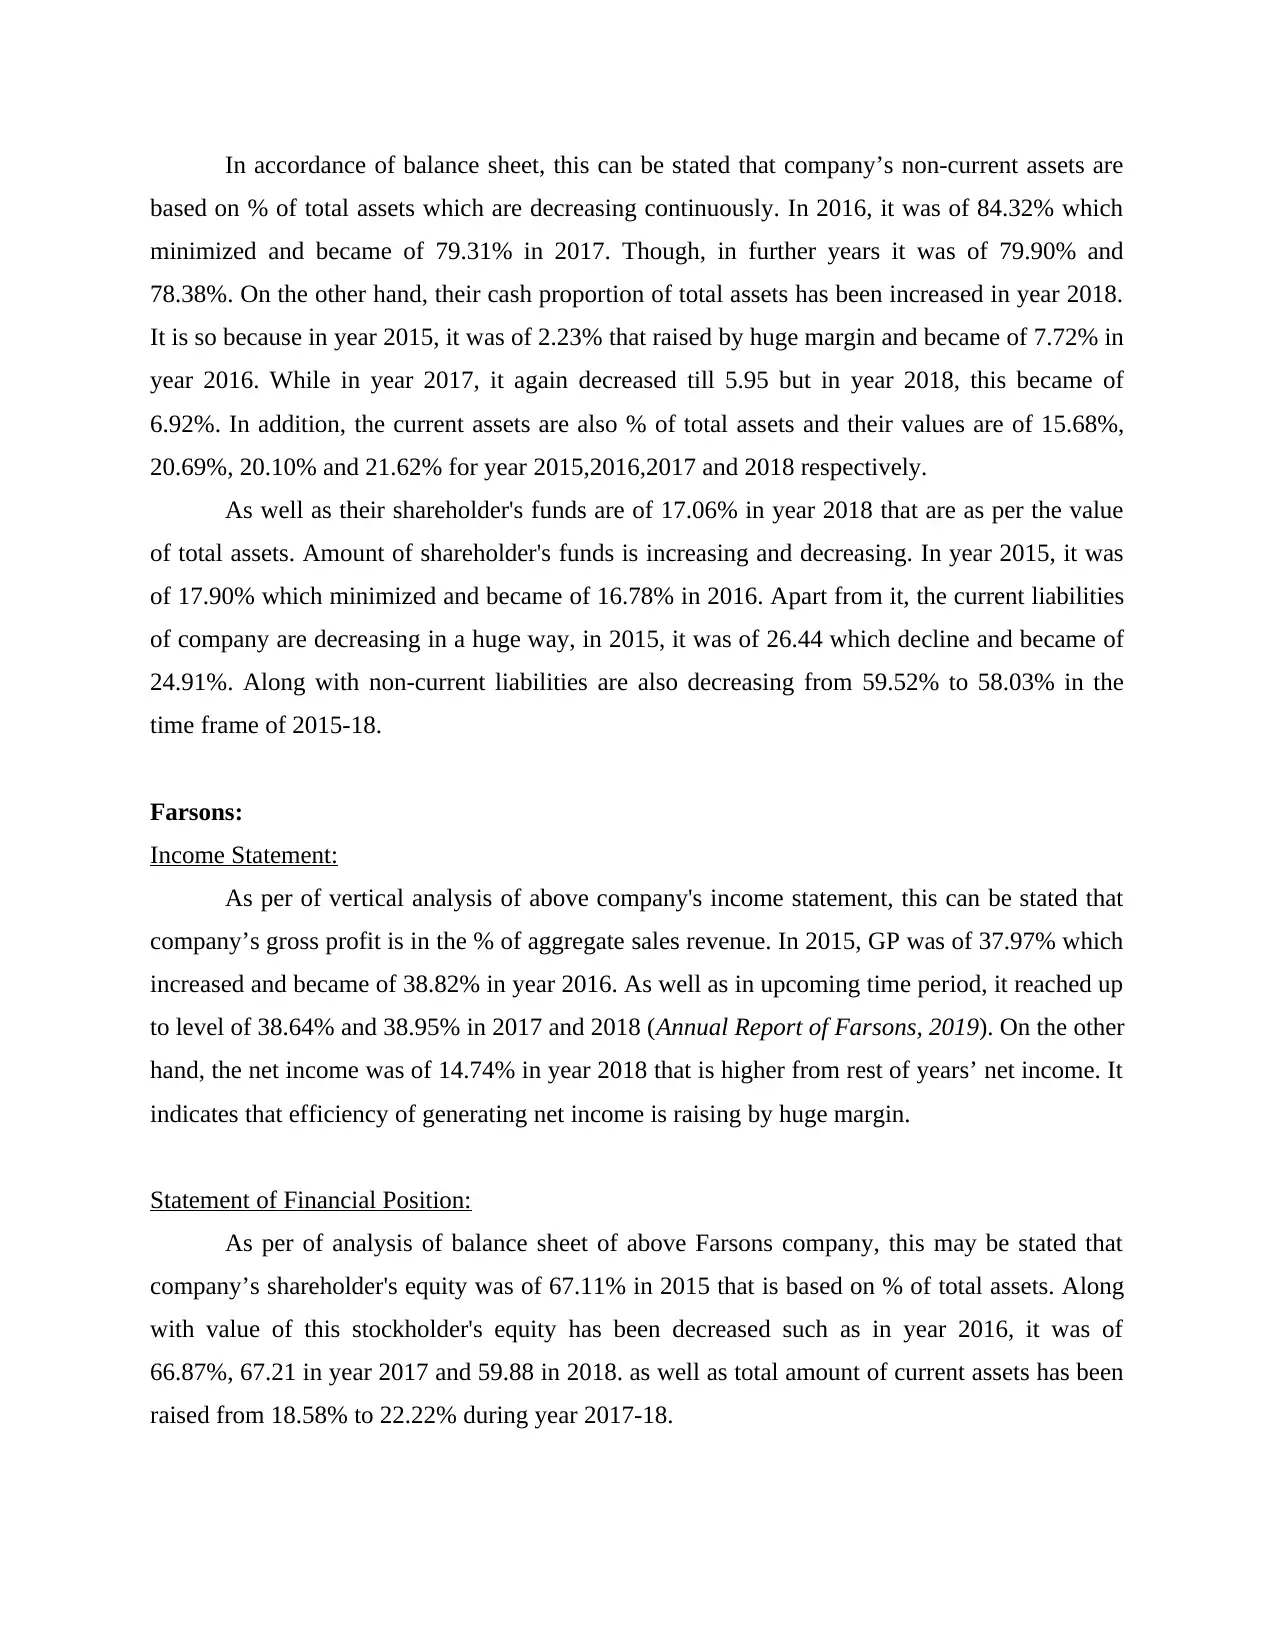
In accordance of balance sheet, this can be stated that company’s non-current assets are
based on % of total assets which are decreasing continuously. In 2016, it was of 84.32% which
minimized and became of 79.31% in 2017. Though, in further years it was of 79.90% and
78.38%. On the other hand, their cash proportion of total assets has been increased in year 2018.
It is so because in year 2015, it was of 2.23% that raised by huge margin and became of 7.72% in
year 2016. While in year 2017, it again decreased till 5.95 but in year 2018, this became of
6.92%. In addition, the current assets are also % of total assets and their values are of 15.68%,
20.69%, 20.10% and 21.62% for year 2015,2016,2017 and 2018 respectively.
As well as their shareholder's funds are of 17.06% in year 2018 that are as per the value
of total assets. Amount of shareholder's funds is increasing and decreasing. In year 2015, it was
of 17.90% which minimized and became of 16.78% in 2016. Apart from it, the current liabilities
of company are decreasing in a huge way, in 2015, it was of 26.44 which decline and became of
24.91%. Along with non-current liabilities are also decreasing from 59.52% to 58.03% in the
time frame of 2015-18.
Farsons:
Income Statement:
As per of vertical analysis of above company's income statement, this can be stated that
company’s gross profit is in the % of aggregate sales revenue. In 2015, GP was of 37.97% which
increased and became of 38.82% in year 2016. As well as in upcoming time period, it reached up
to level of 38.64% and 38.95% in 2017 and 2018 (Annual Report of Farsons, 2019). On the other
hand, the net income was of 14.74% in year 2018 that is higher from rest of years’ net income. It
indicates that efficiency of generating net income is raising by huge margin.
Statement of Financial Position:
As per of analysis of balance sheet of above Farsons company, this may be stated that
company’s shareholder's equity was of 67.11% in 2015 that is based on % of total assets. Along
with value of this stockholder's equity has been decreased such as in year 2016, it was of
66.87%, 67.21 in year 2017 and 59.88 in 2018. as well as total amount of current assets has been
raised from 18.58% to 22.22% during year 2017-18.
Horizontal analysis- This is known as trend analysis (Kärkinen and Laitinen, 2015). It is a type
of technique which indicates the variation in amount of corresponding financial statement items
during a particular time period. Eventually, it is beneficial to assess trend situations. As well as
to conduct this analysis, the statements of two or more the two period are taken.
Heiniken:
Income Statement:
As per of horizontal analysis of above Heiniken company it may be assessed that
variance increase in total sales during year 2017 is higher such as in 2017, it was of 5.27 which
reduced and became of 2.66% in year 2018 (Annual Report of Heiniken, 2019). As well as their
value of gross profit has been reduced in year 2018. Though in year 2017, it was showing higher
growth of 6.04%. On the other hand, net profit also decreased in 2018 in compare to 2017.
Statement of financial position:
As per of balance sheet of above company, this may be stated that there is an
enhancement in total of stockholder's fund in 2018. On the other hand, it was of -2.25% and
0.53% during year 2016 and 2017. As well as value of non-current liabilities also increased by
1.69% in year 2018 which raised by 7.24 in year 2017. Apart from it, the value of current
liabilities is also decreasing in year 2018 by -0.08% and in year 2016-17 it raised by 22.09% and
0.59%.
Along with the cash funds of above company raised by 268.33% in 2016 that
dramatically reduced by 19.54%. Though, in year 2018 it was increased by 18.88%. As well as
amount of current assets was of raised by 37.59%, 1.36%, 9.97 for year 2016, 2017 and 2018
respectively. While, non-current assets are raised from 0.31% in financial year 2018 and in year
2016, this was reduced by 1.94%.
Farsons:
Income Statement:
As per the given data, this can be stated that revenues raised by 7.95% in year 2018 that
was enhanced from 3.53% and 7.59% in accounting year of 2017 and 2018. On the other hand,
gross profit of company raised by 10% and 3.03% in year 2016-17 and 8.82 in year 2018.
Similar as above, NP of company also raised from 16.67% in year 2018 that was of 37.50 and
9.09 in year 2016-17.
⊘ This is a preview!⊘
Do you want full access?
Subscribe today to unlock all pages.
Trusted by 1+ million students worldwide
Statement of financial Position:
As per of horizontal analysis of balance sheet of Farsons company, this may be stated that
stockholder's funds are decreased by 21.14% in 2018 which raised in year 2016 and 2017 by 9%
and 12.84%. As well as their noncurrent liabilities are also raised by 11.67% in 2018 and 13.21
%, 8.16% in year 2016-17. Along with amount of current liabilities has also raised from 33.33%
in year 2018 and during year 2017, there was no change in current liabilities. In addition, the
value of total assets reduced from 11.48% in year 2018 and raised in year 2016 and 2017 from
12.27 and 9.40. The non-current assets are also decreased from 16.11 that was increasing in year
2017 and 2018 from 15.50 and 10.26%. In the end, the value of current assets boosted from
5.88%, 3.3% and 3.13% for 2018, 2017 and 2016.
Ratio analysis – This is a technique of assessing financial position of companies in that a variety
of ratios are computed to analyse key strength & weaknesses (Olson and Wu, 2015). This
technique is useful for making comparison of past years' financial performance with current
year’s performance. The key ratios which are included in this technique are profitability ratio,
efficiency ratio, investment ratio and many more. In Farsons and Heiniken companies, this
technique is applied for assessing their monetary performance.
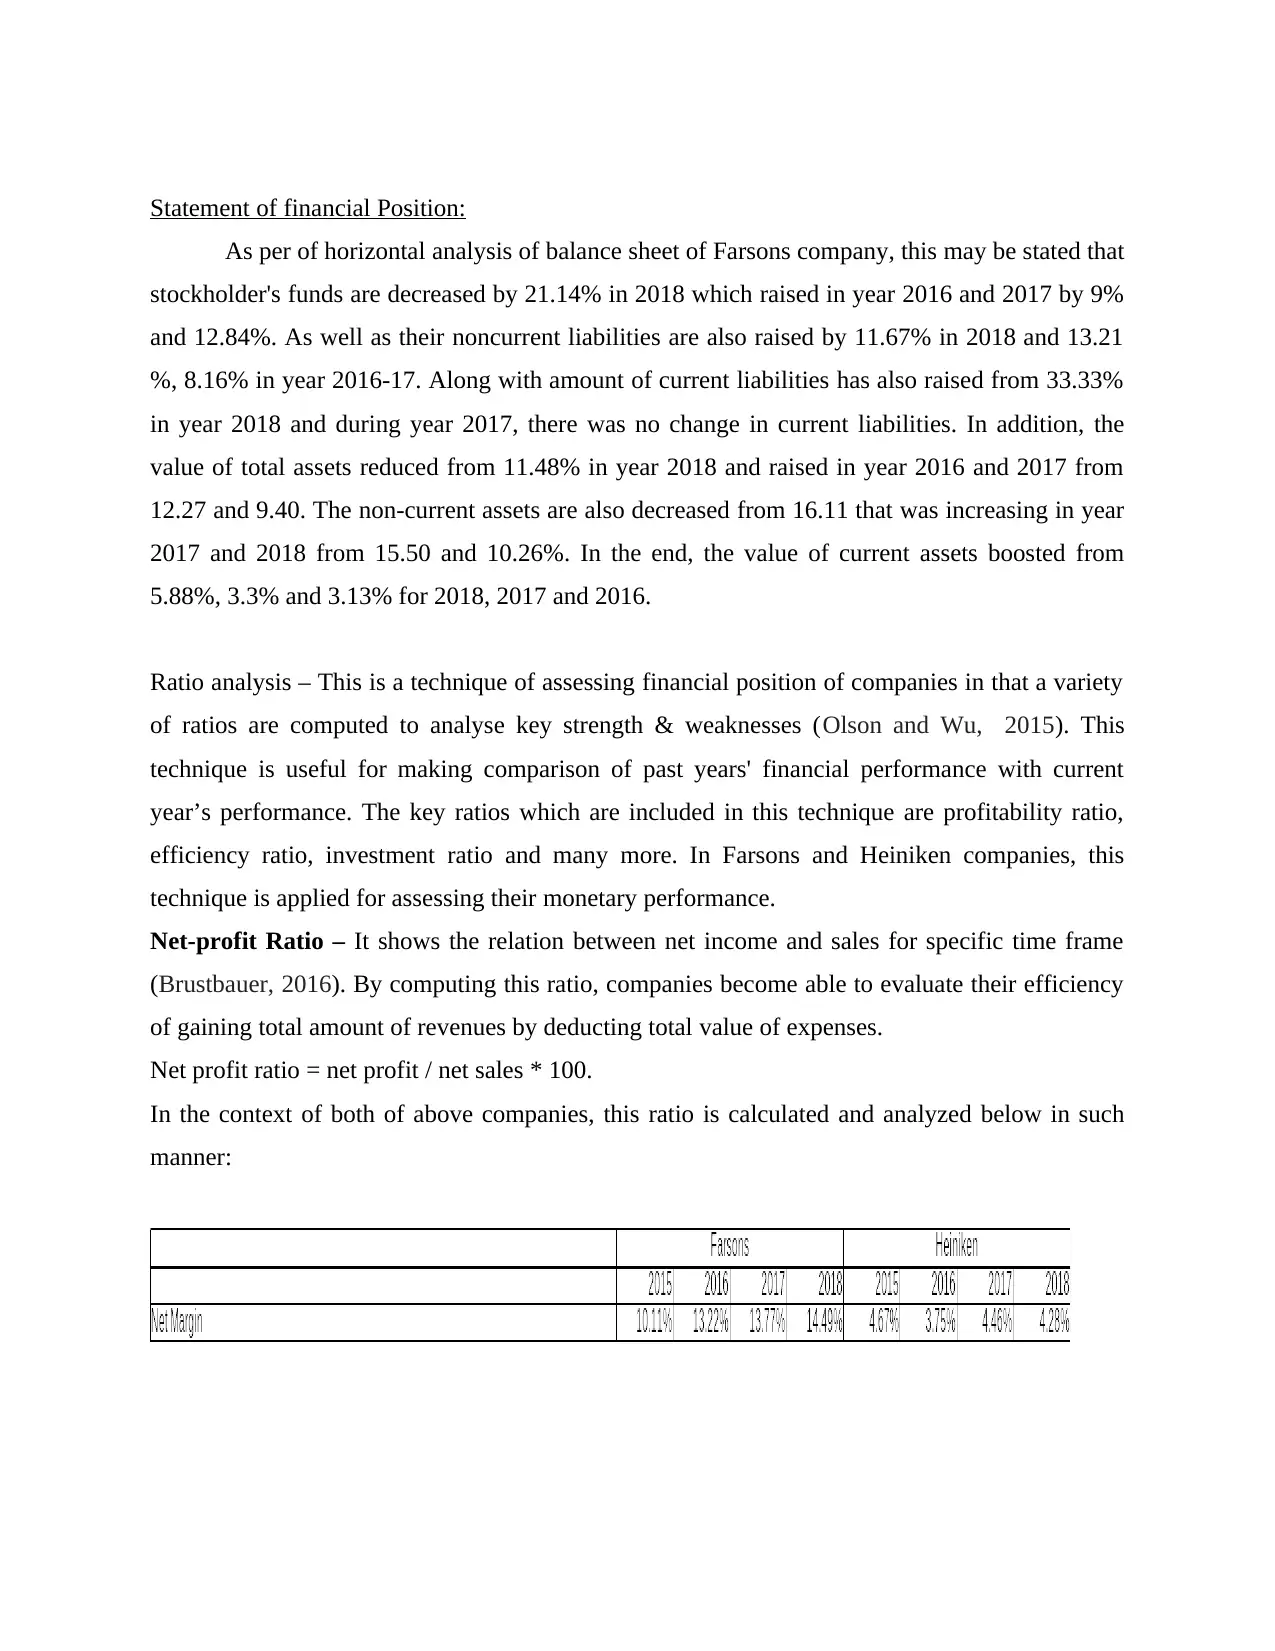
Net-profit Ratio – It shows the relation between net income and sales for specific time frame
(Brustbauer, 2016). By computing this ratio, companies become able to evaluate their efficiency
of gaining total amount of revenues by deducting total value of expenses.
Net profit ratio = net profit / net sales * 100.
In the context of both of above companies, this ratio is calculated and analyzed below in such
manner:
As per of horizontal analysis of balance sheet of Farsons company, this may be stated that
stockholder's funds are decreased by 21.14% in 2018 which raised in year 2016 and 2017 by 9%
and 12.84%. As well as their noncurrent liabilities are also raised by 11.67% in 2018 and 13.21
%, 8.16% in year 2016-17. Along with amount of current liabilities has also raised from 33.33%
in year 2018 and during year 2017, there was no change in current liabilities. In addition, the
value of total assets reduced from 11.48% in year 2018 and raised in year 2016 and 2017 from
12.27 and 9.40. The non-current assets are also decreased from 16.11 that was increasing in year
2017 and 2018 from 15.50 and 10.26%. In the end, the value of current assets boosted from
5.88%, 3.3% and 3.13% for 2018, 2017 and 2016.
Ratio analysis – This is a technique of assessing financial position of companies in that a variety
of ratios are computed to analyse key strength & weaknesses (Olson and Wu, 2015). This
technique is useful for making comparison of past years' financial performance with current
year’s performance. The key ratios which are included in this technique are profitability ratio,
efficiency ratio, investment ratio and many more. In Farsons and Heiniken companies, this
technique is applied for assessing their monetary performance.
Net-profit Ratio – It shows the relation between net income and sales for specific time frame
(Brustbauer, 2016). By computing this ratio, companies become able to evaluate their efficiency
of gaining total amount of revenues by deducting total value of expenses.
Net profit ratio = net profit / net sales * 100.
In the context of both of above companies, this ratio is calculated and analyzed below in such
manner:
Paraphrase This Document
Need a fresh take? Get an instant paraphrase of this document with our AI Paraphraser
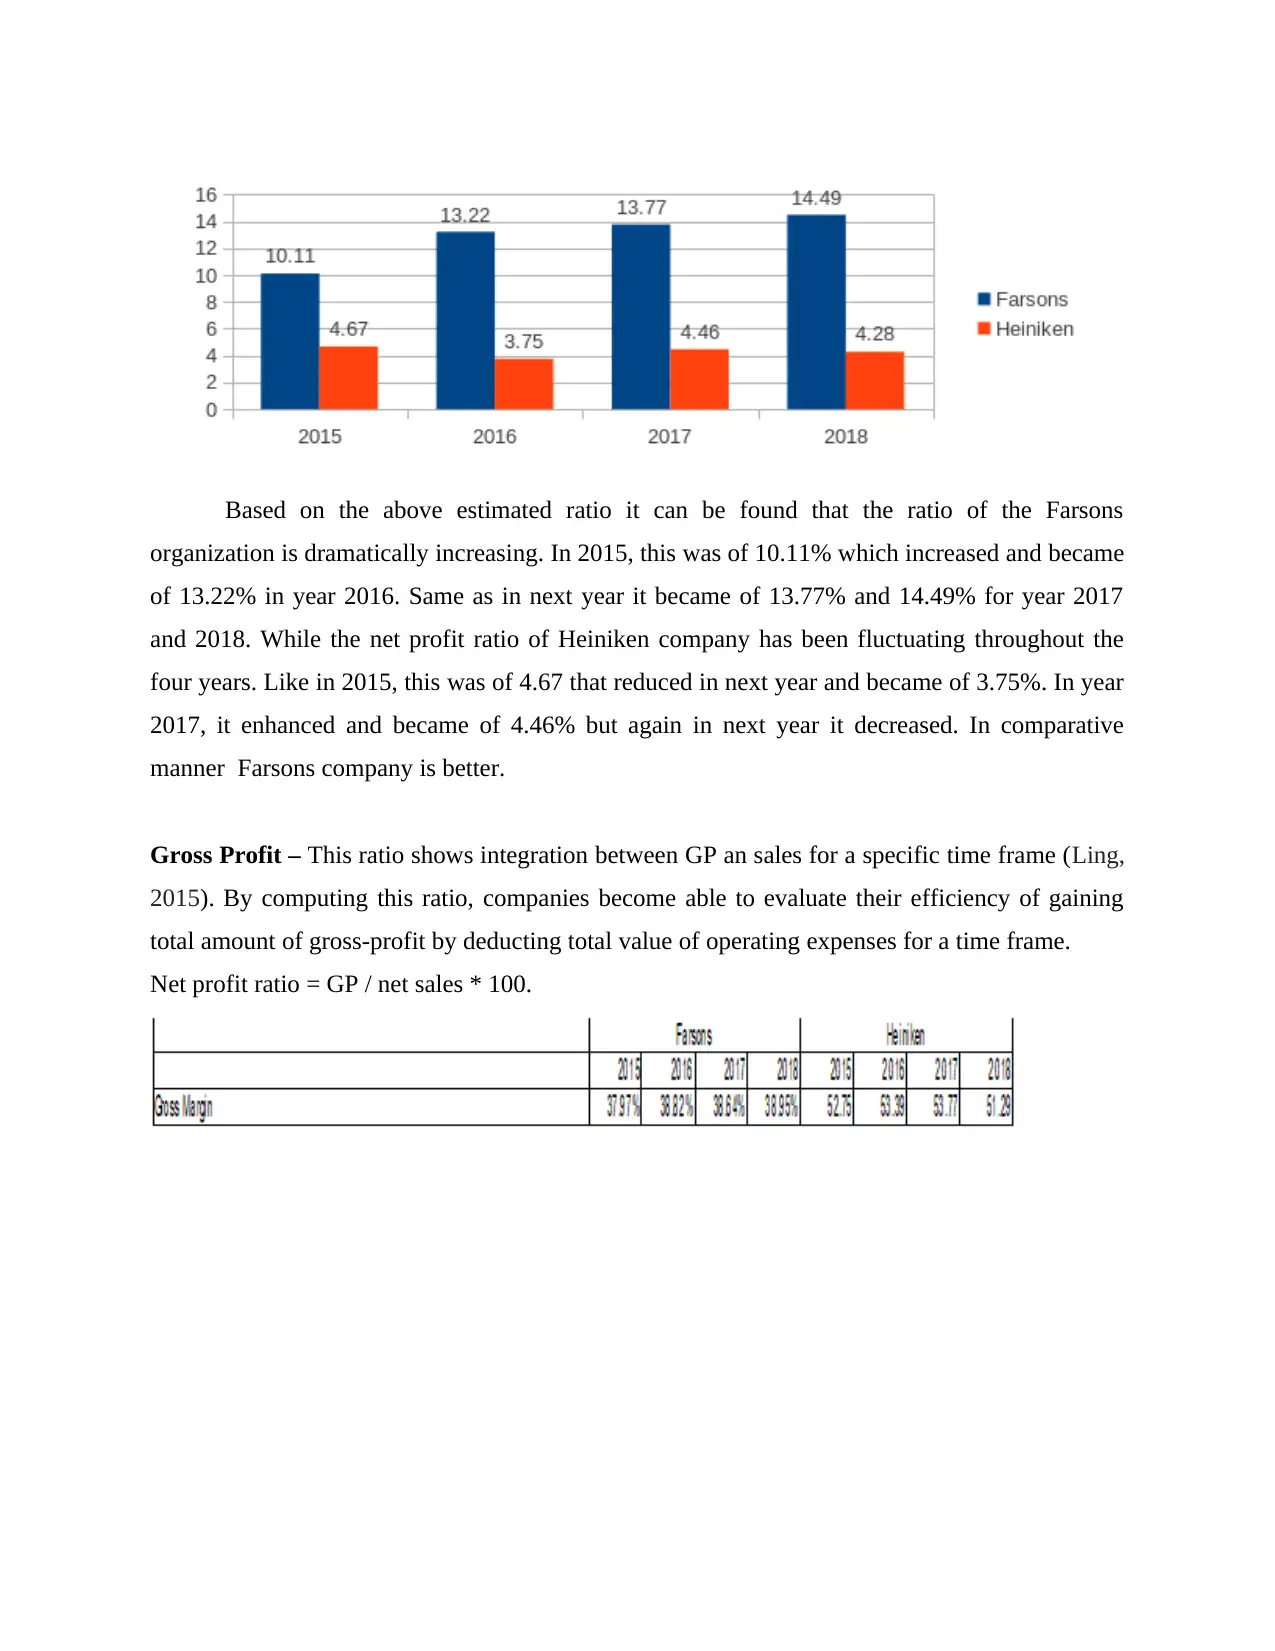
Based on the above estimated ratio it can be found that the ratio of the Farsons
organization is dramatically increasing. In 2015, this was of 10.11% which increased and became
of 13.22% in year 2016. Same as in next year it became of 13.77% and 14.49% for year 2017
and 2018. While the net profit ratio of Heiniken company has been fluctuating throughout the
four years. Like in 2015, this was of 4.67 that reduced in next year and became of 3.75%. In year
2017, it enhanced and became of 4.46% but again in next year it decreased. In comparative
manner Farsons company is better.
Gross Profit – This ratio shows integration between GP an sales for a specific time frame (Ling,
2015). By computing this ratio, companies become able to evaluate their efficiency of gaining
total amount of gross-profit by deducting total value of operating expenses for a time frame.
Net profit ratio = GP / net sales * 100.
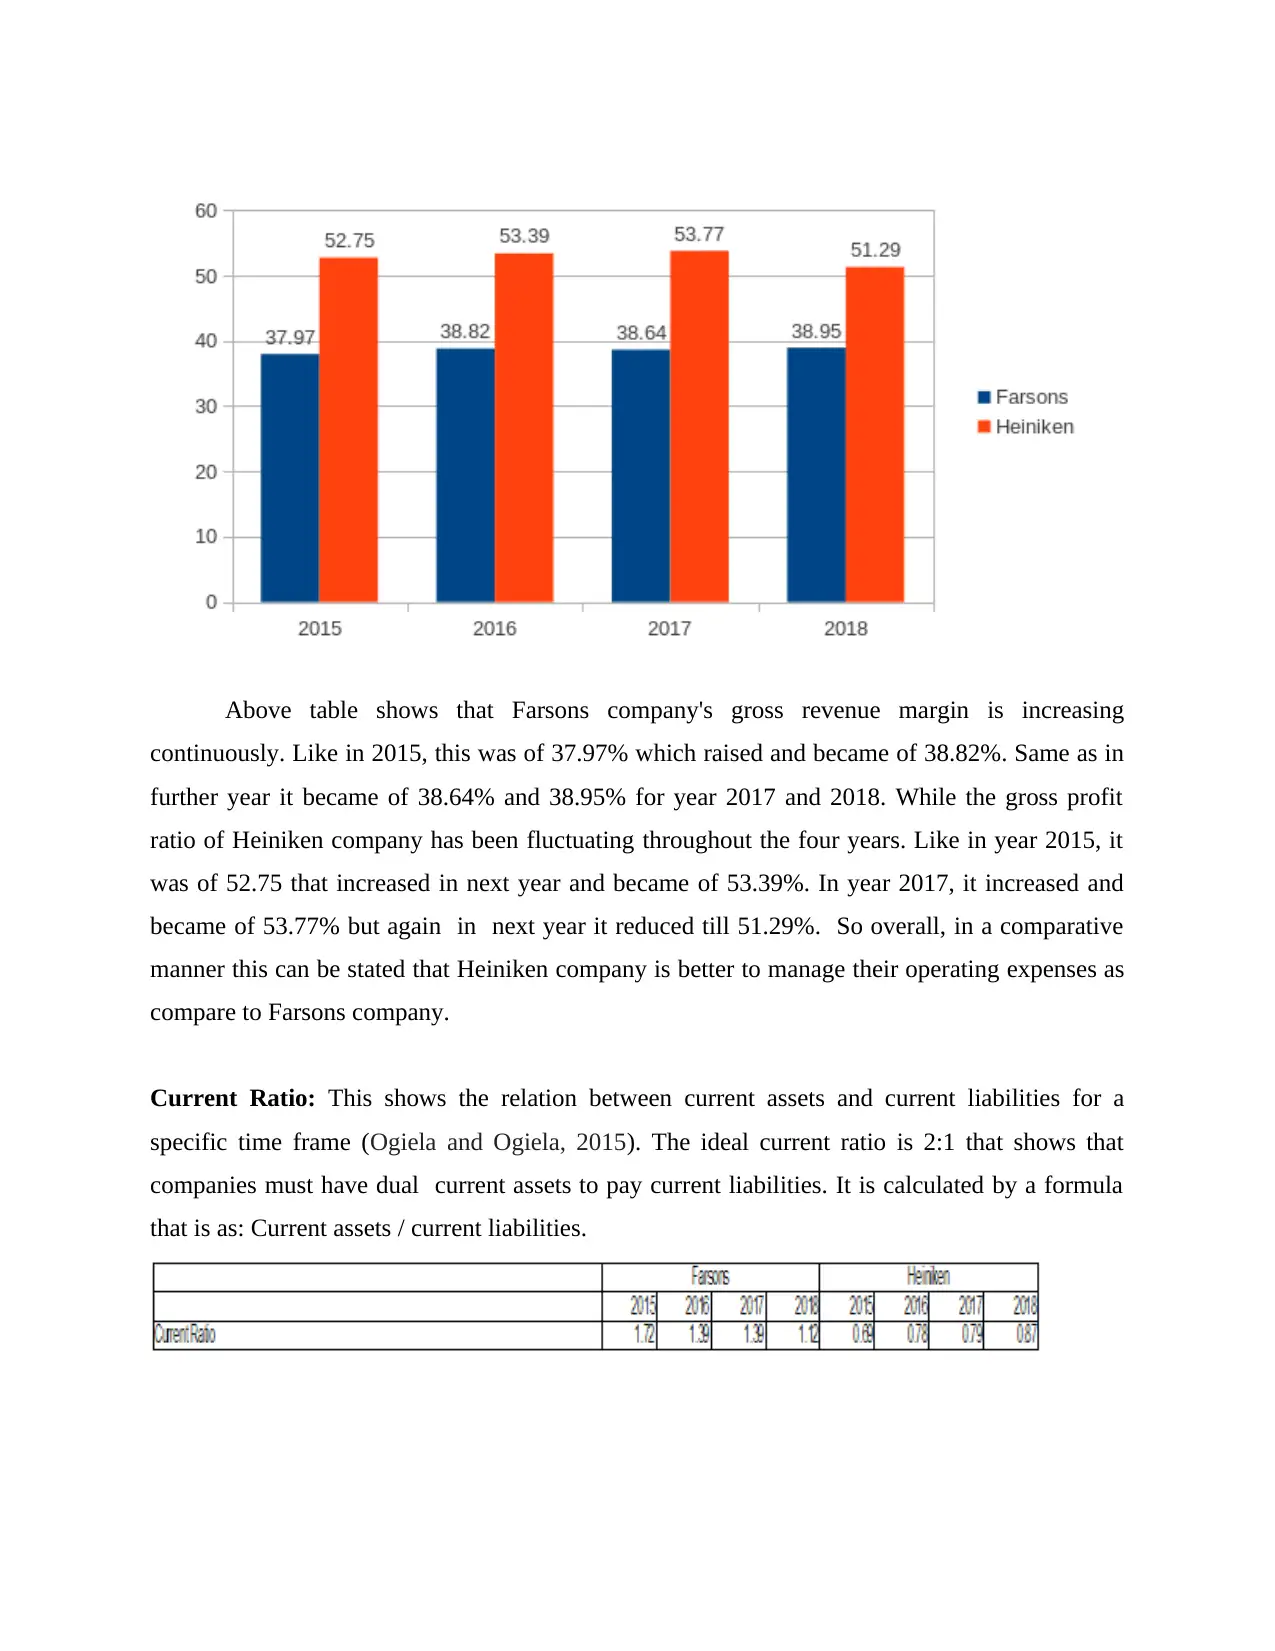
Above table shows that Farsons company's gross revenue margin is increasing
continuously. Like in 2015, this was of 37.97% which raised and became of 38.82%. Same as in
further year it became of 38.64% and 38.95% for year 2017 and 2018. While the gross profit
ratio of Heiniken company has been fluctuating throughout the four years. Like in year 2015, it
was of 52.75 that increased in next year and became of 53.39%. In year 2017, it increased and
became of 53.77% but again in next year it reduced till 51.29%. So overall, in a comparative
manner this can be stated that Heiniken company is better to manage their operating expenses as
compare to Farsons company.
Current Ratio: This shows the relation between current assets and current liabilities for a
specific time frame (Ogiela and Ogiela, 2015). The ideal current ratio is 2:1 that shows that
companies must have dual current assets to pay current liabilities. It is calculated by a formula
that is as: Current assets / current liabilities.
⊘ This is a preview!⊘
Do you want full access?
Subscribe today to unlock all pages.
Trusted by 1+ million students worldwide
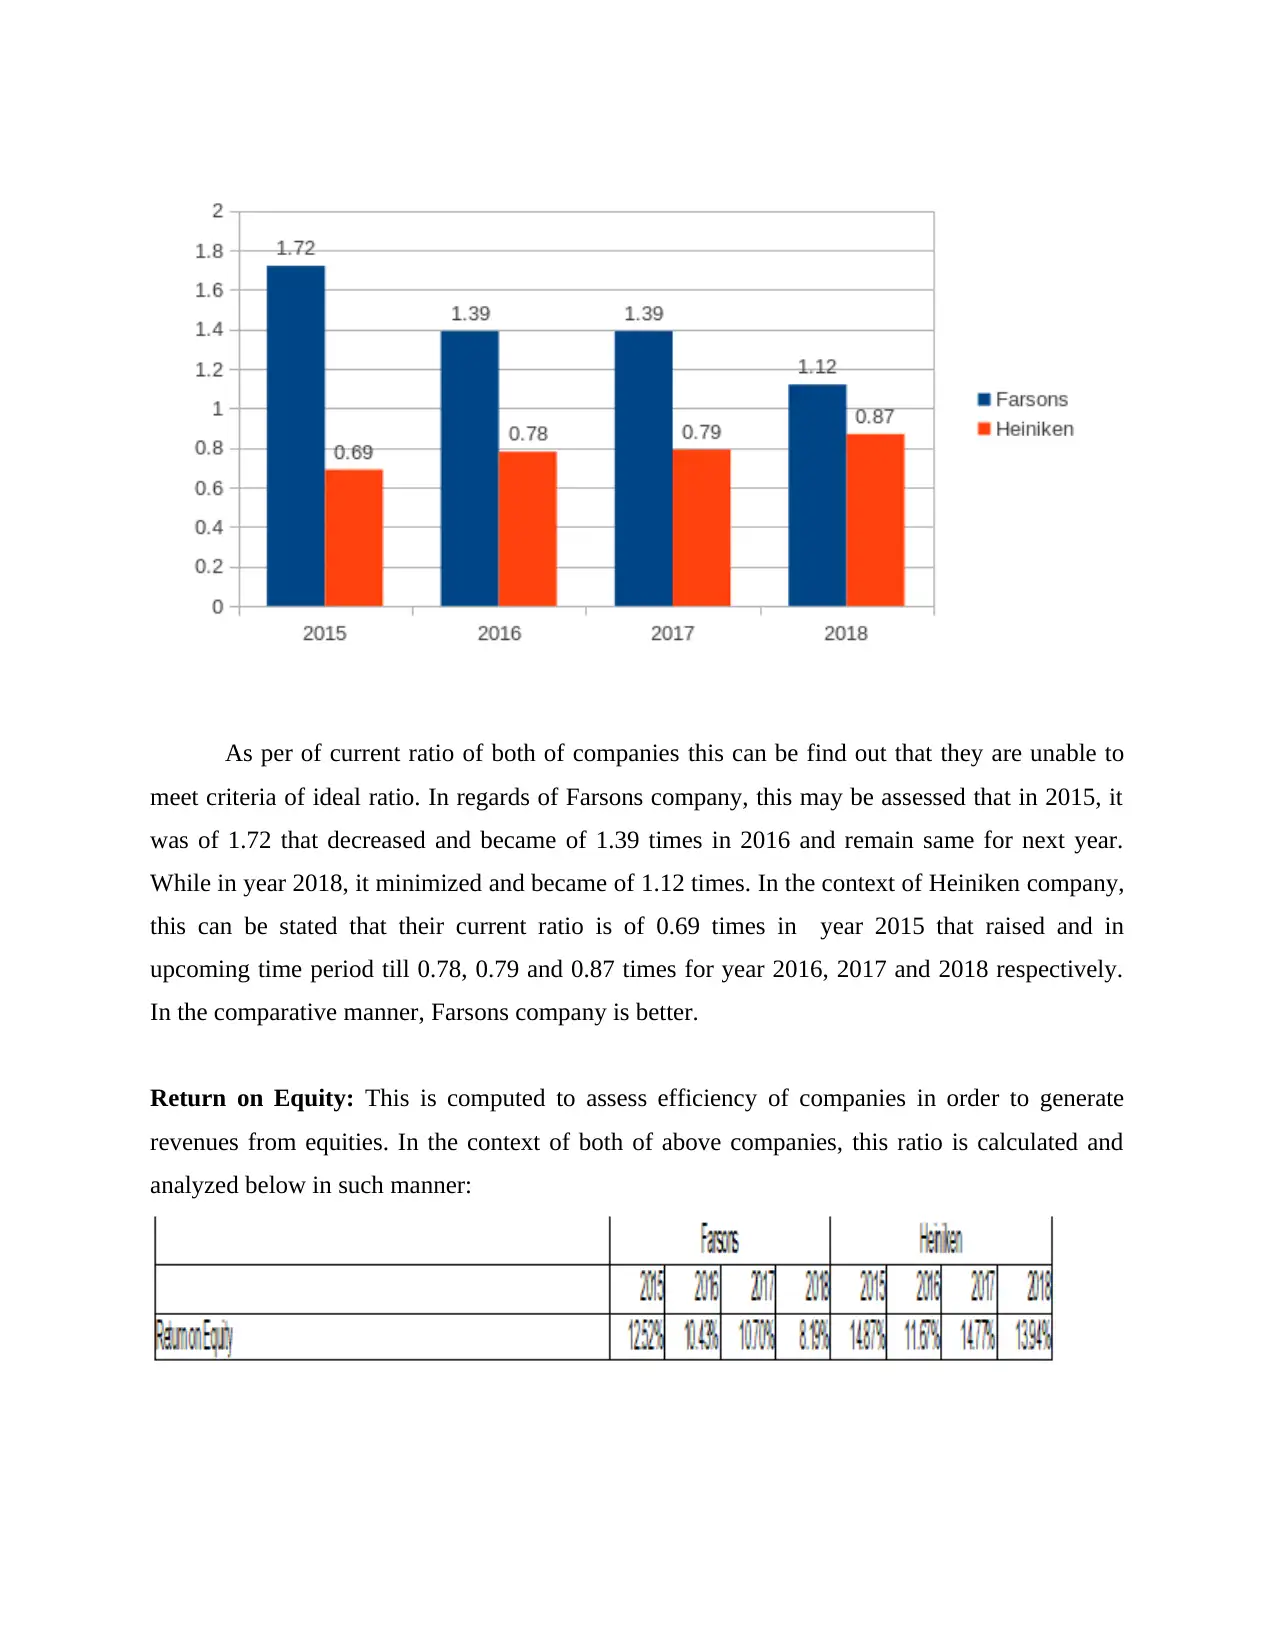
As per of current ratio of both of companies this can be find out that they are unable to
meet criteria of ideal ratio. In regards of Farsons company, this may be assessed that in 2015, it
was of 1.72 that decreased and became of 1.39 times in 2016 and remain same for next year.
While in year 2018, it minimized and became of 1.12 times. In the context of Heiniken company,
this can be stated that their current ratio is of 0.69 times in year 2015 that raised and in
upcoming time period till 0.78, 0.79 and 0.87 times for year 2016, 2017 and 2018 respectively.
In the comparative manner, Farsons company is better.
Return on Equity: This is computed to assess efficiency of companies in order to generate
revenues from equities. In the context of both of above companies, this ratio is calculated and
analyzed below in such manner:
Paraphrase This Document
Need a fresh take? Get an instant paraphrase of this document with our AI Paraphraser
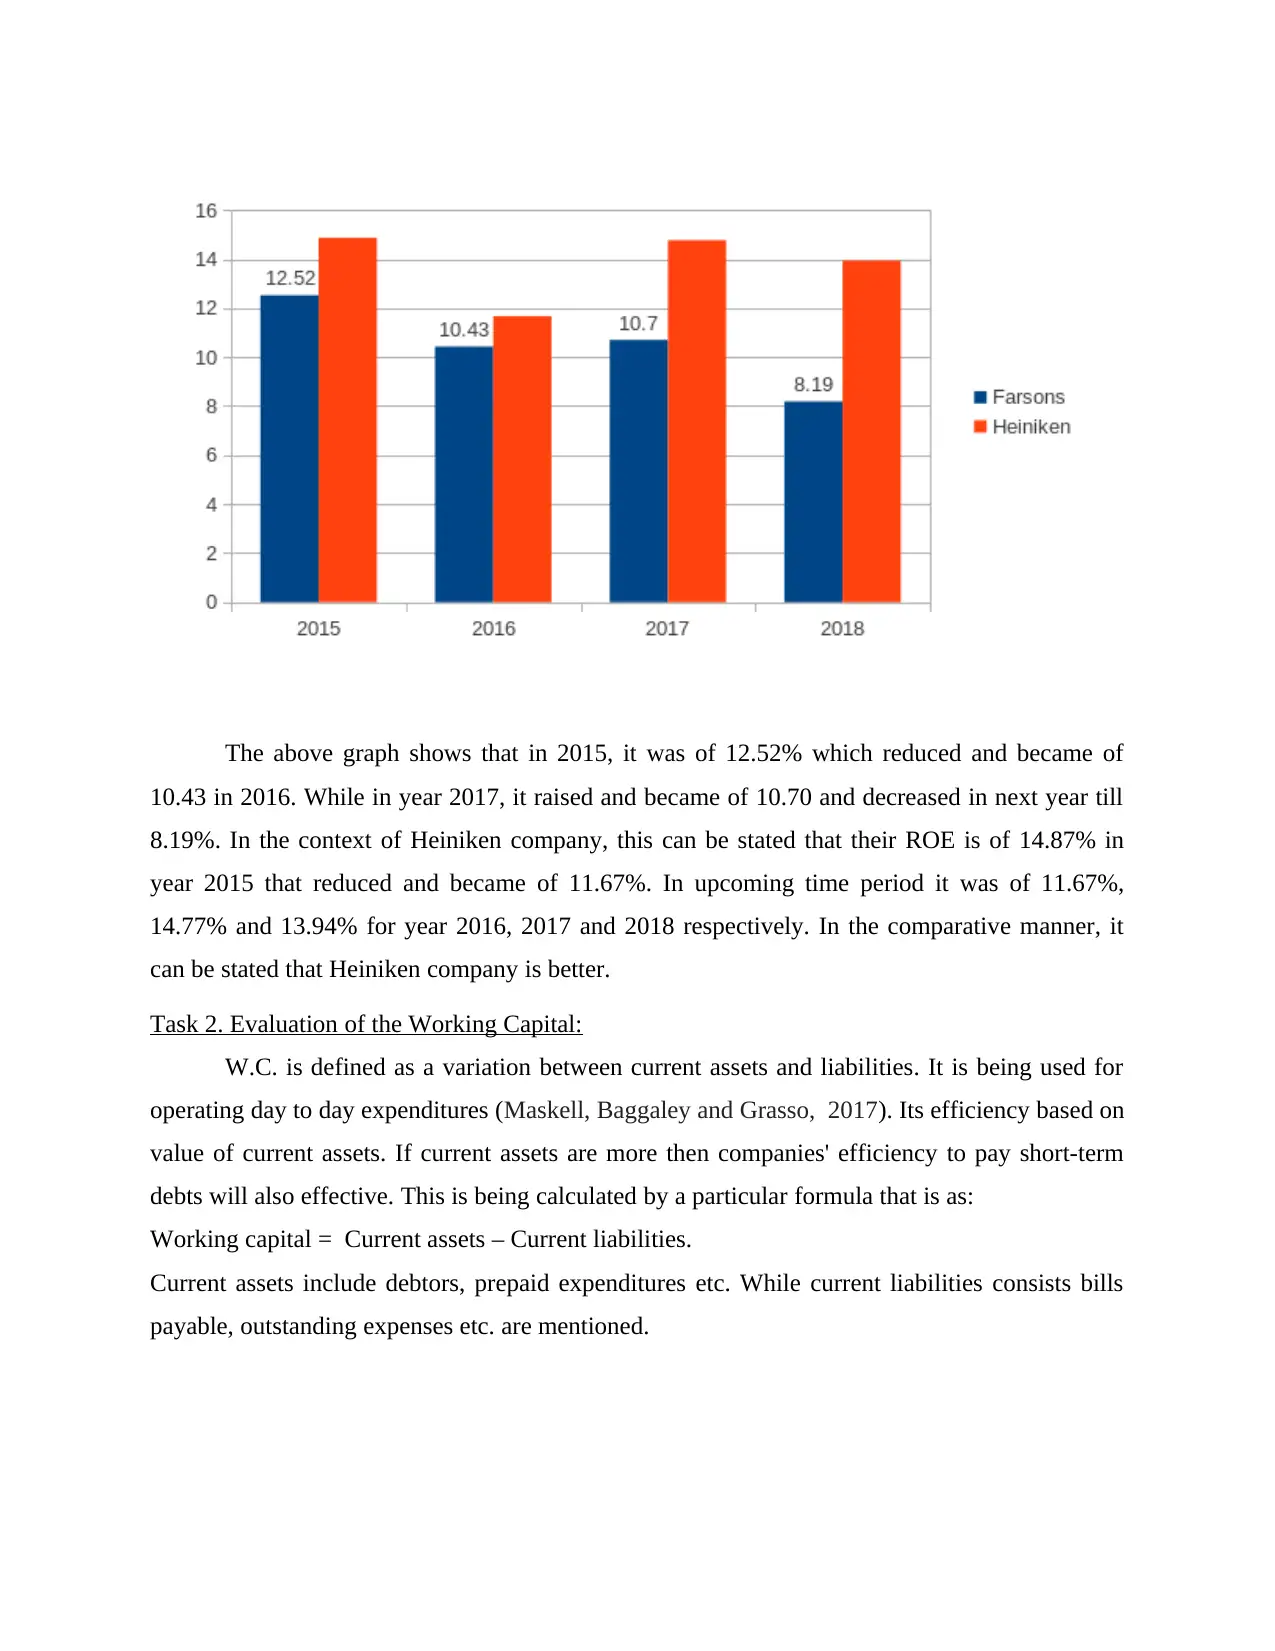
The above graph shows that in 2015, it was of 12.52% which reduced and became of
10.43 in 2016. While in year 2017, it raised and became of 10.70 and decreased in next year till
8.19%. In the context of Heiniken company, this can be stated that their ROE is of 14.87% in
year 2015 that reduced and became of 11.67%. In upcoming time period it was of 11.67%,
14.77% and 13.94% for year 2016, 2017 and 2018 respectively. In the comparative manner, it
can be stated that Heiniken company is better.
Task 2. Evaluation of the Working Capital:
W.C. is defined as a variation between current assets and liabilities. It is being used for
operating day to day expenditures (Maskell, Baggaley and Grasso, 2017). Its efficiency based on
value of current assets. If current assets are more then companies' efficiency to pay short-term
debts will also effective. This is being calculated by a particular formula that is as:
Working capital = Current assets – Current liabilities.
Current assets include debtors, prepaid expenditures etc. While current liabilities consists bills
payable, outstanding expenses etc. are mentioned.
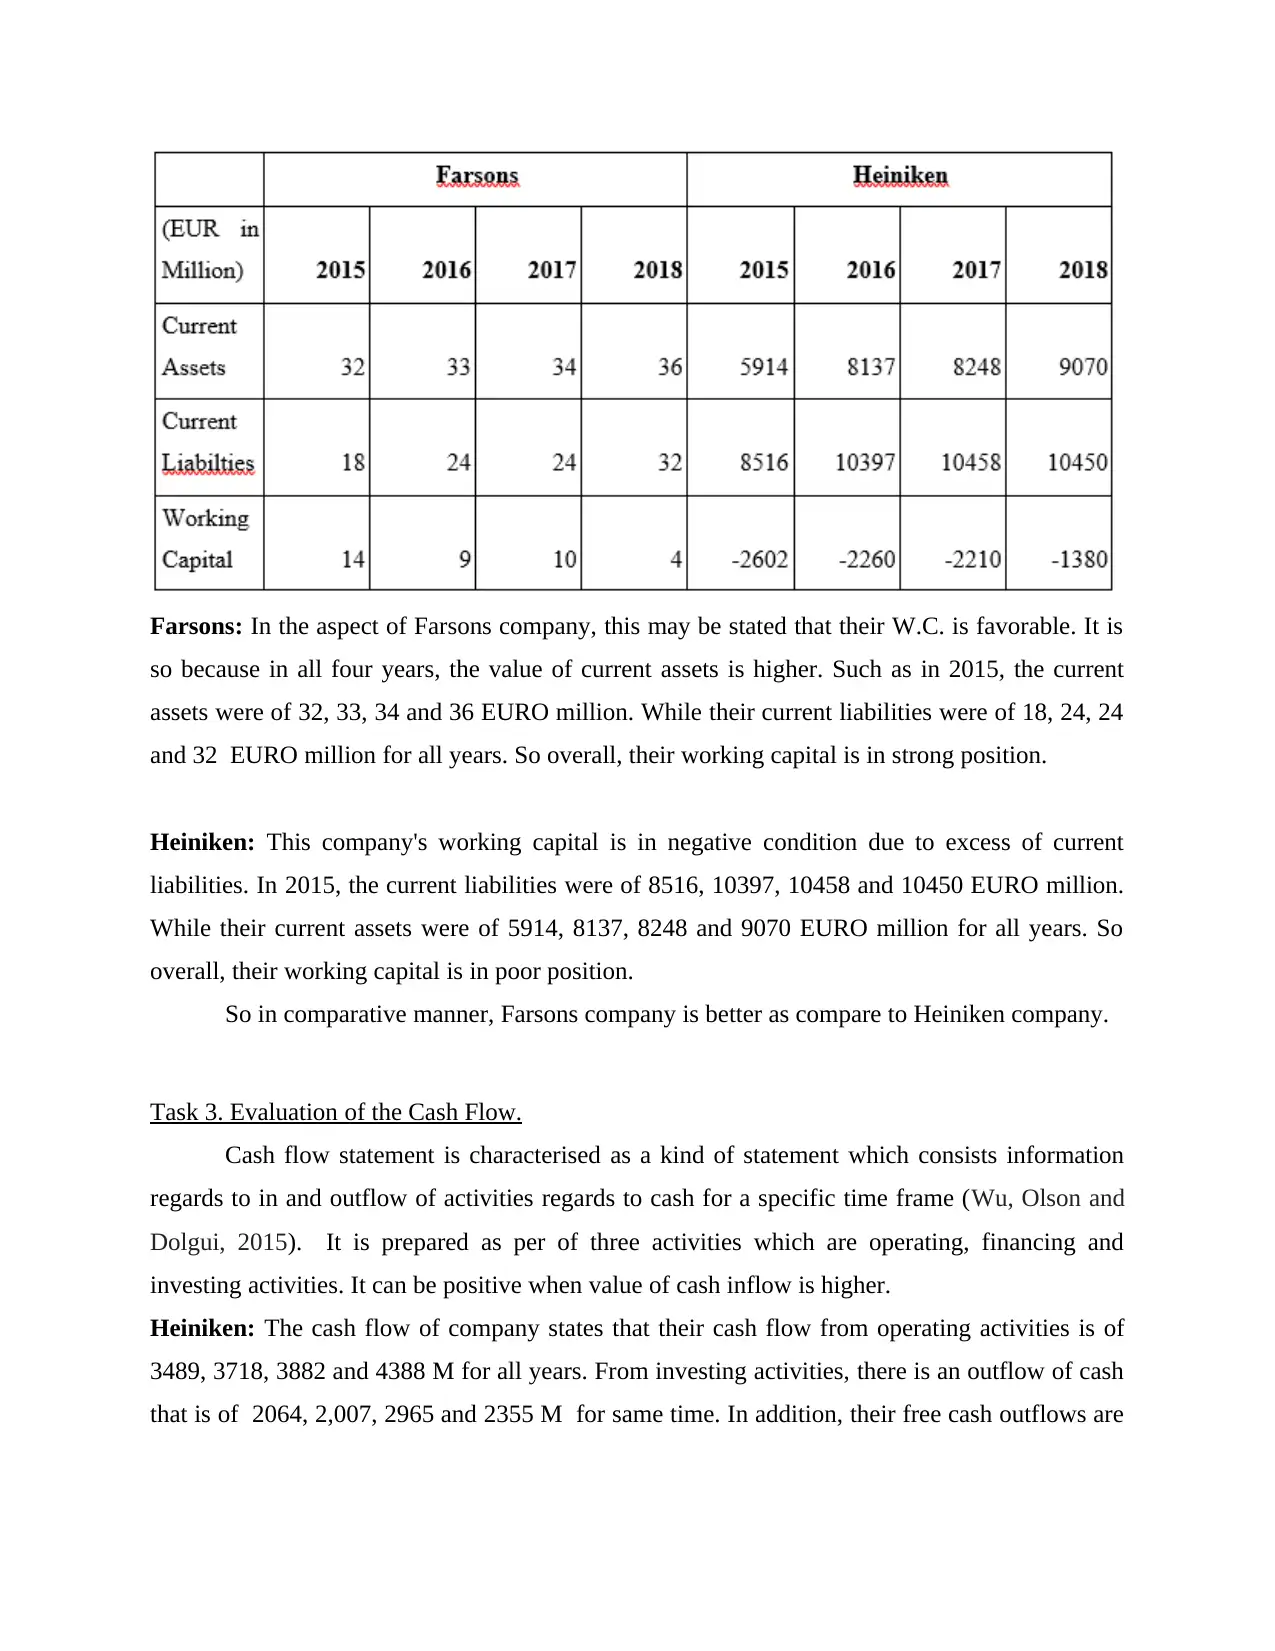
Farsons: In the aspect of Farsons company, this may be stated that their W.C. is favorable. It is
so because in all four years, the value of current assets is higher. Such as in 2015, the current
assets were of 32, 33, 34 and 36 EURO million. While their current liabilities were of 18, 24, 24
and 32 EURO million for all years. So overall, their working capital is in strong position.
Heiniken: This company's working capital is in negative condition due to excess of current
liabilities. In 2015, the current liabilities were of 8516, 10397, 10458 and 10450 EURO million.
While their current assets were of 5914, 8137, 8248 and 9070 EURO million for all years. So
overall, their working capital is in poor position.
So in comparative manner, Farsons company is better as compare to Heiniken company.
Task 3. Evaluation of the Cash Flow.
Cash flow statement is characterised as a kind of statement which consists information
regards to in and outflow of activities regards to cash for a specific time frame (Wu, Olson and
Dolgui, 2015). It is prepared as per of three activities which are operating, financing and
investing activities. It can be positive when value of cash inflow is higher.
Heiniken: The cash flow of company states that their cash flow from operating activities is of
3489, 3718, 3882 and 4388 M for all years. From investing activities, there is an outflow of cash
that is of 2064, 2,007, 2965 and 2355 M for same time. In addition, their free cash outflows are
⊘ This is a preview!⊘
Do you want full access?
Subscribe today to unlock all pages.
Trusted by 1+ million students worldwide
1 out of 24
Related Documents


Your All-in-One AI-Powered Toolkit for Academic Success.
+13062052269
info@desklib.com
Available 24*7 on WhatsApp / Email
![[object Object]](/_next/static/media/star-bottom.7253800d.svg)
Unlock your academic potential
Copyright © 2020–2025 A2Z Services. All Rights Reserved. Developed and managed by ZUCOL.