Financial Analysis Management & Enterprise: Assignment
31 Pages7584 Words54 Views
Added on 2021-02-20
Financial Analysis Management & Enterprise: Assignment
Added on 2021-02-20
ShareRelated Documents
Financial AnalysisManagement &Enterprise
Table of ContentsINTRODUCTION.......................................................................................................................................................................................1. Detailed vertical and horizontal analysis and ratio analysis of the financial statements ofSainsbury and Tesco Plc.........................................................................................................................................................................Importance of working capital analysis of companies prior to decision making..................................................................................Evaluation of cash flow statements ......................................................................................................................................................CONCLUSION..........................................................................................................................................................................................REFERENCES..........................................................................................................................................................................................APPENDIX ...............................................................................................................................................................................................
INTRODUCTIONFinancial analysis refers to a detailed study of each financial transactions of the company,summarising all those transactions and prepare the financial reports for the company in such away so that they could show the actual financial performance of the business to its stakeholders(Muda and et.al., 2018). Further, financial management is a process of evaluate overall financialperformance of the company compare it with its set objectives and goals and formulate plans andprocedures for the company so that the financial performance of the firm could be improved inthe competitive market. The present assignment shows a report made by a financial manager forAsian food manufacturer for the purpose providing recommendations to the company in contextto the most prospective client between Sainsbury and Tesco Plc. The report includes a detailed vertical and horizontal analysis of the company along withbrief comparision of both the companies on the basis of their financial statements. In addition tothis, the assignment also shows importance of the woring capital analysis of a firm in context totaking several decisions for the company. Further, the report also shows a critical analysis ofboth the companies on the basis of their cash flow or the liquidity position. At the end of report,it shows several statement showing financial performance of the company. 1. Detailed vertical and horizontal analysis and ratio analysis of the financial statements ofSainsbury and Tesco PlcProfitability ratio analysis GP ratioYear / companiesSainsburyTesco20166.19%5.24%20176.23%5.19%20186.61%5.83%20196.92%6.48%NP ratio Year / companiesSainsburyTesco
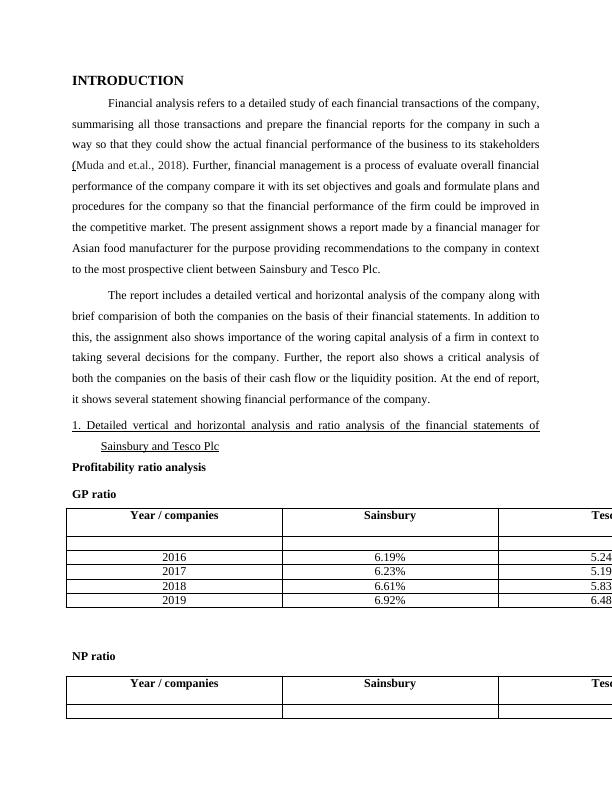
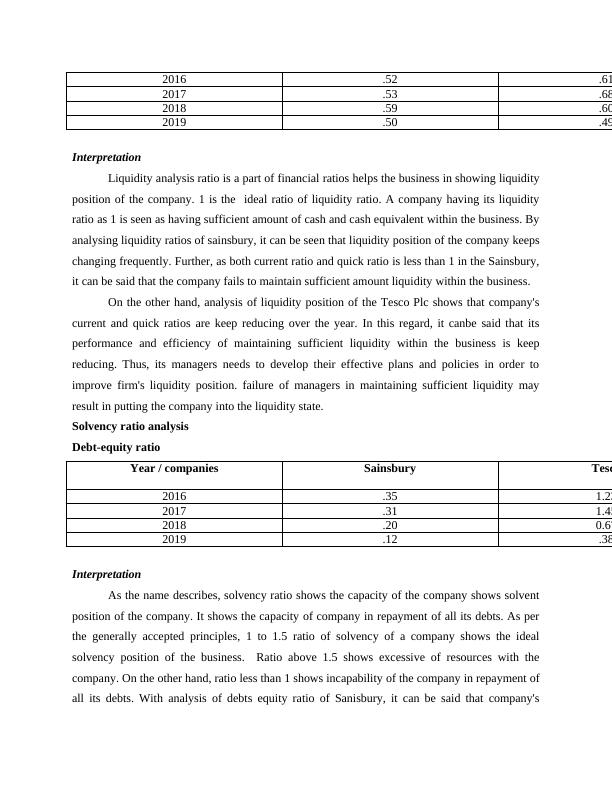
20162%.25%20171.44%-0.07%20181.09%2.10%2019.75%2.07%InterpretationProfitability ratio of a company shows profit generation capacity of the company from itsnormal course of business activities. This ration analysis covers Gross profit and net profitanalysis of the company (Wilson and Marrer, 2019). The gross profit shows ratio of profitgenerated by the business through its operating activities. On the other hand, net profit ratioshows amount of net profit generated by the business from both operating and non operatingactivities. By analysing the gross profit ratio of the company of Sainsbury, it can be seen that itscapacity of generating profits from the operations is increasing over the year. Although, the netprofit analysis of the company shows that its net profit is reducing over the year. It may causedue to inefficiency of its managers in developing strategies for the business in earning profitsfrom various activities other than its normal course. With evaluation of gross profits ratio, it can be seen that the company's capacity ofearning income from its normal course of business is increasing. Further, net profit ratio of thecompany also have an increasing trend. In this regard, it can be seen that company's capacity ofthe company in generating profits from both operating and non operating activities is increasingover the year. Liquidity ratio analysisCurrent ratio Year / companiesSainsburyTesco2016.66.752017.74.792018.76.712019.66.61Quick ratio Year / companiesSainsburyTesco
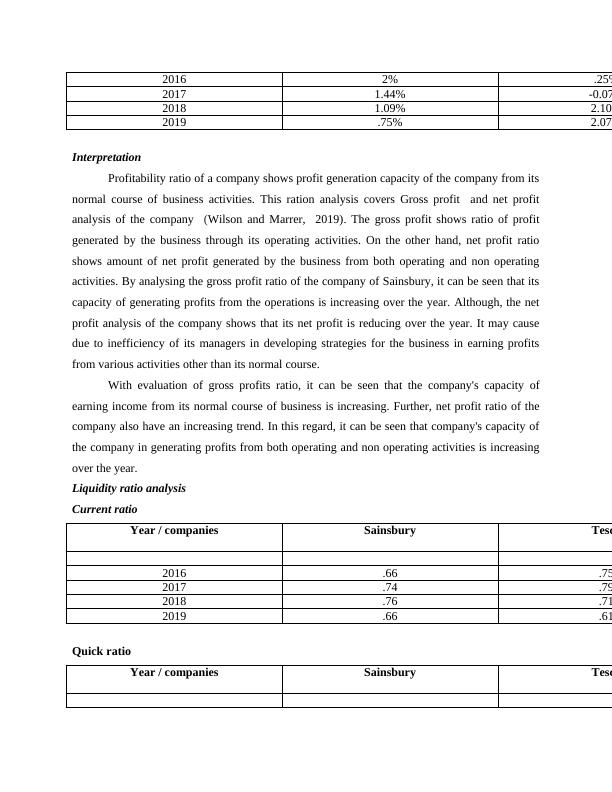
2016.52.612017.53.682018.59.602019.50.49InterpretationLiquidity analysis ratio is a part of financial ratios helps the business in showing liquidityposition of the company. 1 is the ideal ratio of liquidity ratio. A company having its liquidityratio as 1 is seen as having sufficient amount of cash and cash equivalent within the business. Byanalysing liquidity ratios of sainsbury, it can be seen that liquidity position of the company keepschanging frequently. Further, as both current ratio and quick ratio is less than 1 in the Sainsbury,it can be said that the company fails to maintain sufficient amount liquidity within the business.On the other hand, analysis of liquidity position of the Tesco Plc shows that company'scurrent and quick ratios are keep reducing over the year. In this regard, it canbe said that itsperformance and efficiency of maintaining sufficient liquidity within the business is keepreducing. Thus, its managers needs to develop their effective plans and policies in order toimprove firm's liquidity position. failure of managers in maintaining sufficient liquidity mayresult in putting the company into the liquidity state. Solvency ratio analysis Debt-equity ratio Year / companiesSainsburyTesco2016.351.232017.311.452018.200.672019.12.38InterpretationAs the name describes, solvency ratio shows the capacity of the company shows solventposition of the company. It shows the capacity of company in repayment of all its debts. As perthe generally accepted principles, 1 to 1.5 ratio of solvency of a company shows the idealsolvency position of the business. Ratio above 1.5 shows excessive of resources with thecompany. On the other hand, ratio less than 1 shows incapability of the company in repayment ofall its debts. With analysis of debts equity ratio of Sanisbury, it can be said that company's
position of repayment is keep reducing over the year. Whereas, Tesco's capacity of repayment isalso reducing over the year. Thus managers of both companies need to maintain strategies for thebusiness in improving its capacity of maintaining resources within the firm in repayment of allits debts. Efficiency ratio analysis Inventory turnover ratio Year / companiesSainsburyTesco201622.4419.15201717.9322.41201814.8323.73201914.4424.49Total assets turnover ratio Year / companiesSainsburyTesco20161.401.2420171.431.2520181.361.2720191.271.36Fixed assets turnover ratio Year / companiesSainsburyTesco20161.911.7820172.021.8820182.071.8720191.931.89InterpretationEfficiency ratios are being calculated in order to determine the efficiency of business inusing its various resources and generation of income from them. Higher the value of these ratiosshows higher level of efficiency of company in using its different assets (Lee and et.al., 2018).Different efficiency ratios such as fixed assets turnover ratio, inventory turnover ratio, etc. of
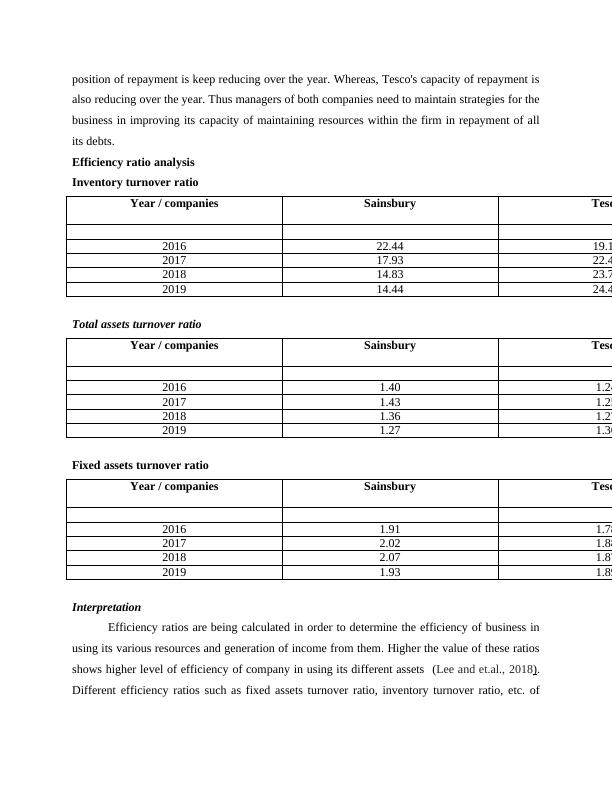
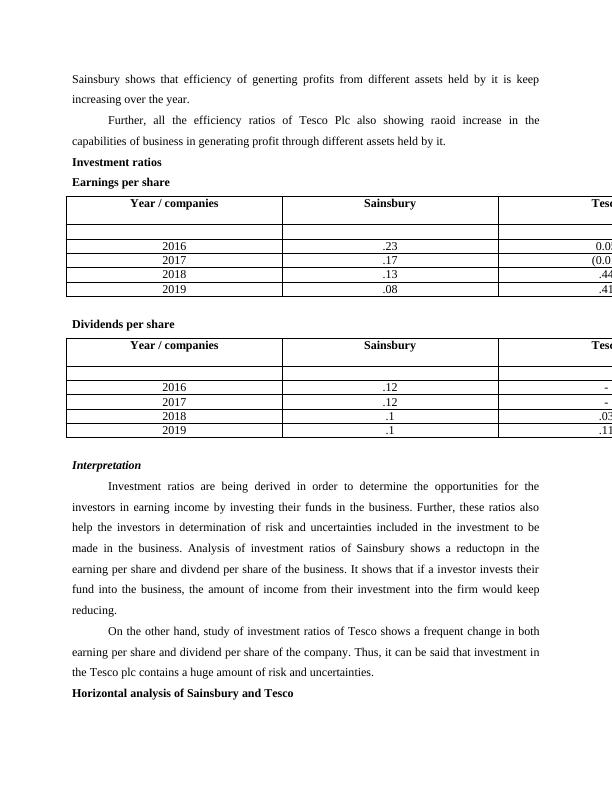
Sainsbury shows that efficiency of generting profits from different assets held by it is keepincreasing over the year. Further, all the efficiency ratios of Tesco Plc also showing raoid increase in thecapabilities of business in generating profit through different assets held by it.Investment ratiosEarnings per share Year / companiesSainsburyTesco2016.230.052017.17(0.01)2018.13.442019.08.41Dividends per share Year / companiesSainsburyTesco2016.12-2017.12-2018.1.032019.1.11InterpretationInvestment ratios are being derived in order to determine the opportunities for theinvestors in earning income by investing their funds in the business. Further, these ratios alsohelp the investors in determination of risk and uncertainties included in the investment to bemade in the business. Analysis of investment ratios of Sainsbury shows a reductopn in theearning per share and divdend per share of the business. It shows that if a investor invests theirfund into the business, the amount of income from their investment into the firm would keepreducing. On the other hand, study of investment ratios of Tesco shows a frequent change in bothearning per share and dividend per share of the company. Thus, it can be said that investment inthe Tesco plc contains a huge amount of risk and uncertainties.Horizontal analysis of Sainsbury and Tesco
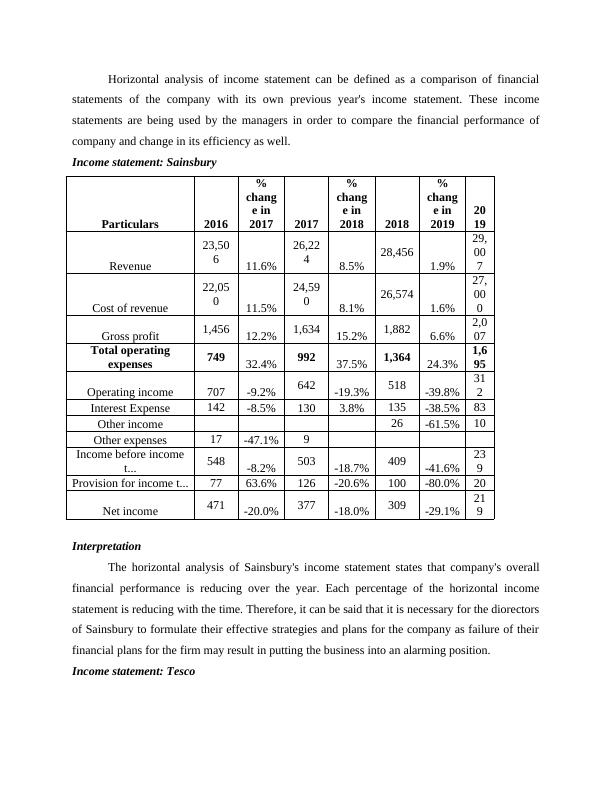
Horizontal analysis of income statement can be defined as a comparison of financialstatements of the company with its own previous year's income statement. These incomestatements are being used by the managers in order to compare the financial performance ofcompany and change in its efficiency as well. Income statement: Sainsbury Particulars 2016%change in20172017%change in20182018%change in20192019Revenue23,50611.6%26,2248.5%28,4561.9%29,007Cost of revenue22,05011.5%24,5908.1%26,5741.6%27,000Gross profit1,45612.2%1,63415.2%1,8826.6%2,007Total operatingexpenses74932.4%99237.5%1,36424.3%1,695Operating income707-9.2%642-19.3%518-39.8%312Interest Expense142-8.5%1303.8%135-38.5%83Other income 26-61.5%10Other expenses 17-47.1%9Income before incomet...548-8.2%503-18.7%409-41.6%239Provision for income t...7763.6%126-20.6%100-80.0%20Net income 471-20.0%377-18.0%309-29.1%219InterpretationThe horizontal analysis of Sainsbury's income statement states that company's overallfinancial performance is reducing over the year. Each percentage of the horizontal incomestatement is reducing with the time. Therefore, it can be said that it is necessary for the diorectorsof Sainsbury to formulate their effective strategies and plans for the company as failure of theirfinancial plans for the firm may result in putting the business into an alarming position. Income statement: Tesco
End of preview
Want to access all the pages? Upload your documents or become a member.
Related Documents
Financial Analysis Management And Enterpirse - Assignmentlg...
|25
|3947
|54
THE MANAGE FINANCIAL PERFORMANCElg...
|36
|9609
|13
Financial Analysis Assignment Sample (Doc)lg...
|21
|3864
|132
Financial Analysis and Management Assignment Samplelg...
|18
|4697
|44
Financial analysis and management enterprise (Doc)lg...
|22
|5808
|21
Financial Analysis Management & Enterprise Assignment Solutionlg...
|24
|4214
|19