Financial Analysis of Daimler and Tesla
26 Pages7329 Words63 Views
Added on 2023-01-12
About This Document
This study evaluates the performance of corporations Tesla and Daimler through systematic ratio analysis, vertical-analysis and horizontal analysis. It also includes a thorough analysis of the cash-position of both corporations and a comparison of their actual performances.
Financial Analysis of Daimler and Tesla
Added on 2023-01-12
ShareRelated Documents
Financial Analysis
Management &
Enterprise
Management &
Enterprise

Contents
INTRODUCTION...........................................................................................................................4
TASK...............................................................................................................................................4
Overview of corporations:......................................................................................................4
Evaluation of performance of corporations: Daimler and Tesla:...........................................5
Cash flow analysis:...............................................................................................................10
CONCLUSION..............................................................................................................................12
REFERENCES..............................................................................................................................14
APPENDIX....................................................................................................................................15

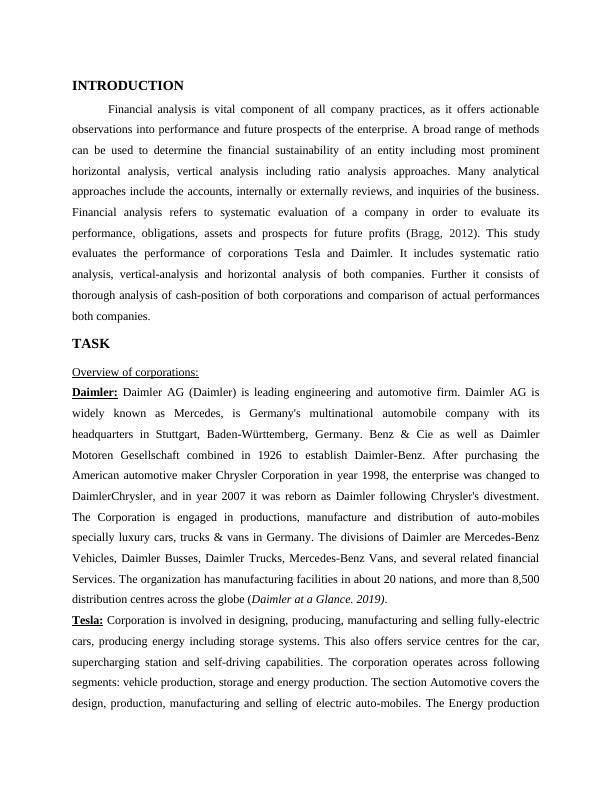
INTRODUCTION
Financial analysis is vital component of all company practices, as it offers actionable
observations into performance and future prospects of the enterprise. A broad range of methods
can be used to determine the financial sustainability of an entity including most prominent
horizontal analysis, vertical analysis including ratio analysis approaches. Many analytical
approaches include the accounts, internally or externally reviews, and inquiries of the business.
Financial analysis refers to systematic evaluation of a company in order to evaluate its
performance, obligations, assets and prospects for future profits (Bragg, 2012). This study
evaluates the performance of corporations Tesla and Daimler. It includes systematic ratio
analysis, vertical-analysis and horizontal analysis of both companies. Further it consists of
thorough analysis of cash-position of both corporations and comparison of actual performances
both companies.
TASK
Overview of corporations:
Daimler: Daimler AG (Daimler) is leading engineering and automotive firm. Daimler AG is
widely known as Mercedes, is Germany's multinational automobile company with its
headquarters in Stuttgart, Baden-Württemberg, Germany. Benz & Cie as well as Daimler
Motoren Gesellschaft combined in 1926 to establish Daimler-Benz. After purchasing the
American automotive maker Chrysler Corporation in year 1998, the enterprise was changed to
DaimlerChrysler, and in year 2007 it was reborn as Daimler following Chrysler's divestment.
The Corporation is engaged in productions, manufacture and distribution of auto-mobiles
specially luxury cars, trucks & vans in Germany. The divisions of Daimler are Mercedes-Benz
Vehicles, Daimler Busses, Daimler Trucks, Mercedes-Benz Vans, and several related financial
Services. The organization has manufacturing facilities in about 20 nations, and more than 8,500
distribution centres across the globe (Daimler at a Glance. 2019).
Tesla: Corporation is involved in designing, producing, manufacturing and selling fully-electric
cars, producing energy including storage systems. This also offers service centres for the car,
supercharging station and self-driving capabilities. The corporation operates across following
segments: vehicle production, storage and energy production. The section Automotive covers the
design, production, manufacturing and selling of electric auto-mobiles. The Energy production
and Storage section involves developing, producing, installing, selling and leasing stationary
power storage devices and solar power systems, as well as selling to consumers electricity
produced by solar power systems. It designs energy storage items to be used in residences,
company premises, and infrastructure sites (About us: Tesla. 2019).
Evaluation of performance of corporations: Daimler and Tesla:
Ratio Analysis of Daimler and Tesla:
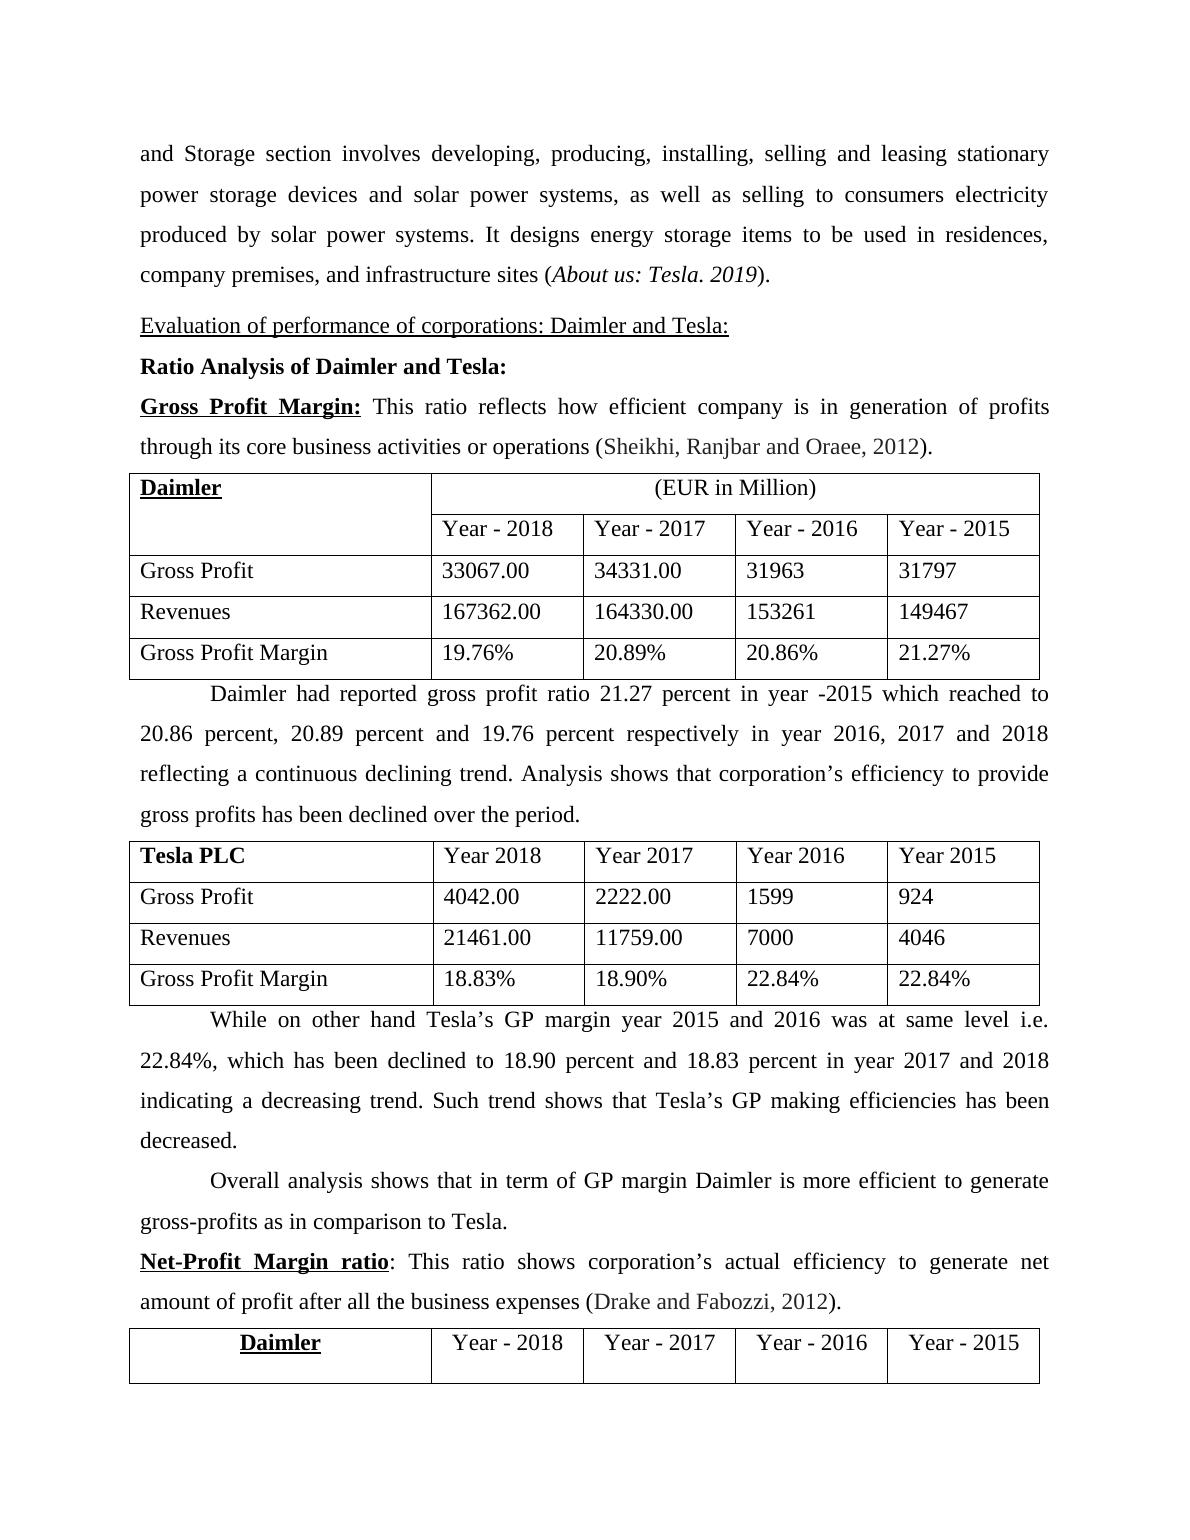
Gross Profit Margin: This ratio reflects how efficient company is in generation of profits
through its core business activities or operations (Sheikhi, Ranjbar and Oraee, 2012).
Daimler (EUR in Million)
Year - 2018 Year - 2017 Year - 2016 Year - 2015
Gross Profit 33067.00 34331.00 31963 31797
Revenues 167362.00 164330.00 153261 149467
Gross Profit Margin 19.76% 20.89% 20.86% 21.27%
Daimler had reported gross profit ratio 21.27 percent in year -2015 which reached to
20.86 percent, 20.89 percent and 19.76 percent respectively in year 2016, 2017 and 2018
reflecting a continuous declining trend. Analysis shows that corporation’s efficiency to provide
gross profits has been declined over the period.
Tesla PLC Year 2018 Year 2017 Year 2016 Year 2015
Gross Profit 4042.00 2222.00 1599 924
Revenues 21461.00 11759.00 7000 4046
Gross Profit Margin 18.83% 18.90% 22.84% 22.84%
While on other hand Tesla’s GP margin year 2015 and 2016 was at same level i.e.
22.84%, which has been declined to 18.90 percent and 18.83 percent in year 2017 and 2018
indicating a decreasing trend. Such trend shows that Tesla’s GP making efficiencies has been
decreased.
Overall analysis shows that in term of GP margin Daimler is more efficient to generate
gross-profits as in comparison to Tesla.
Net-Profit Margin ratio: This ratio shows corporation’s actual efficiency to generate net
amount of profit after all the business expenses (Drake and Fabozzi, 2012).
Daimler Year - 2018 Year - 2017 Year - 2016 Year - 2015
power storage devices and solar power systems, as well as selling to consumers electricity
produced by solar power systems. It designs energy storage items to be used in residences,
company premises, and infrastructure sites (About us: Tesla. 2019).
Evaluation of performance of corporations: Daimler and Tesla:
Ratio Analysis of Daimler and Tesla:
Gross Profit Margin: This ratio reflects how efficient company is in generation of profits
through its core business activities or operations (Sheikhi, Ranjbar and Oraee, 2012).
Daimler (EUR in Million)
Year - 2018 Year - 2017 Year - 2016 Year - 2015
Gross Profit 33067.00 34331.00 31963 31797
Revenues 167362.00 164330.00 153261 149467
Gross Profit Margin 19.76% 20.89% 20.86% 21.27%
Daimler had reported gross profit ratio 21.27 percent in year -2015 which reached to
20.86 percent, 20.89 percent and 19.76 percent respectively in year 2016, 2017 and 2018
reflecting a continuous declining trend. Analysis shows that corporation’s efficiency to provide
gross profits has been declined over the period.
Tesla PLC Year 2018 Year 2017 Year 2016 Year 2015
Gross Profit 4042.00 2222.00 1599 924
Revenues 21461.00 11759.00 7000 4046
Gross Profit Margin 18.83% 18.90% 22.84% 22.84%
While on other hand Tesla’s GP margin year 2015 and 2016 was at same level i.e.
22.84%, which has been declined to 18.90 percent and 18.83 percent in year 2017 and 2018
indicating a decreasing trend. Such trend shows that Tesla’s GP making efficiencies has been
decreased.
Overall analysis shows that in term of GP margin Daimler is more efficient to generate
gross-profits as in comparison to Tesla.
Net-Profit Margin ratio: This ratio shows corporation’s actual efficiency to generate net
amount of profit after all the business expenses (Drake and Fabozzi, 2012).
Daimler Year - 2018 Year - 2017 Year - 2016 Year - 2015
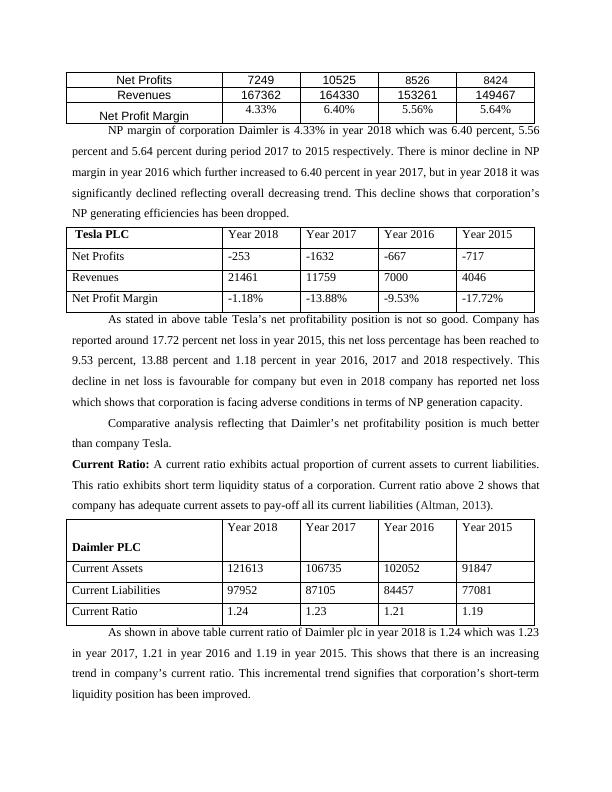
Net Profits 7249 10525 8526 8424
Revenues 167362 164330 153261 149467
Net Profit Margin 4.33% 6.40% 5.56% 5.64%
NP margin of corporation Daimler is 4.33% in year 2018 which was 6.40 percent, 5.56
percent and 5.64 percent during period 2017 to 2015 respectively. There is minor decline in NP
margin in year 2016 which further increased to 6.40 percent in year 2017, but in year 2018 it was
significantly declined reflecting overall decreasing trend. This decline shows that corporation’s
NP generating efficiencies has been dropped.
Tesla PLC Year 2018 Year 2017 Year 2016 Year 2015
Net Profits -253 -1632 -667 -717
Revenues 21461 11759 7000 4046
Net Profit Margin -1.18% -13.88% -9.53% -17.72%
As stated in above table Tesla’s net profitability position is not so good. Company has
reported around 17.72 percent net loss in year 2015, this net loss percentage has been reached to
9.53 percent, 13.88 percent and 1.18 percent in year 2016, 2017 and 2018 respectively. This
decline in net loss is favourable for company but even in 2018 company has reported net loss
which shows that corporation is facing adverse conditions in terms of NP generation capacity.
Comparative analysis reflecting that Daimler’s net profitability position is much better
than company Tesla.
Current Ratio: A current ratio exhibits actual proportion of current assets to current liabilities.
This ratio exhibits short term liquidity status of a corporation. Current ratio above 2 shows that
company has adequate current assets to pay-off all its current liabilities (Altman, 2013).
Daimler PLC
Year 2018 Year 2017 Year 2016 Year 2015
Current Assets 121613 106735 102052 91847
Current Liabilities 97952 87105 84457 77081
Current Ratio 1.24 1.23 1.21 1.19
As shown in above table current ratio of Daimler plc in year 2018 is 1.24 which was 1.23
in year 2017, 1.21 in year 2016 and 1.19 in year 2015. This shows that there is an increasing
trend in company’s current ratio. This incremental trend signifies that corporation’s short-term
liquidity position has been improved.
End of preview
Want to access all the pages? Upload your documents or become a member.
Related Documents
Financial Analysis of Daimler and Tesla: A Comparative Studylg...
|17
|4610
|25
Daimler AG Business Strategy - Reportlg...
|23
|6816
|888
Financial Analysis of Tesla and Daimlerlg...
|20
|5276
|23
Mercedes Benz PESTLE Analysislg...
|14
|3521
|69
Strategic Management of DAIMLERlg...
|20
|5647
|259
SWOT Analysis of Mercedes Benzlg...
|5
|693
|416