Mayer Holding Limited Stock Analysis
VerifiedAdded on 2020/05/16
|18
|2530
|241
AI Summary
This assignment requires an analysis of Mayer Holding Limited's stock performance. Students must calculate the average return for specific dates and determine the standard deviation. The assignment then focuses on calculating the required rate of return for the stock using the Capital Asset Pricing Model (CAPM), incorporating the risk-free rate, beta, and market risk premium.
Contribute Materials
Your contribution can guide someone’s learning journey. Share your
documents today.
RUNNING HEAD: Financial analysis of Myer Holdings Limited 1
Name of the student
Topic- Financial analysis of Myer Holdings Limited
University name
Name of the student
Topic- Financial analysis of Myer Holdings Limited
University name
Secure Best Marks with AI Grader
Need help grading? Try our AI Grader for instant feedback on your assignments.
Financial analysis of Myer Holdings Limited 2
Introduction
This report consists of the financial analysis of Myer Holdings Limited which
evaluates how well company has performed throughout the time. Ratio analysis, share price
movement analysis and other financial analysis tool have been used to determine the true
performance of Myer Holdings Limited.
1. Present description of the company
Myer Holdings Limited is an Australian Departmental stores chain trading in all Australian
states. The stock price of company is traded at MYR (ASX) A$ 0.64 0.00 (-0.78%). The CEO
of company is Richard who takes all the strategic decisions for the company.
2. Ownership and governance structure
The CEO of company is Richard who takes all the strategic decisions for the company
The Gary Barber is the key persons who work as manager of company (Mayer Holdings
Company, 2015).
Owner of company
Highland Capital management- owned 25% shares
Anchorage Capital Group –(owned 25% shares)
Solus Alternative Asset Management- owned (25%)
Other shareholders- Owned- 25% ( Mayer Holdings Company, 2017)
Financial analysis of Myer Holdings Limited 3
3. Performance ratio analysis of Myer Holding Limited
This ratio analysis is used to analysis the relation between two financial data of company
(Mayer Holdings Company, 2015).
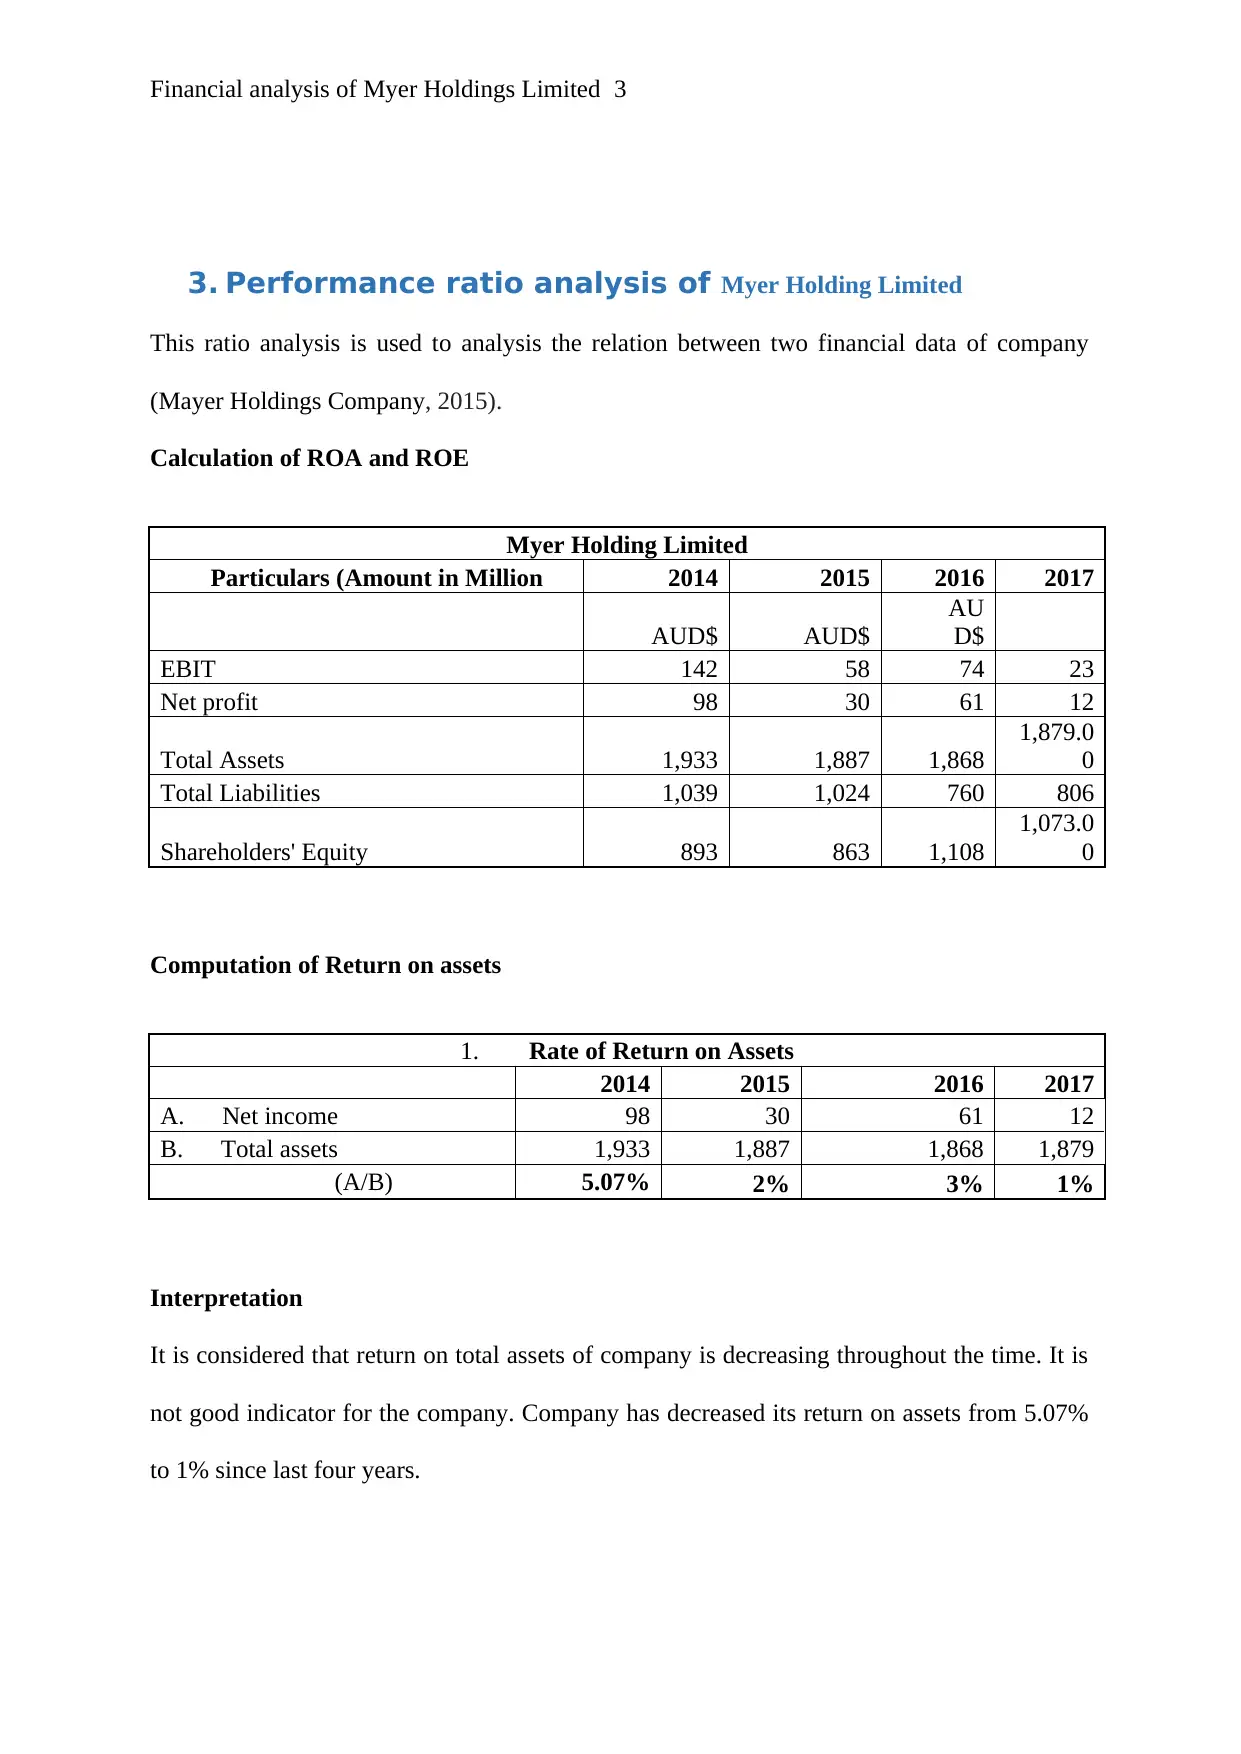
Calculation of ROA and ROE
Myer Holding Limited
Particulars (Amount in Million 2014 2015 2016 2017
AUD$ AUD$
AU
D$
EBIT 142 58 74 23
Net profit 98 30 61 12
Total Assets 1,933 1,887 1,868
1,879.0
0
Total Liabilities 1,039 1,024 760 806
Shareholders' Equity 893 863 1,108
1,073.0
0
Computation of Return on assets
1. Rate of Return on Assets
2014 2015 2016 2017
A. Net income 98 30 61 12
B. Total assets 1,933 1,887 1,868 1,879
(A/B) 5.07% 2% 3% 1%
Interpretation
It is considered that return on total assets of company is decreasing throughout the time. It is
not good indicator for the company. Company has decreased its return on assets from 5.07%
to 1% since last four years.
3. Performance ratio analysis of Myer Holding Limited
This ratio analysis is used to analysis the relation between two financial data of company
(Mayer Holdings Company, 2015).
Calculation of ROA and ROE
Myer Holding Limited
Particulars (Amount in Million 2014 2015 2016 2017
AUD$ AUD$
AU
D$
EBIT 142 58 74 23
Net profit 98 30 61 12
Total Assets 1,933 1,887 1,868
1,879.0
0
Total Liabilities 1,039 1,024 760 806
Shareholders' Equity 893 863 1,108
1,073.0
0
Computation of Return on assets
1. Rate of Return on Assets
2014 2015 2016 2017
A. Net income 98 30 61 12
B. Total assets 1,933 1,887 1,868 1,879
(A/B) 5.07% 2% 3% 1%
Interpretation
It is considered that return on total assets of company is decreasing throughout the time. It is
not good indicator for the company. Company has decreased its return on assets from 5.07%
to 1% since last four years.
Financial analysis of Myer Holdings Limited 4
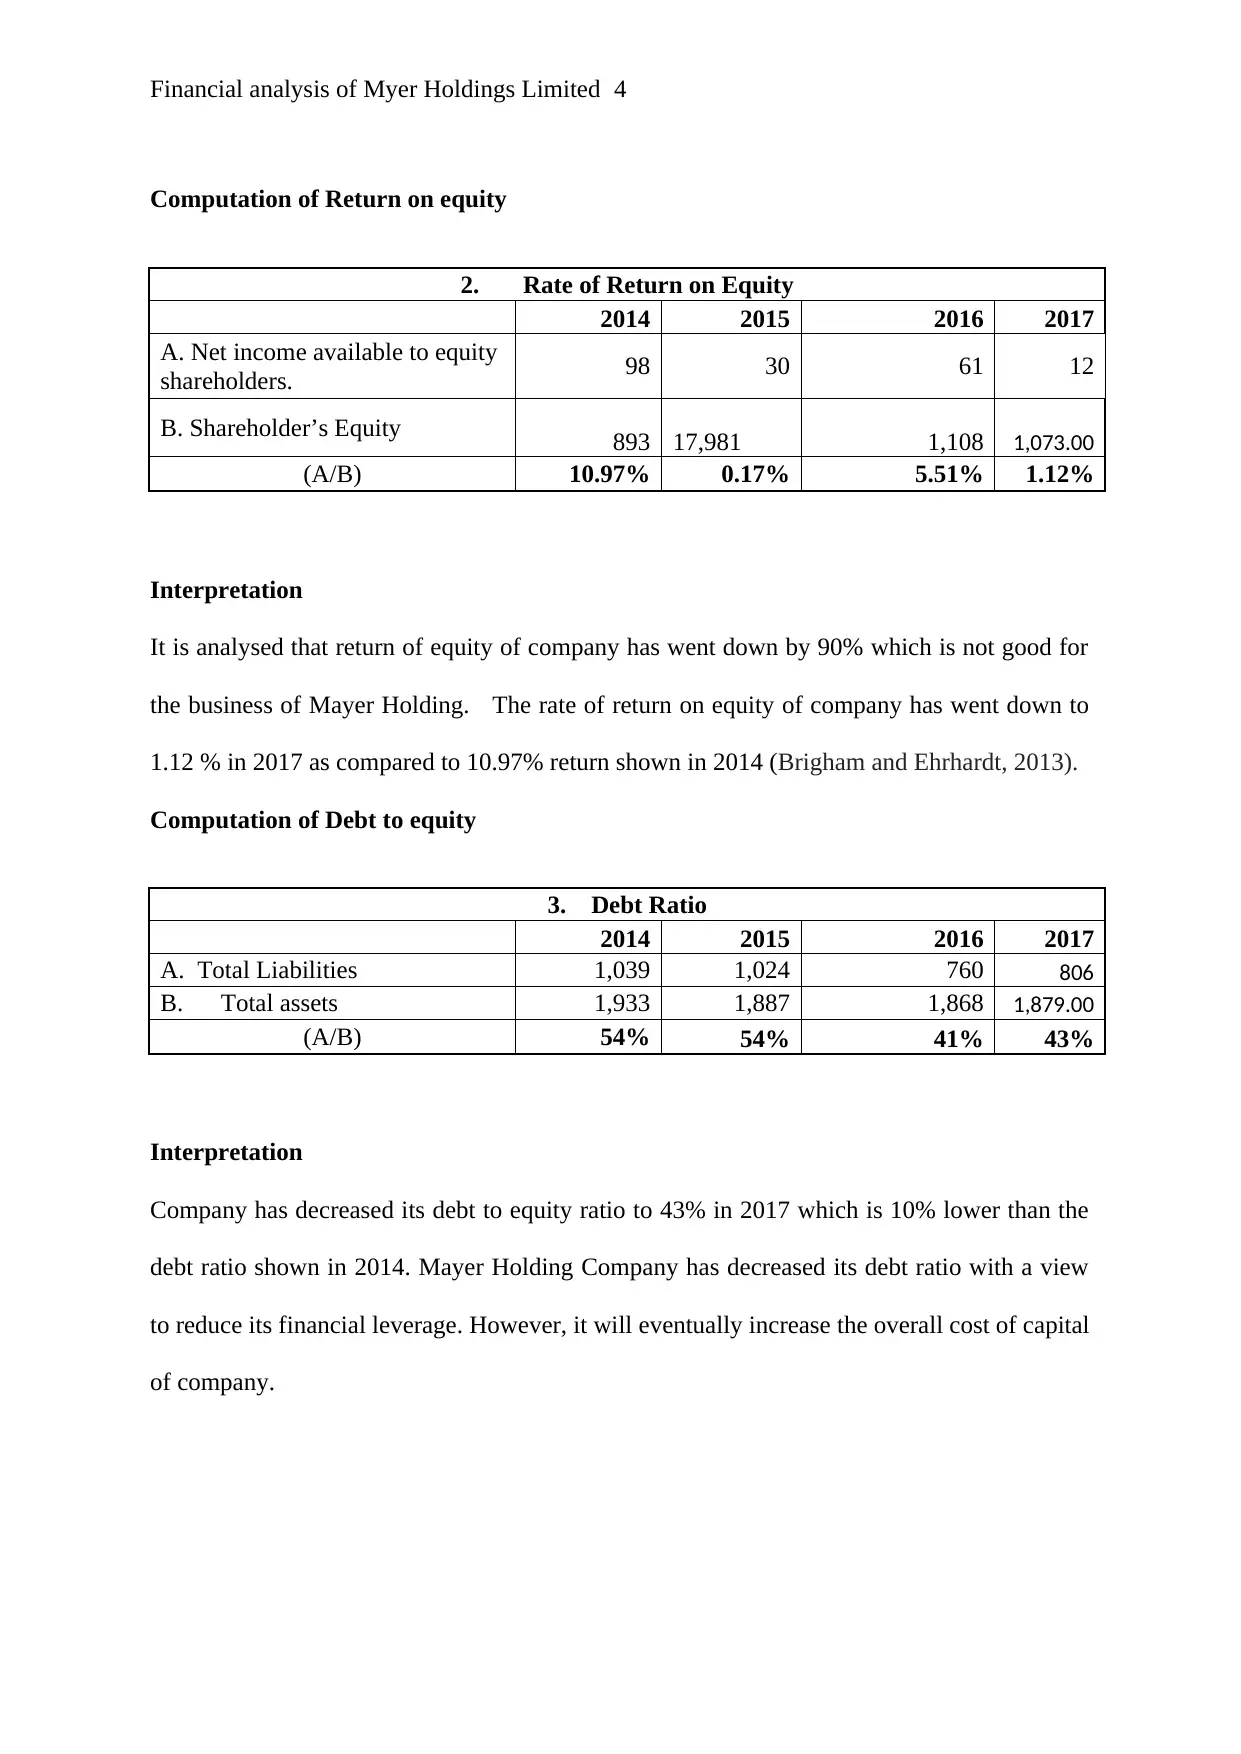
Computation of Return on equity
2. Rate of Return on Equity
2014 2015 2016 2017
A. Net income available to equity
shareholders. 98 30 61 12
B. Shareholder’s Equity 893 17,981 1,108 1,073.00
(A/B) 10.97% 0.17% 5.51% 1.12%
Interpretation
It is analysed that return of equity of company has went down by 90% which is not good for
the business of Mayer Holding. The rate of return on equity of company has went down to
1.12 % in 2017 as compared to 10.97% return shown in 2014 (Brigham and Ehrhardt, 2013).
Computation of Debt to equity
3. Debt Ratio
2014 2015 2016 2017
A. Total Liabilities 1,039 1,024 760 806
B. Total assets 1,933 1,887 1,868 1,879.00
(A/B) 54% 54% 41% 43%
Interpretation
Company has decreased its debt to equity ratio to 43% in 2017 which is 10% lower than the
debt ratio shown in 2014. Mayer Holding Company has decreased its debt ratio with a view
to reduce its financial leverage. However, it will eventually increase the overall cost of capital
of company.
Secure Best Marks with AI Grader
Need help grading? Try our AI Grader for instant feedback on your assignments.
Financial analysis of Myer Holdings Limited 5
Proving the equation
This equation is done with a view to satisfy both sides of formula.
EBIT
TA X NPAT
EBIT X TA
OE = NPAT
OE
Providing equation
20
14 2015 2016 2017
Net profit After tax/OE
0.1097
4 0.034762457
0.0550
5
0.0111
8
EBIT/TA*NPAT/EBIT*TA/OE
0.1097
4 0.034762457
0.0550
5
0.0111
8
(Please see the excel sheet for the proper calculation)
This equation hence proofed the calculation given above is true and fair.
4. Movements in the share prices
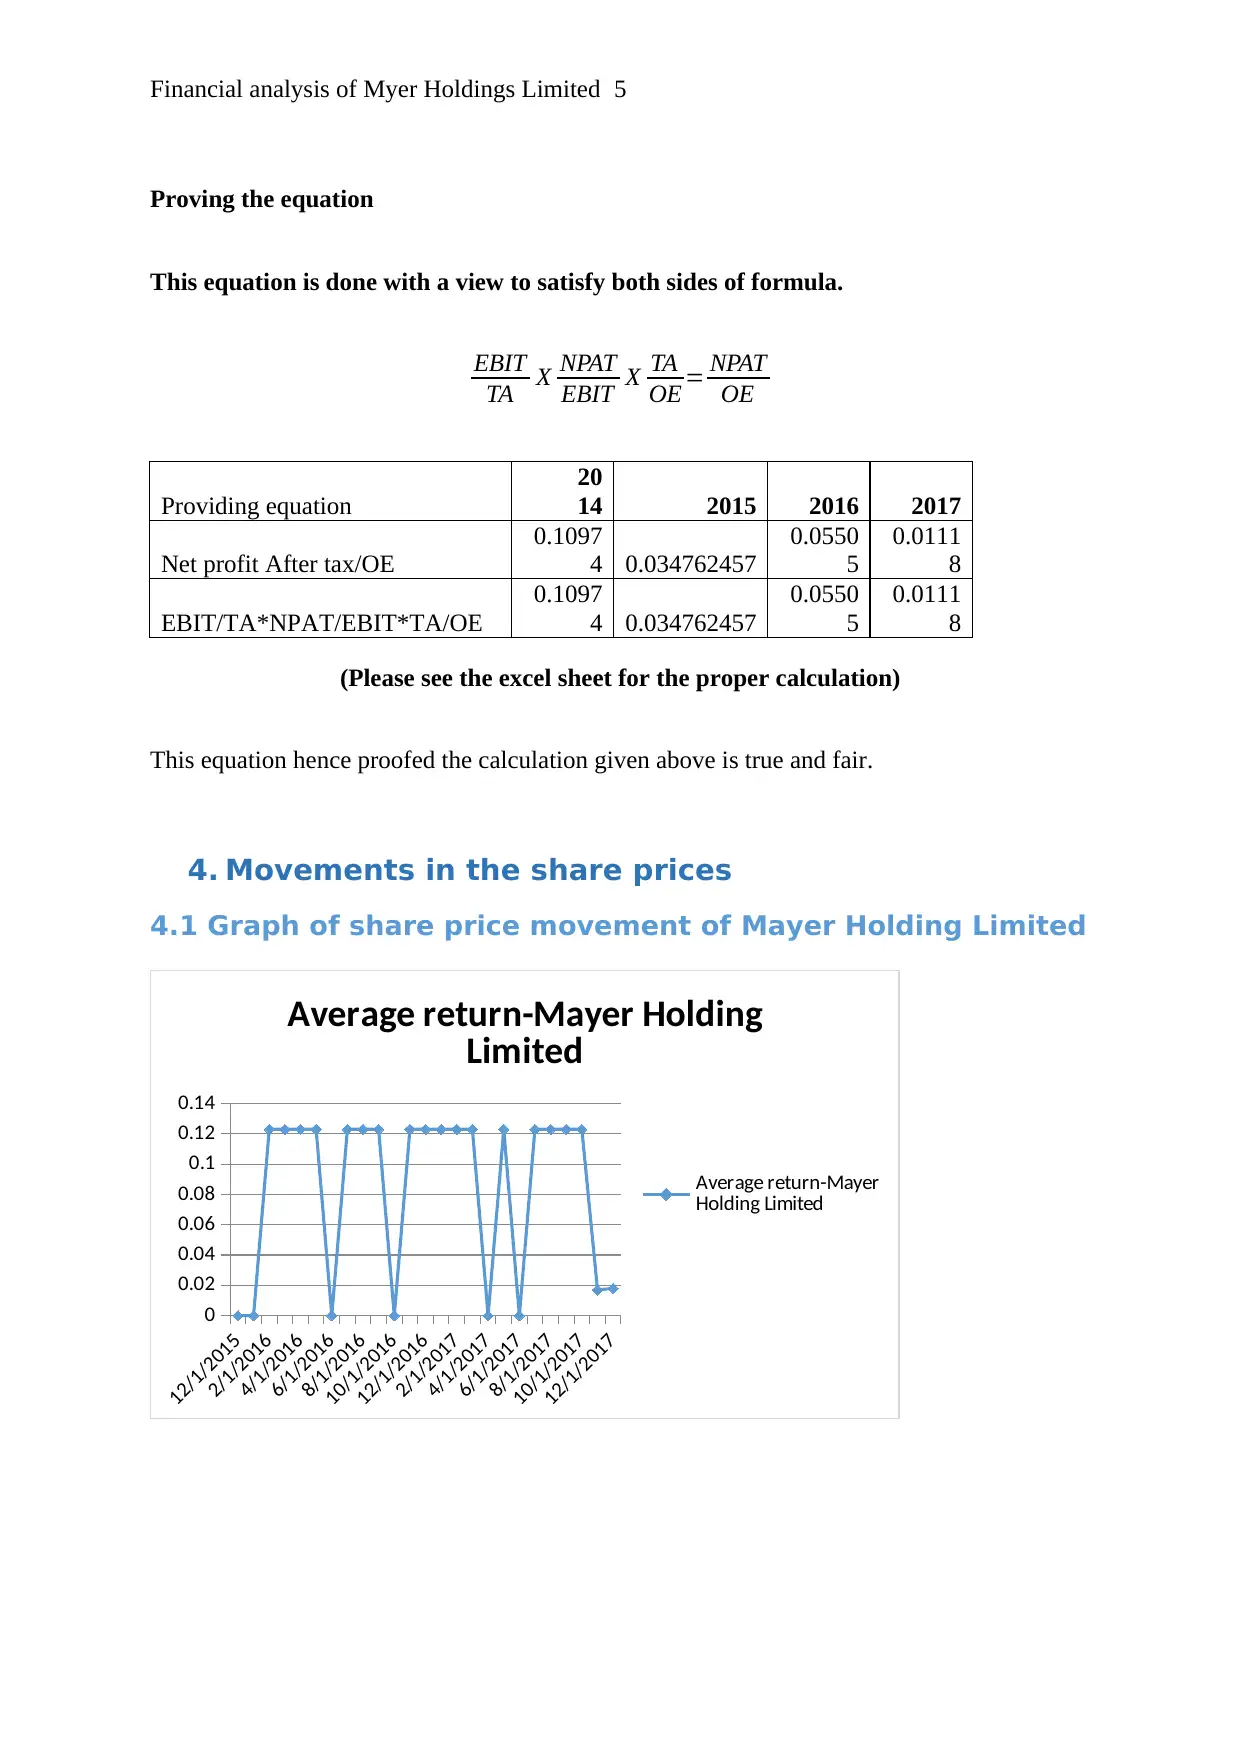
4.1 Graph of share price movement of Mayer Holding Limited
12/1/2015
2/1/2016
4/1/2016
6/1/2016
8/1/2016
10/1/2016
12/1/2016
2/1/2017
4/1/2017
6/1/2017
8/1/2017
10/1/2017
12/1/2017
0
0.02
0.04
0.06
0.08
0.1
0.12
0.14
Average return-Mayer Holding
Limited
Average return-Mayer
Holding Limited
Proving the equation
This equation is done with a view to satisfy both sides of formula.
EBIT
TA X NPAT
EBIT X TA
OE = NPAT
OE
Providing equation
20
14 2015 2016 2017
Net profit After tax/OE
0.1097
4 0.034762457
0.0550
5
0.0111
8
EBIT/TA*NPAT/EBIT*TA/OE
0.1097
4 0.034762457
0.0550
5
0.0111
8
(Please see the excel sheet for the proper calculation)
This equation hence proofed the calculation given above is true and fair.
4. Movements in the share prices
4.1 Graph of share price movement of Mayer Holding Limited
12/1/2015
2/1/2016
4/1/2016
6/1/2016
8/1/2016
10/1/2016
12/1/2016
2/1/2017
4/1/2017
6/1/2017
8/1/2017
10/1/2017
12/1/2017
0
0.02
0.04
0.06
0.08
0.1
0.12
0.14
Average return-Mayer Holding
Limited
Average return-Mayer
Holding Limited
Financial analysis of Myer Holdings Limited 6
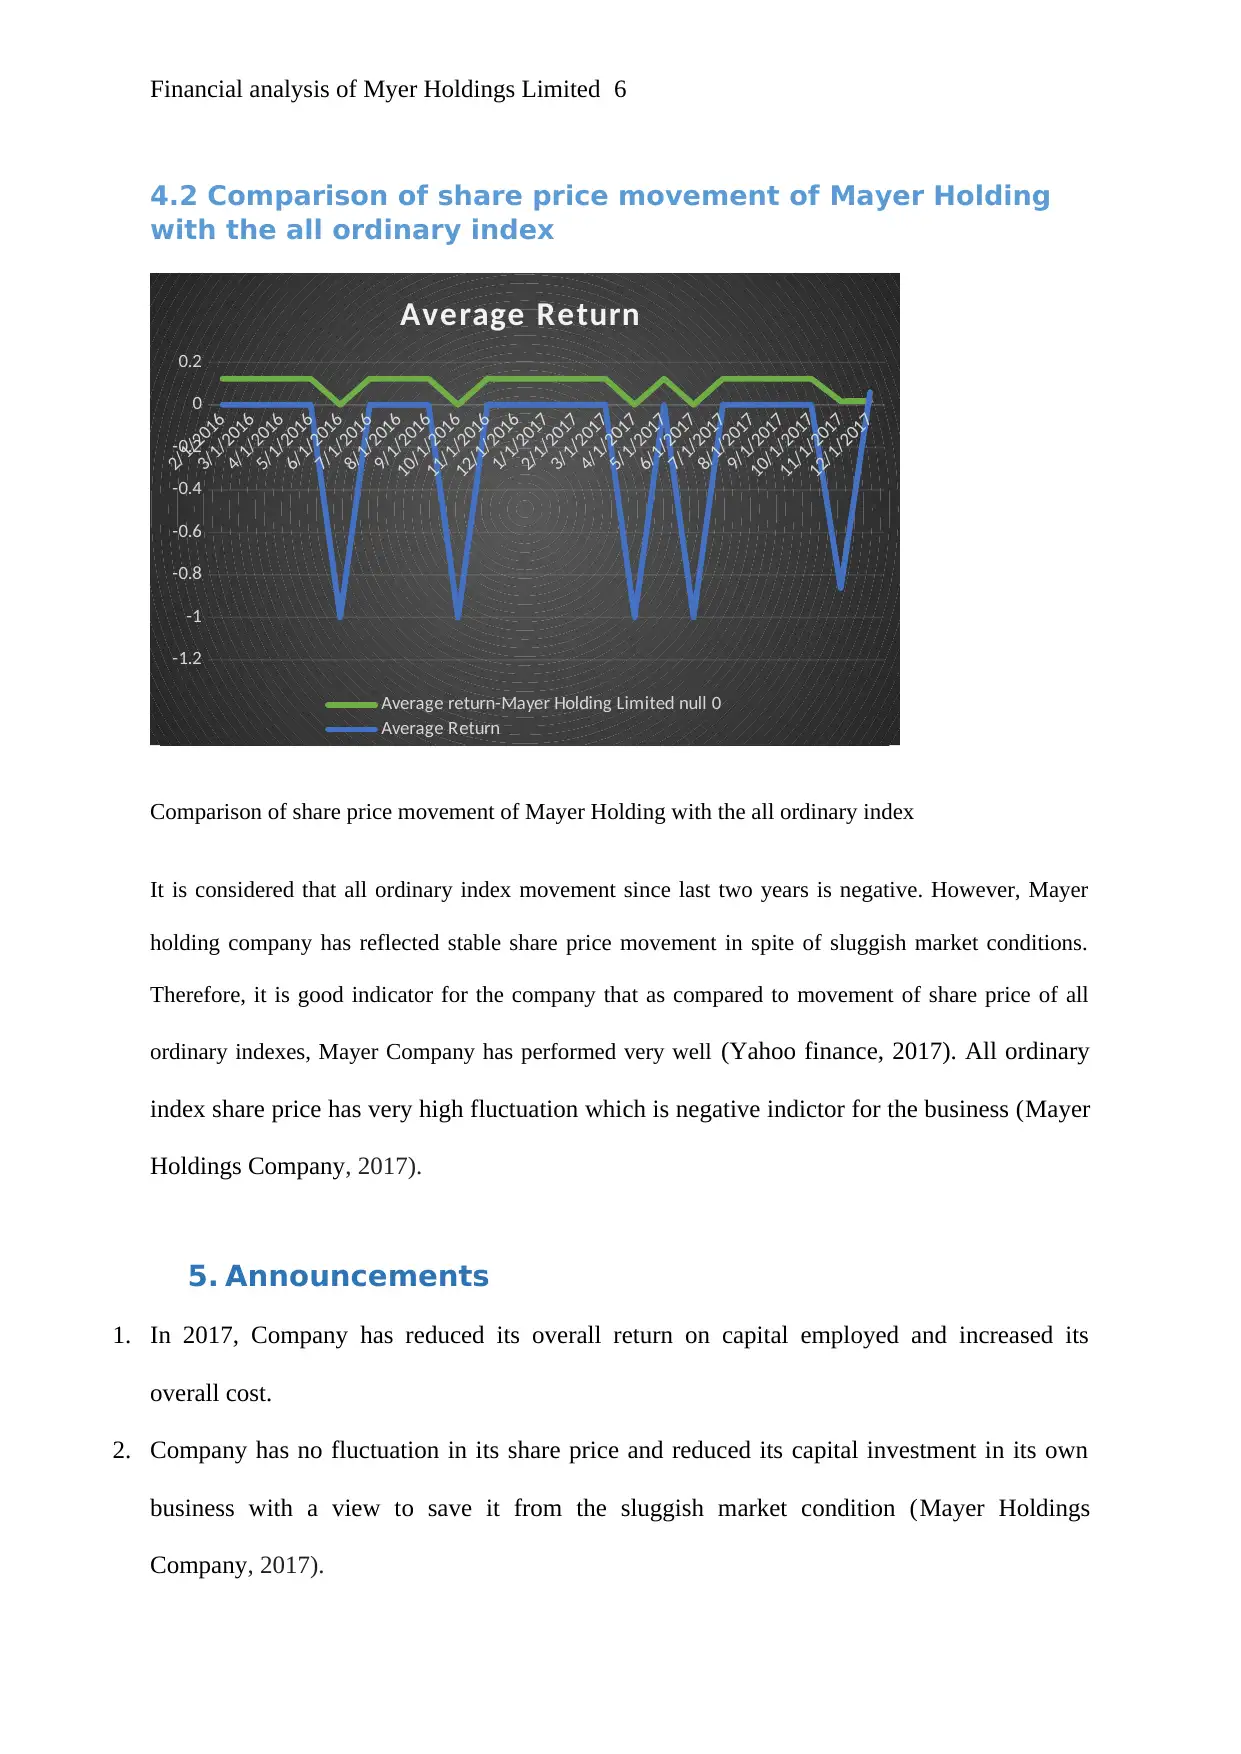
4.2 Comparison of share price movement of Mayer Holding
with the all ordinary index
2/1/2016
3/1/2016
4/1/2016
5/1/2016
6/1/2016
7/1/2016
8/1/2016
9/1/2016
10/1/2016
11/1/2016
12/1/2016
1/1/2017
2/1/2017
3/1/2017
4/1/2017
5/1/2017
6/1/2017
7/1/2017
8/1/2017
9/1/2017
10/1/2017
11/1/2017
12/1/2017
-1.2
-1
-0.8
-0.6
-0.4
-0.2
0
0.2
Average Return
Average return-Mayer Holding Limited null 0
Average Return
Comparison of share price movement of Mayer Holding with the all ordinary index
It is considered that all ordinary index movement since last two years is negative. However, Mayer
holding company has reflected stable share price movement in spite of sluggish market conditions.
Therefore, it is good indicator for the company that as compared to movement of share price of all
ordinary indexes, Mayer Company has performed very well (Yahoo finance, 2017). All ordinary
index share price has very high fluctuation which is negative indictor for the business (Mayer
Holdings Company, 2017).
5. Announcements
1. In 2017, Company has reduced its overall return on capital employed and increased its
overall cost.
2. Company has no fluctuation in its share price and reduced its capital investment in its own
business with a view to save it from the sluggish market condition (Mayer Holdings
Company, 2017).
Financial analysis of Myer Holdings Limited 7
6. Research via internet
Stock information and Beta valuation
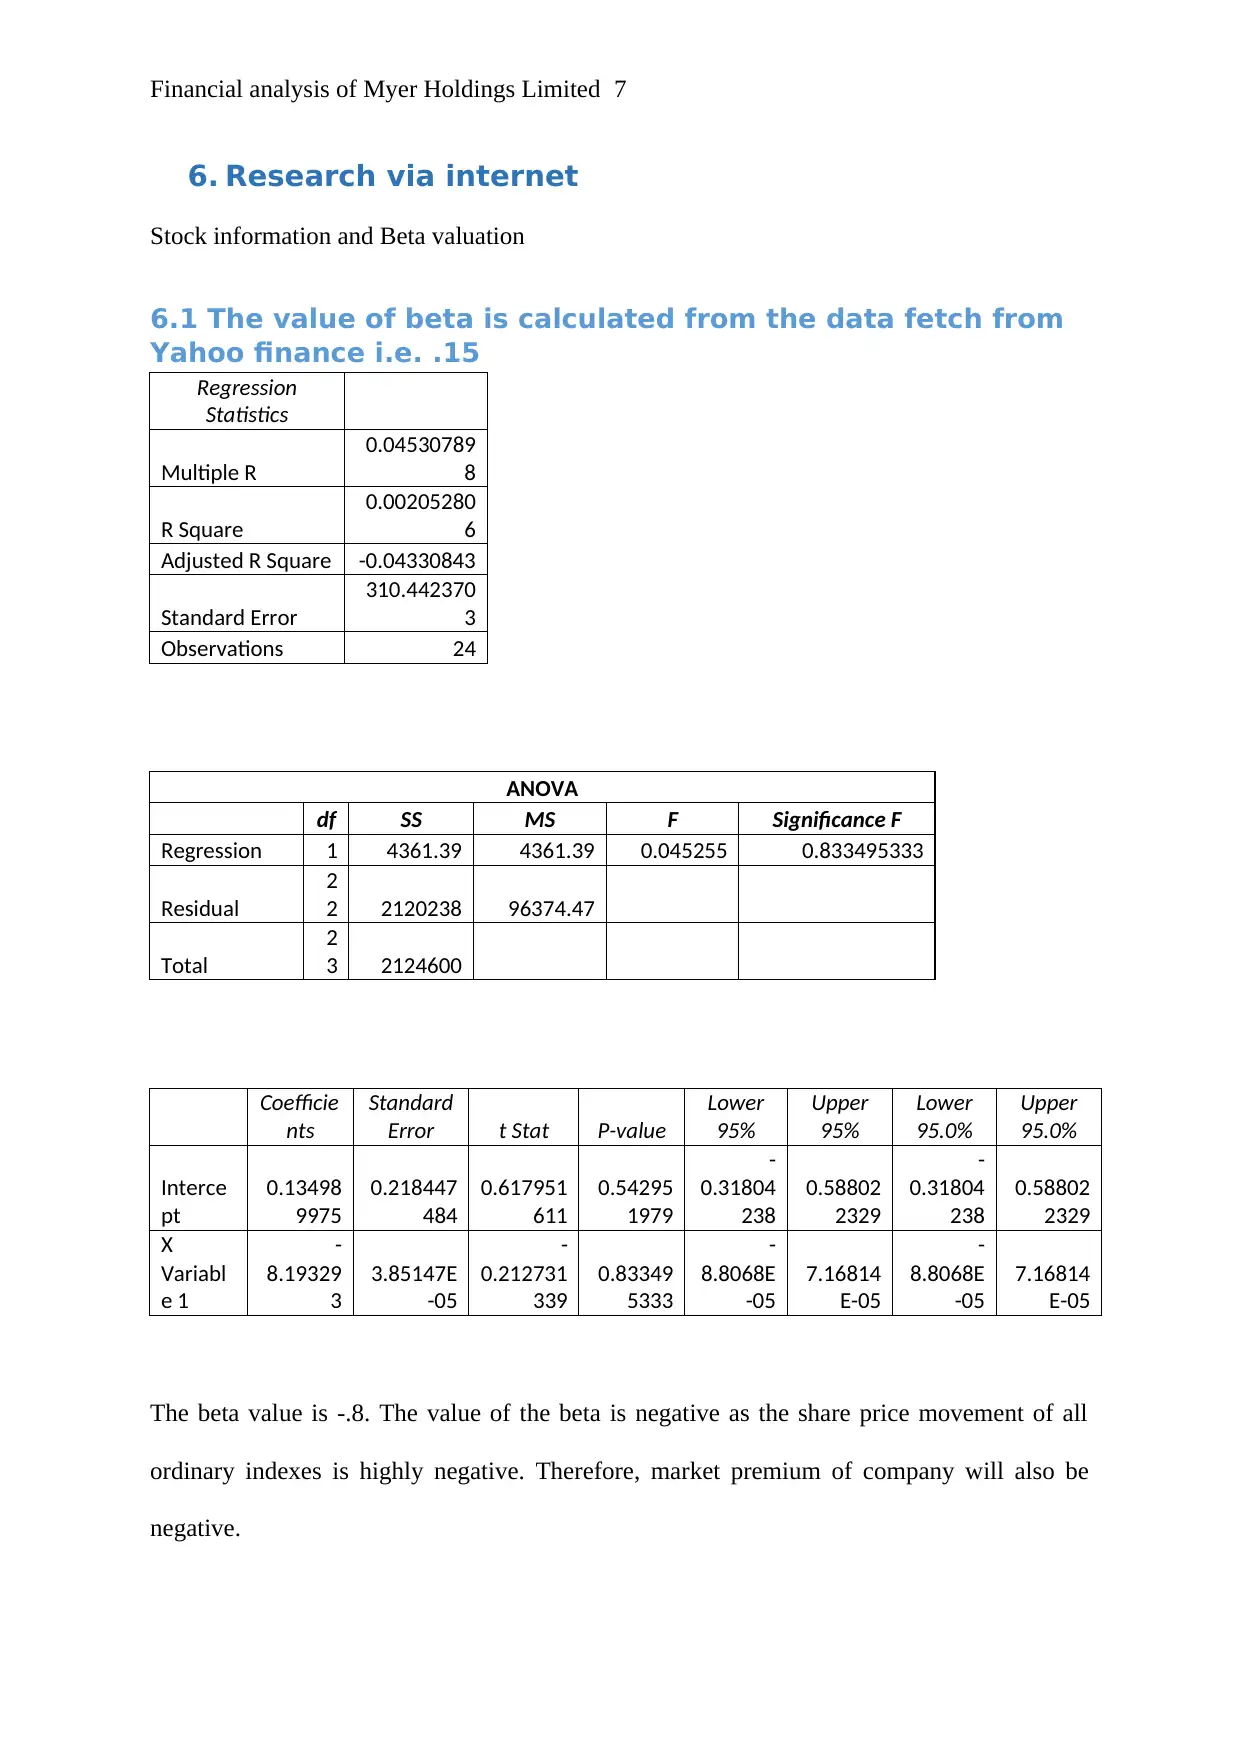
6.1 The value of beta is calculated from the data fetch from
Yahoo finance i.e. .15
Regression
Statistics
Multiple R
0.04530789
8
R Square
0.00205280
6
Adjusted R Square -0.04330843
Standard Error
310.442370
3
Observations 24
ANOVA
df SS MS F Significance F
Regression 1 4361.39 4361.39 0.045255 0.833495333
Residual
2
2 2120238 96374.47
Total
2
3 2124600
Coefficie
nts
Standard
Error t Stat P-value
Lower
95%
Upper
95%
Lower
95.0%
Upper
95.0%
Interce
pt
0.13498
9975
0.218447
484
0.617951
611
0.54295
1979
-
0.31804
238
0.58802
2329
-
0.31804
238
0.58802
2329
X
Variabl
e 1
-
8.19329
3
3.85147E
-05
-
0.212731
339
0.83349
5333
-
8.8068E
-05
7.16814
E-05
-
8.8068E
-05
7.16814
E-05
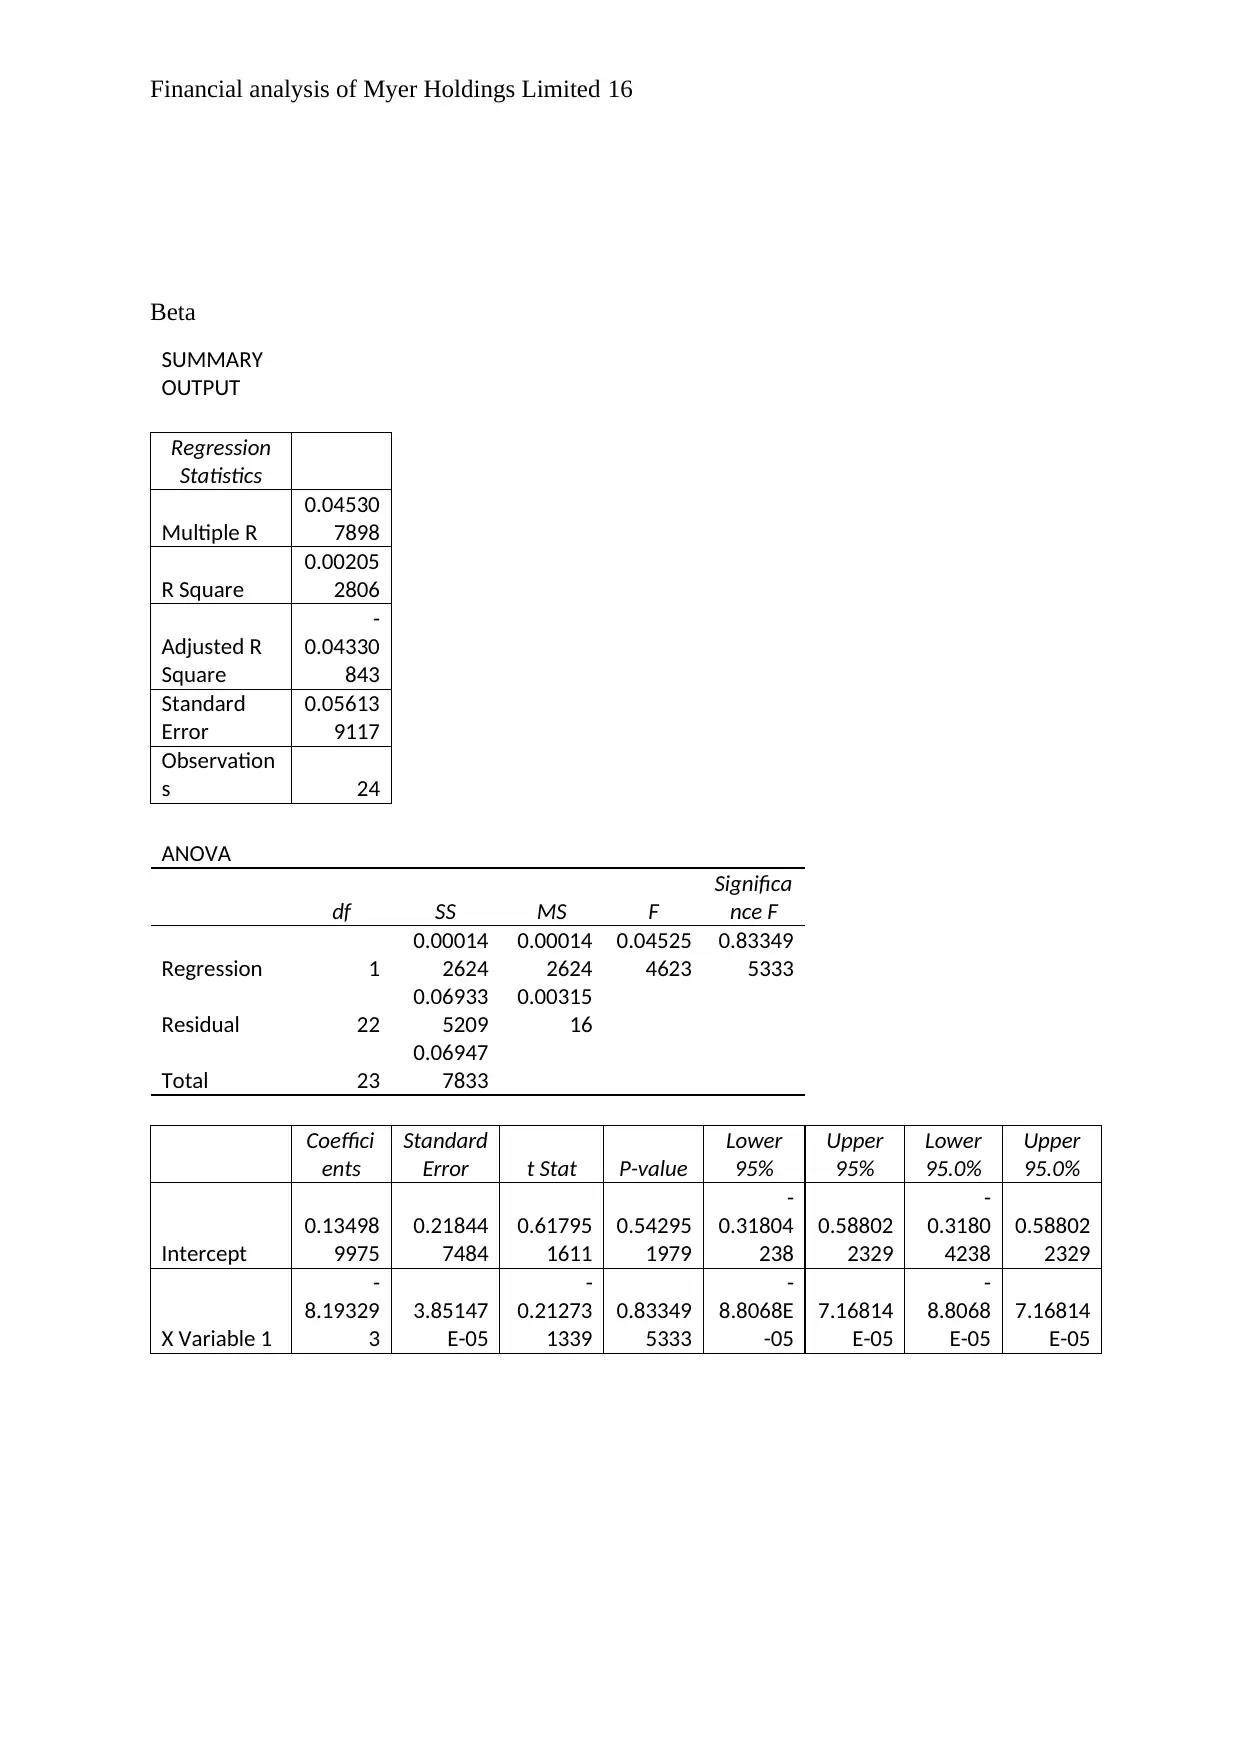
The beta value is -.8. The value of the beta is negative as the share price movement of all
ordinary indexes is highly negative. Therefore, market premium of company will also be
negative.
6. Research via internet
Stock information and Beta valuation
6.1 The value of beta is calculated from the data fetch from
Yahoo finance i.e. .15
Regression
Statistics
Multiple R
0.04530789
8
R Square
0.00205280
6
Adjusted R Square -0.04330843
Standard Error
310.442370
3
Observations 24
ANOVA
df SS MS F Significance F
Regression 1 4361.39 4361.39 0.045255 0.833495333
Residual
2
2 2120238 96374.47
Total
2
3 2124600
Coefficie
nts
Standard
Error t Stat P-value
Lower
95%
Upper
95%
Lower
95.0%
Upper
95.0%
Interce
pt
0.13498
9975
0.218447
484
0.617951
611
0.54295
1979
-
0.31804
238
0.58802
2329
-
0.31804
238
0.58802
2329
X
Variabl
e 1
-
8.19329
3
3.85147E
-05
-
0.212731
339
0.83349
5333
-
8.8068E
-05
7.16814
E-05
-
8.8068E
-05
7.16814
E-05
The beta value is -.8. The value of the beta is negative as the share price movement of all
ordinary indexes is highly negative. Therefore, market premium of company will also be
negative.
Paraphrase This Document
Need a fresh take? Get an instant paraphrase of this document with our AI Paraphraser
Financial analysis of Myer Holdings Limited 8
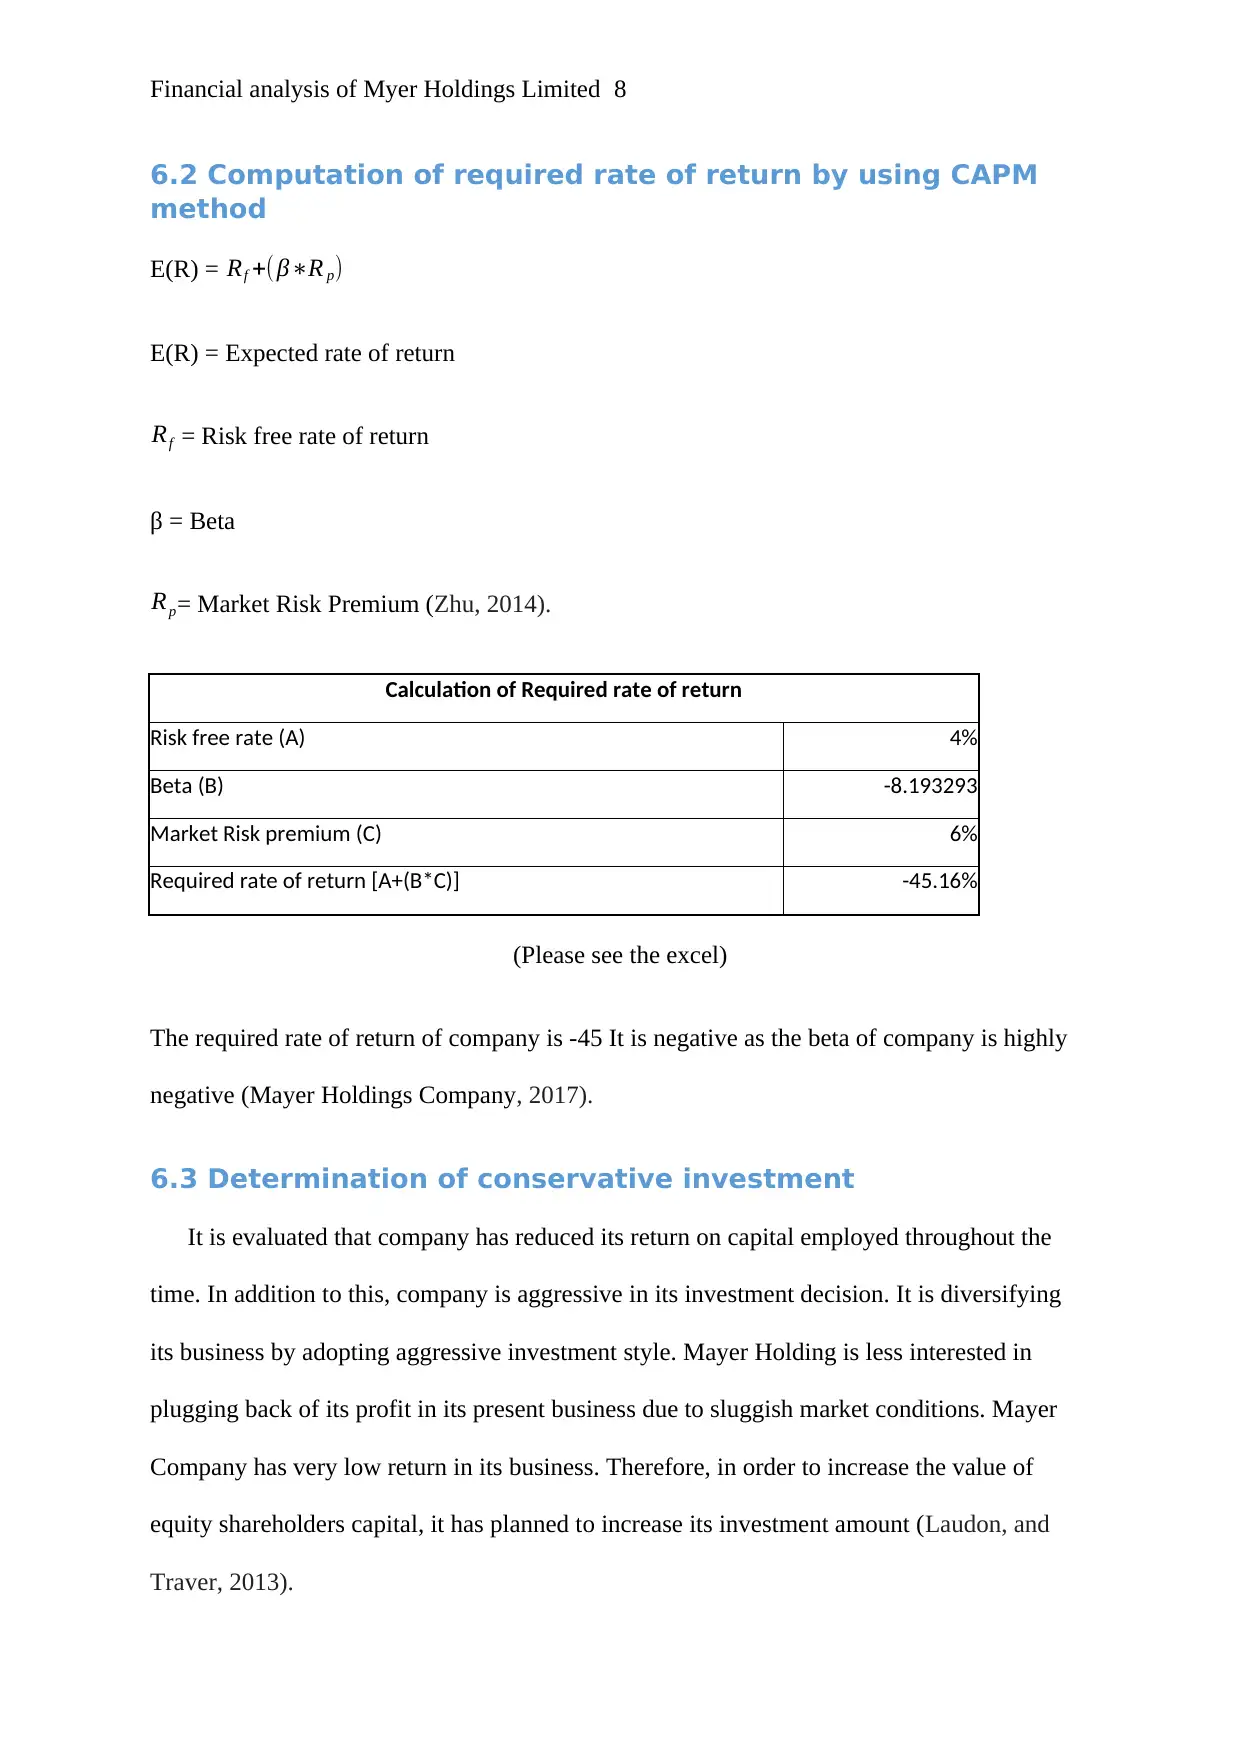
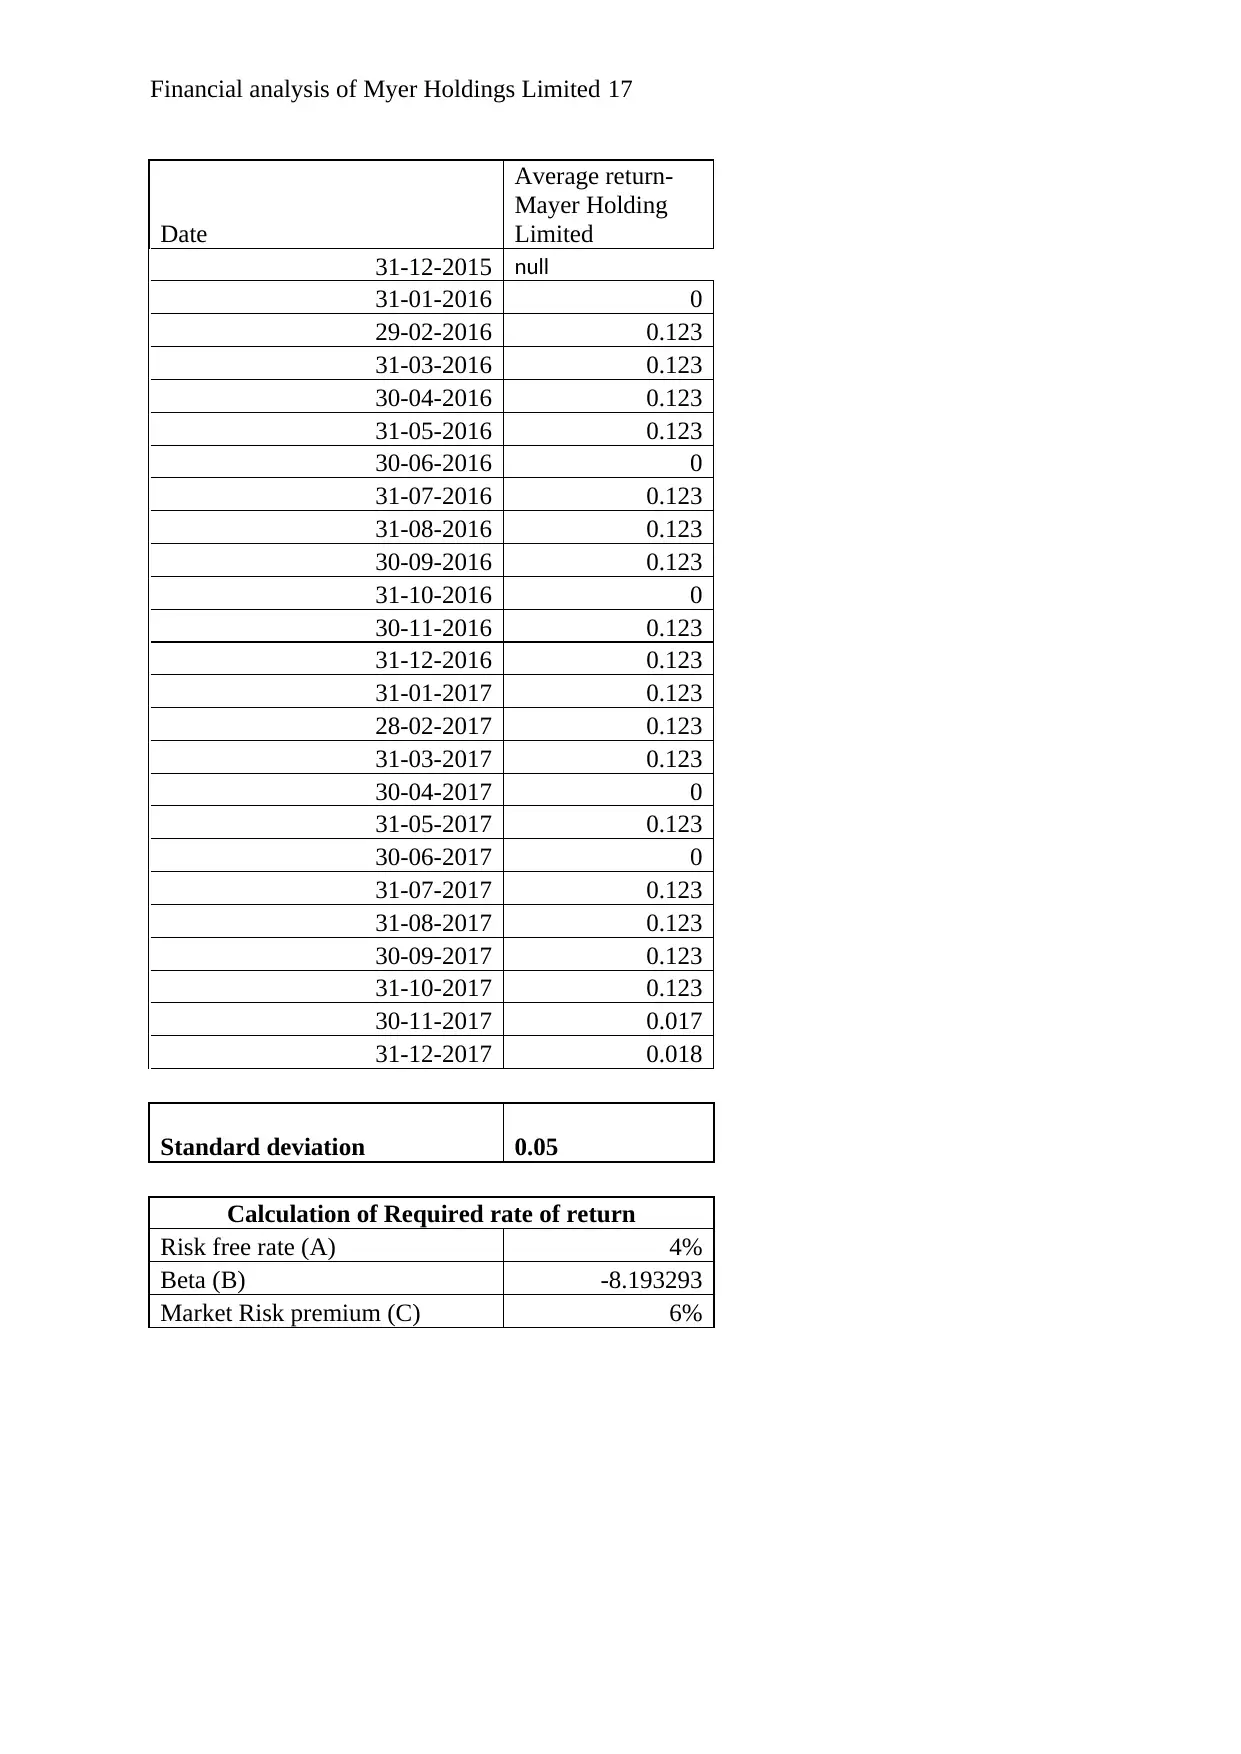
6.2 Computation of required rate of return by using CAPM
method
E(R) = Rf +( β∗R p)
E(R) = Expected rate of return
Rf = Risk free rate of return
β = Beta
Rp= Market Risk Premium (Zhu, 2014).
Calculation of Required rate of return
Risk free rate (A) 4%
Beta (B) -8.193293
Market Risk premium (C) 6%
Required rate of return [A+(B*C)] -45.16%
(Please see the excel)
The required rate of return of company is -45 It is negative as the beta of company is highly
negative (Mayer Holdings Company, 2017).
6.3 Determination of conservative investment
It is evaluated that company has reduced its return on capital employed throughout the
time. In addition to this, company is aggressive in its investment decision. It is diversifying
its business by adopting aggressive investment style. Mayer Holding is less interested in
plugging back of its profit in its present business due to sluggish market conditions. Mayer
Company has very low return in its business. Therefore, in order to increase the value of
equity shareholders capital, it has planned to increase its investment amount (Laudon, and
Traver, 2013).
Financial analysis of Myer Holdings Limited 9
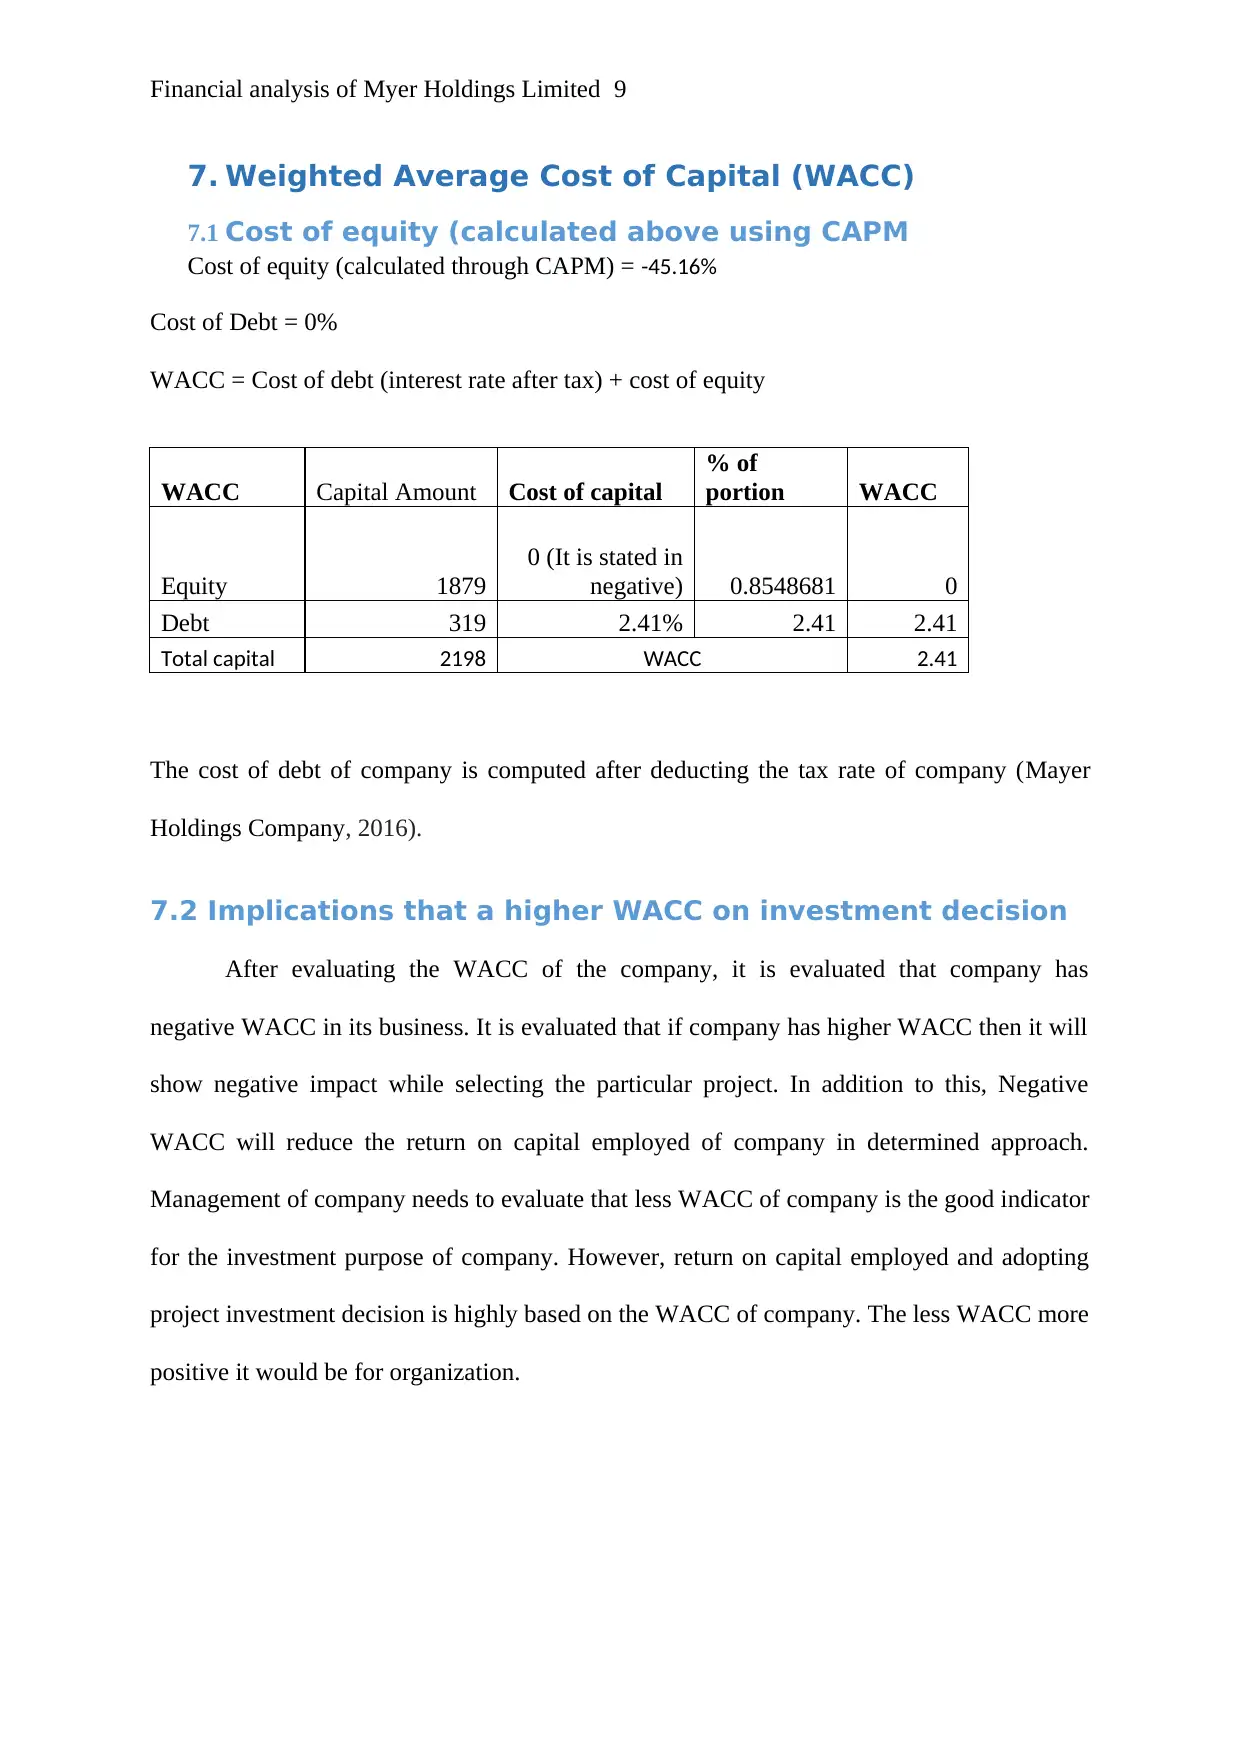
7. Weighted Average Cost of Capital (WACC)
7.1 Cost of equity (calculated above using CAPM
Cost of equity (calculated through CAPM) = -45.16%
Cost of Debt = 0%
WACC = Cost of debt (interest rate after tax) + cost of equity
WACC Capital Amount Cost of capital
% of
portion WACC
Equity 1879
0 (It is stated in
negative) 0.8548681 0
Debt 319 2.41% 2.41 2.41
Total capital 2198 WACC 2.41
The cost of debt of company is computed after deducting the tax rate of company (Mayer
Holdings Company, 2016).
7.2 Implications that a higher WACC on investment decision
After evaluating the WACC of the company, it is evaluated that company has
negative WACC in its business. It is evaluated that if company has higher WACC then it will
show negative impact while selecting the particular project. In addition to this, Negative
WACC will reduce the return on capital employed of company in determined approach.
Management of company needs to evaluate that less WACC of company is the good indicator
for the investment purpose of company. However, return on capital employed and adopting
project investment decision is highly based on the WACC of company. The less WACC more
positive it would be for organization.
Financial analysis of Myer Holdings Limited 10
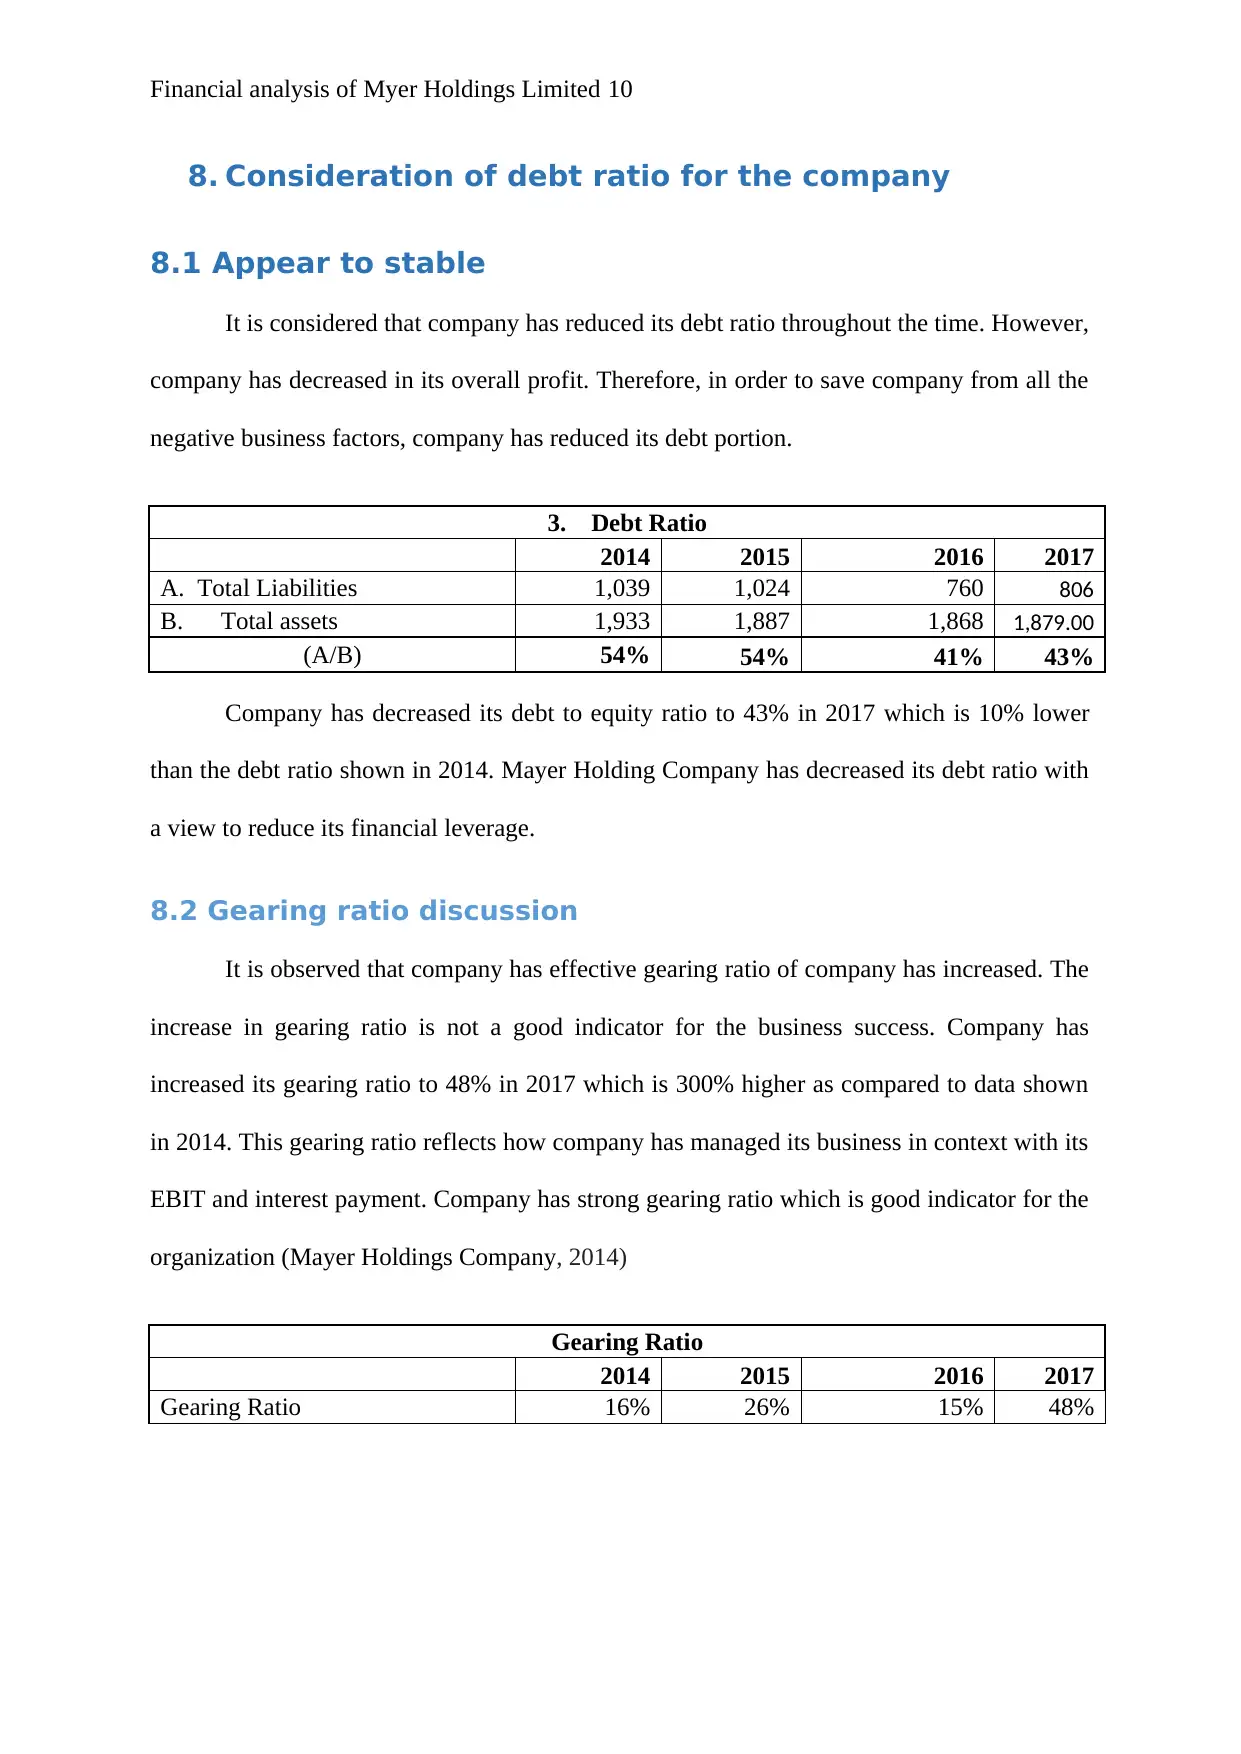
8. Consideration of debt ratio for the company
8.1 Appear to stable
It is considered that company has reduced its debt ratio throughout the time. However,
company has decreased in its overall profit. Therefore, in order to save company from all the
negative business factors, company has reduced its debt portion.
3. Debt Ratio
2014 2015 2016 2017
A. Total Liabilities 1,039 1,024 760 806
B. Total assets 1,933 1,887 1,868 1,879.00
(A/B) 54% 54% 41% 43%
Company has decreased its debt to equity ratio to 43% in 2017 which is 10% lower
than the debt ratio shown in 2014. Mayer Holding Company has decreased its debt ratio with
a view to reduce its financial leverage.
8.2 Gearing ratio discussion
It is observed that company has effective gearing ratio of company has increased. The
increase in gearing ratio is not a good indicator for the business success. Company has
increased its gearing ratio to 48% in 2017 which is 300% higher as compared to data shown
in 2014. This gearing ratio reflects how company has managed its business in context with its
EBIT and interest payment. Company has strong gearing ratio which is good indicator for the
organization (Mayer Holdings Company, 2014)
Gearing Ratio
2014 2015 2016 2017
Gearing Ratio 16% 26% 15% 48%
Secure Best Marks with AI Grader
Need help grading? Try our AI Grader for instant feedback on your assignments.
Financial analysis of Myer Holdings Limited 11
9. Divided policies of company
Company has adopted profit based dividend policies. Company has increased its
dividend amount on the basis of increased profit throughout the time. In addition to this, it
has not given any single amount of dividend at the time when Mayer was having no profit.
The dividend policies of company is determined on the basis of profit earned by company
and dividend offered to its shareholders. It is considered that dividend policy should be
positive as company having strong dividend policies would be highly attracted to clients in
market.
10. Letter of recommendation
After evaluating the details, data of company, it is considered that Mayer Holdings
Company has suffered high amount of loss in its overall profit throughout the time. The net
profit of company has gone down by at least 30% since last four years. In addition to this
debt to equity ratio has also went down which is good indicator. Since last four year, there is
no fluctuation in share price and kept its price stable. IT has offered very less return to its
shareholders. After evaluating the results calculated above, it could be inferred that company
has maintained stable business which put negative impact on its capital value creation. It has
also reduced the value of its core investment. Investor who wants to invest money in Mayer
Holding Company can invest, but the investment should be for long run for creating value on
their investment.
Financial analysis of Myer Holdings Limited 12
11. Conclusion
There are several financial analysis tools which could be used to evaluate the business
performance of company. It is considered that Mayer Holding Company has stable business
and offered less return to investors. Therefore, investors who want to invest money in Mayer
Holding Company can invest, but the investment should be for long run for creating value on
their investment. Now in the end, it could be inferred that Mayer Holding Company has been
facing several problems in its business which has resulted to negative outcome for the
company.

Financial analysis of Myer Holdings Limited 13
Paraphrase This Document
Need a fresh take? Get an instant paraphrase of this document with our AI Paraphraser
Financial analysis of Myer Holdings Limited 14
12. References
Brigham, E.F. and Ehrhardt, M.C., 2013. Financial management: Theory & practice.
Cengage Learning.
Laudon, K.C. and Traver, C.G., 2013. E-commerce. Pearson
Mayer Holdings Company, 2015, annual report, Retrieved on 29th November, 2017 from
http://www.irasia.com/listco/hk/mayer/annual/index.htm
Mayer Holdings Company, 2016, annual report, Retrieved on 29th November, 2017 from
http://www.irasia.com/listco/hk/mayer/annual/index.htm
Mayer Holdings Company, 2017, annual report, Retrieved on 29th November, 2017 from
http://www.irasia.com/listco/hk/mayer/annual/index.htm
Mayer Holdings Company, annual report, Retrieved on 29th November, 2017 from
http://www.irasia.com/listco/hk/mayer/annual/index.htm
Yahoo finance, 2018 retrieved on 19h January from https://in.finance.yahoo.com/
Zhu, J., 2014. Quantitative models for performance evaluation and benchmarking: data
envelopment analysis with spreadsheets (Vol. 213). Springer
Financial analysis of Myer Holdings Limited 15
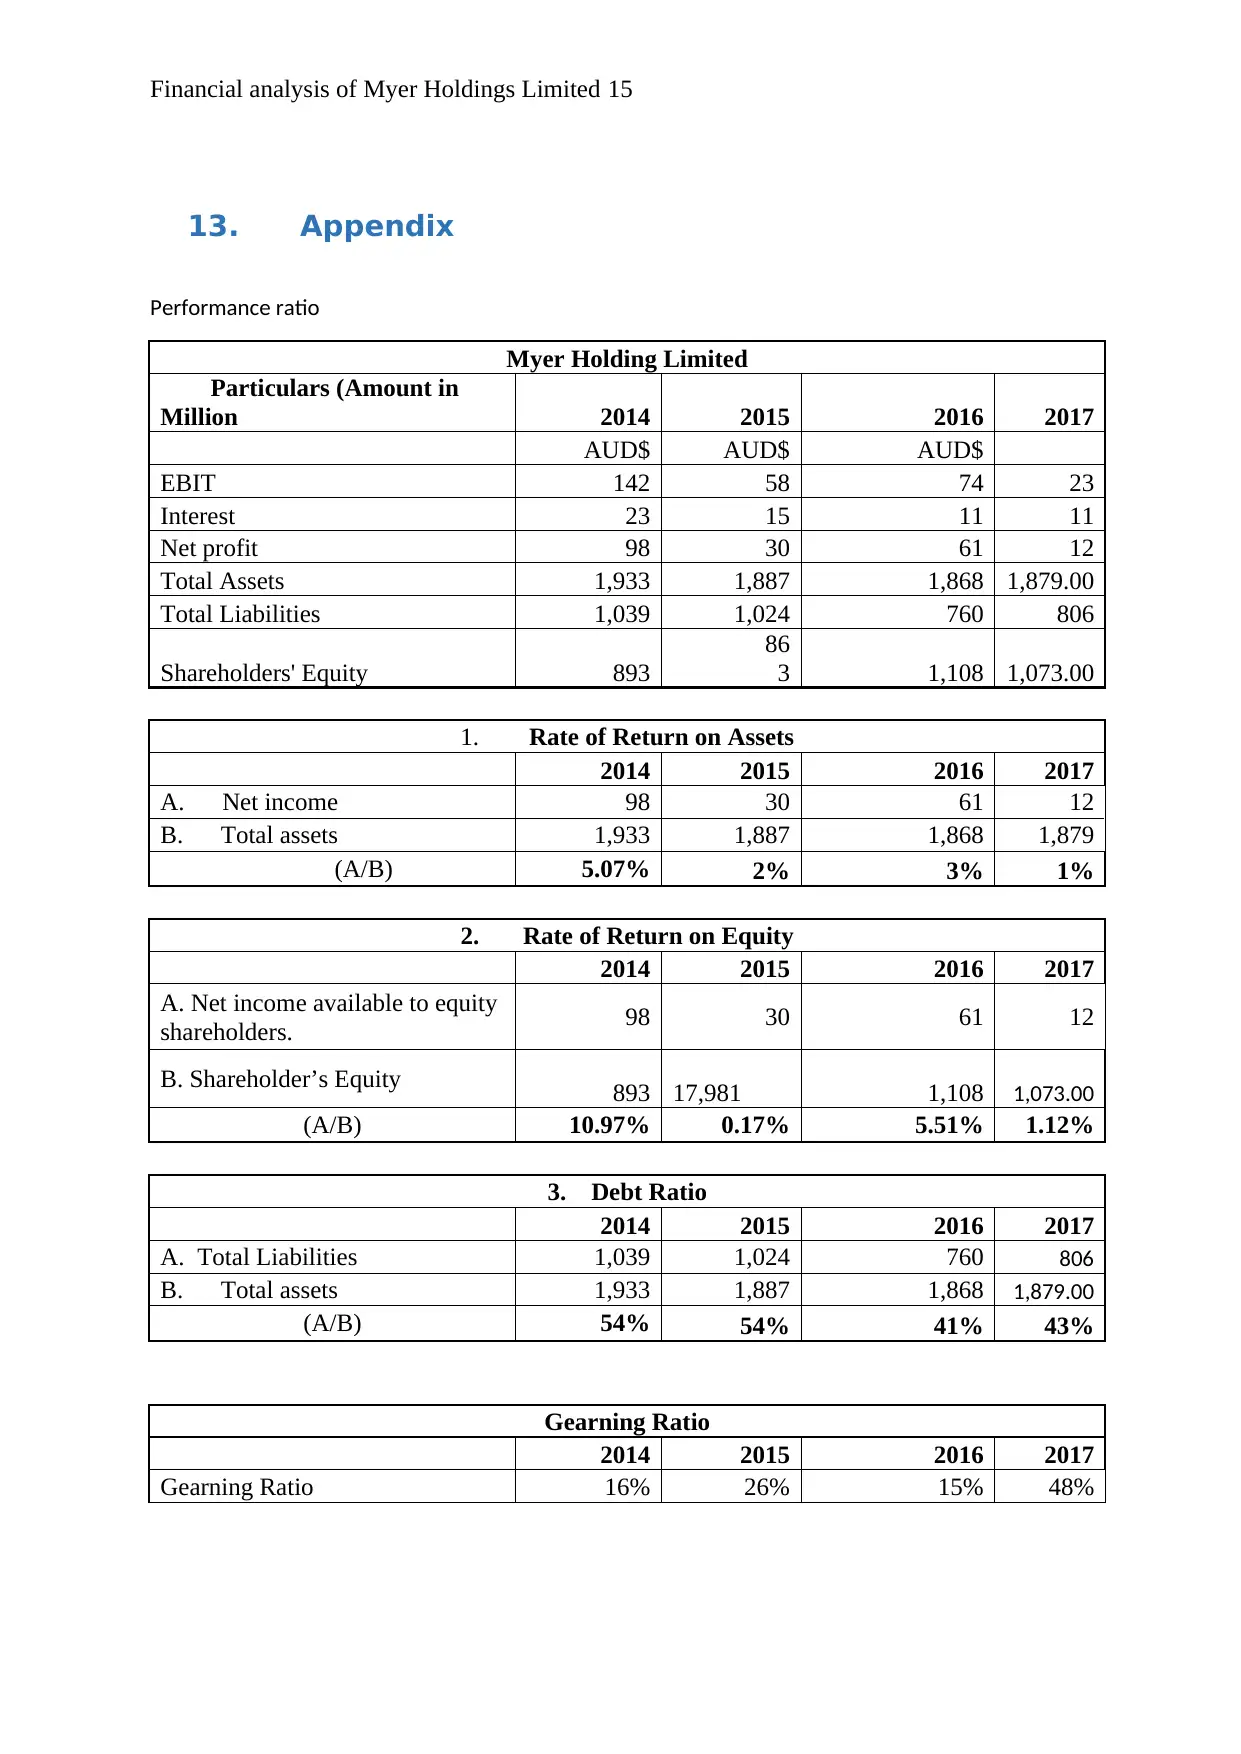
13. Appendix
Performance ratio
Myer Holding Limited
Particulars (Amount in
Million 2014 2015 2016 2017
AUD$ AUD$ AUD$
EBIT 142 58 74 23
Interest 23 15 11 11
Net profit 98 30 61 12
Total Assets 1,933 1,887 1,868 1,879.00
Total Liabilities 1,039 1,024 760 806
Shareholders' Equity 893
86
3 1,108 1,073.00
1. Rate of Return on Assets
2014 2015 2016 2017
A. Net income 98 30 61 12
B. Total assets 1,933 1,887 1,868 1,879
(A/B) 5.07% 2% 3% 1%
2. Rate of Return on Equity
2014 2015 2016 2017
A. Net income available to equity
shareholders. 98 30 61 12
B. Shareholder’s Equity 893 17,981 1,108 1,073.00
(A/B) 10.97% 0.17% 5.51% 1.12%
3. Debt Ratio
2014 2015 2016 2017
A. Total Liabilities 1,039 1,024 760 806
B. Total assets 1,933 1,887 1,868 1,879.00
(A/B) 54% 54% 41% 43%
Gearning Ratio
2014 2015 2016 2017
Gearning Ratio 16% 26% 15% 48%
Financial analysis of Myer Holdings Limited 16
Beta
SUMMARY
OUTPUT
Regression
Statistics
Multiple R
0.04530
7898
R Square
0.00205
2806
Adjusted R
Square
-
0.04330
843
Standard
Error
0.05613
9117
Observation
s 24
ANOVA
df SS MS F
Significa
nce F
Regression 1
0.00014
2624
0.00014
2624
0.04525
4623
0.83349
5333
Residual 22
0.06933
5209
0.00315
16
Total 23
0.06947
7833
Coeffici
ents
Standard
Error t Stat P-value
Lower
95%
Upper
95%
Lower
95.0%
Upper
95.0%
Intercept
0.13498
9975
0.21844
7484
0.61795
1611
0.54295
1979
-
0.31804
238
0.58802
2329
-
0.3180
4238
0.58802
2329
X Variable 1
-
8.19329
3
3.85147
E-05
-
0.21273
1339
0.83349
5333
-
8.8068E
-05
7.16814
E-05
-
8.8068
E-05
7.16814
E-05
Secure Best Marks with AI Grader
Need help grading? Try our AI Grader for instant feedback on your assignments.
Financial analysis of Myer Holdings Limited 17
Date
Average return-
Mayer Holding
Limited
31-12-2015 null
31-01-2016 0
29-02-2016 0.123
31-03-2016 0.123
30-04-2016 0.123
31-05-2016 0.123
30-06-2016 0
31-07-2016 0.123
31-08-2016 0.123
30-09-2016 0.123
31-10-2016 0
30-11-2016 0.123
31-12-2016 0.123
31-01-2017 0.123
28-02-2017 0.123
31-03-2017 0.123
30-04-2017 0
31-05-2017 0.123
30-06-2017 0
31-07-2017 0.123
31-08-2017 0.123
30-09-2017 0.123
31-10-2017 0.123
30-11-2017 0.017
31-12-2017 0.018
Standard deviation 0.05
Calculation of Required rate of return
Risk free rate (A) 4%
Beta (B) -8.193293
Market Risk premium (C) 6%

Financial analysis of Myer Holdings Limited 18
1 out of 18
Related Documents


Your All-in-One AI-Powered Toolkit for Academic Success.
+13062052269
info@desklib.com
Available 24*7 on WhatsApp / Email
![[object Object]](/_next/static/media/star-bottom.7253800d.svg)
Unlock your academic potential
© 2024 | Zucol Services PVT LTD | All rights reserved.