(solved) Financial Analysis: Assignment
Added on 2020-05-16
14 Pages2175 Words65 Views
RUNNING HEAD: Financial analysis of Tassal Group Limited (TGR.AX)1Name of the studentTopic- Tassal Group Limited (TGR.AX)University name
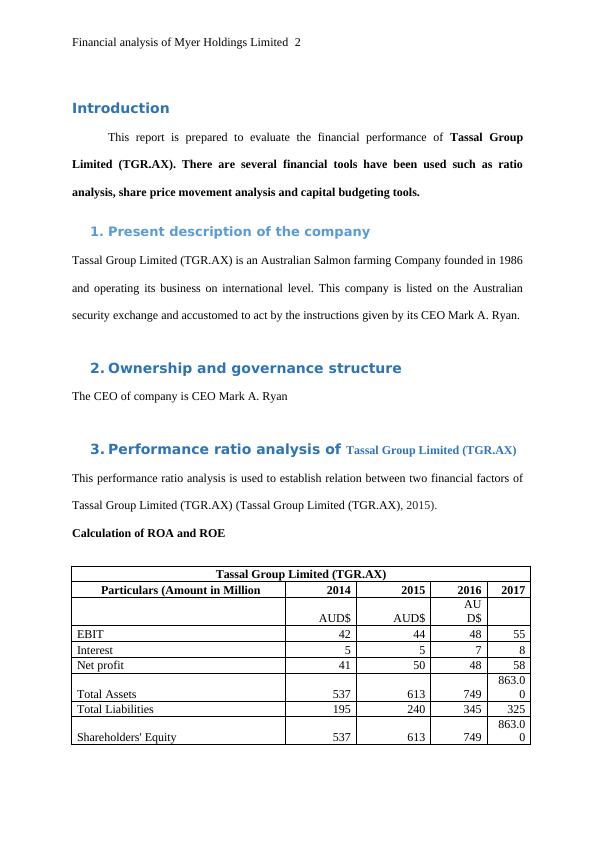
Financial analysis of Myer Holdings Limited2Introduction This report is prepared to evaluate the financial performance of Tassal GroupLimited (TGR.AX). There are several financial tools have been used such as ratioanalysis, share price movement analysis and capital budgeting tools. 1.Present description of the companyTassal Group Limited (TGR.AX) is an Australian Salmon farming Company founded in 1986and operating its business on international level. This company is listed on the Australiansecurity exchange and accustomed to act by the instructions given by its CEO Mark A. Ryan.2.Ownership and governance structureThe CEO of company is CEO Mark A. Ryan3.Performance ratio analysis of Tassal Group Limited (TGR.AX)This performance ratio analysis is used to establish relation between two financial factors ofTassal Group Limited (TGR.AX) (Tassal Group Limited (TGR.AX), 2015).Calculation of ROA and ROETassal Group Limited (TGR.AX)Particulars (Amount in Million 2014201520162017AUD$AUD$ AUD$ EBIT42444855Interest5578Net profit41504858Total Assets537613749863.00Total Liabilities195240345325Shareholders' Equity537 613 749863.00
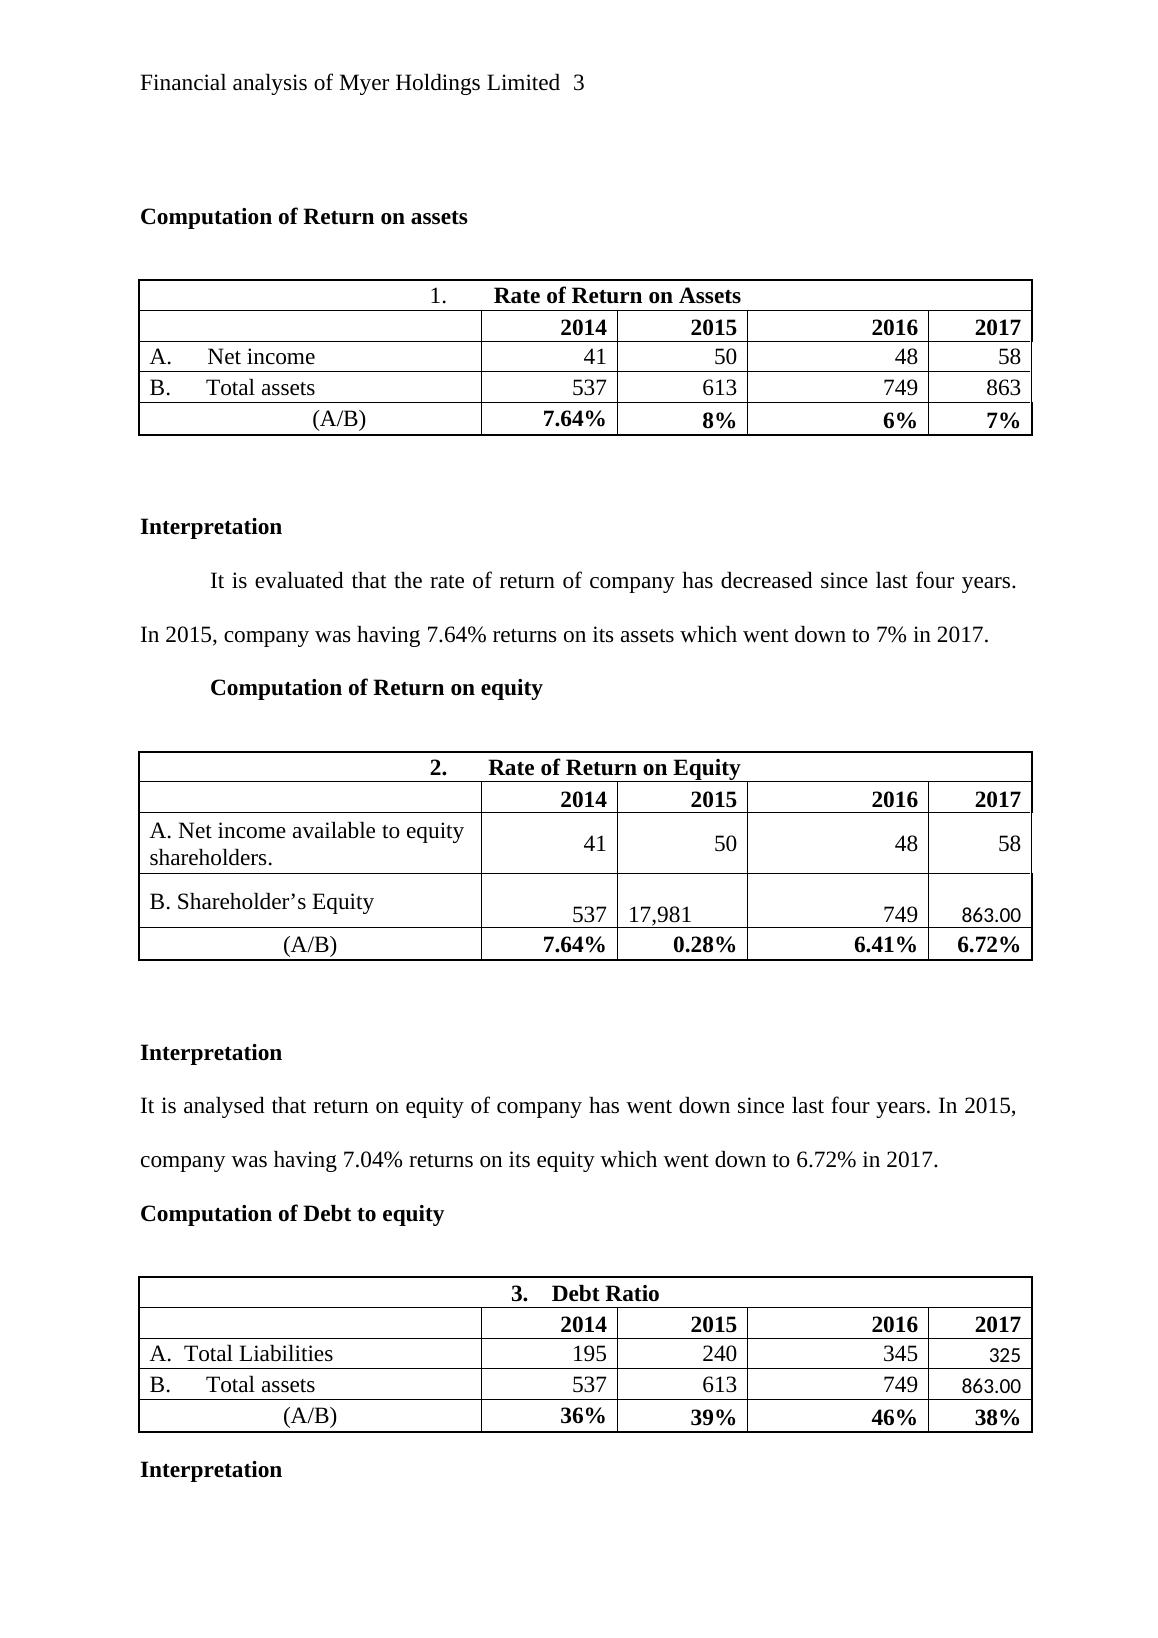
Financial analysis of Myer Holdings Limited3Computation of Return on assets 1.Rate of Return on Assets2014201520162017A. Net income41504858B. Total assets537613749863 (A/B)7.64%8%6%7%Interpretation It is evaluated that the rate of return of company has decreased since last four years.In 2015, company was having 7.64% returns on its assets which went down to 7% in 2017.Computation of Return on equity 2.Rate of Return on Equity2014201520162017A. Net income available to equity shareholders.41504858B. Shareholder’s Equity53717,981 749863.00(A/B)7.64%0.28%6.41%6.72%InterpretationIt is analysed that return on equity of company has went down since last four years. In 2015,company was having 7.04% returns on its equity which went down to 6.72% in 2017.Computation of Debt to equity3. Debt Ratio2014201520162017A.Total Liabilities195240345325B. Total assets537613749863.00(A/B)36%39%46%38%Interpretation
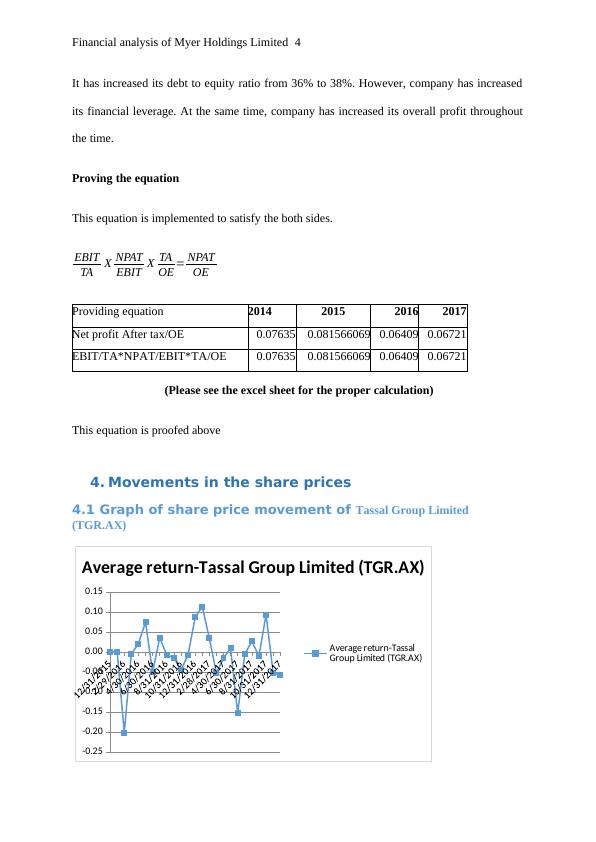
Financial analysis of Myer Holdings Limited4It has increased its debt to equity ratio from 36% to 38%. However, company has increasedits financial leverage. At the same time, company has increased its overall profit throughoutthe time. Proving the equationThis equation is implemented to satisfy the both sides. EBITTAXNPATEBITXTAOE=NPATOEProviding equation 2014201520162017Net profit After tax/OE0.076350.0815660690.064090.06721EBIT/TA*NPAT/EBIT*TA/OE0.076350.0815660690.064090.06721 (Please see the excel sheet for the proper calculation)This equation is proofed above 4.Movements in the share prices4.1 Graph of share price movement of Tassal Group Limited (TGR.AX)-0.25-0.20-0.15-0.10-0.050.000.050.100.15Average return-Tassal Group Limited (TGR.AX)Average return-Tassal Group Limited (TGR.AX)
End of preview
Want to access all the pages? Upload your documents or become a member.
Related Documents
Financial Analysis : PDFlg...
|9
|1687
|44
Analysis of financial performance Contentslg...
|10
|2700
|129
Financial Analysis of Myer Holdings Limitedlg...
|18
|2530
|241
Financial Performance Analysis (doc)lg...
|11
|2209
|49
Report on Masters In Financelg...
|9
|1646
|38
Finance Assignment | Financial Analysis Reportlg...
|10
|2365
|93