Case Study Of Financial Analysis Report
Develop practical skills in financial statement analysis and valuation through a group assignment.
22 Pages5211 Words30 Views
Added on 2022-10-01
Case Study Of Financial Analysis Report
Develop practical skills in financial statement analysis and valuation through a group assignment.
Added on 2022-10-01
ShareRelated Documents
Financial Analysis – A Case Study on
AMCOR Company
PREPARED BY:
BARSHA PUN (K180280)
RAJAN KANDEL (K170442)
ANITA KARKI (K180175)
PRAMILA KHADKA (K170101)
1 | P a g e
AMCOR Company
PREPARED BY:
BARSHA PUN (K180280)
RAJAN KANDEL (K170442)
ANITA KARKI (K180175)
PRAMILA KHADKA (K170101)
1 | P a g e
Executive Summary
In the analysis, we have analyzed the financial information of the company on various aspects,
such as common size income statements, common size financial position statements, cash flow
from operations, free cash flow for the firm and free cash flow for equity.
We have also analyzed various ratios of the company, such as debt-equity ratio, interest coverage
ratio, gross margin, net margin, EBIT margin, etc. which demonstrates the earning capacity of
the entity.
Based on the analysis performed, we could conclude that the overall financial position of the
entity has improved over the years and though, profit margins of the entity have slightly reduced,
these are temporary declines, resulting from business restructuring exercise of the company, and
the management’s guidance for FY20 demonstrates that the company would be able to achieve
an EPS of 61-64 cents.
2 | P a g e
Table of Contents
Introduction......................................................................................................................................4
Company Background.....................................................................................................................4
Findings and Analysis......................................................................................................................5
Common Size and Horizontal Analysis................................................................................5
Cash Flow Analysis..............................................................................................................6
Liquidity Analysis................................................................................................................8
Income Analysis.................................................................................................................10
Capital Structure and debt ratio analysis:...........................................................................12
Coverage.............................................................................................................................13
Growth and Risk Analysis..................................................................................................14
Basic Prospective Analysis.................................................................................................16
Conclusion.....................................................................................................................................18
Reference List................................................................................................................................19
3 | P a g e
Introduction
We have analyzed the annual report of Amcor Company for the year ended 30th June, 2019. The
report provides the brief information about the background of the company, i.e. explaining the
nature of business of the company, few details about the management of the Company.
On the key financial statements of the company, as are furnished in the annual report, we have
performed the common size and horizontal analysis.
We have also performed the analysis of cash flow statement of the company, focusing on the
cash flow from operations of the company, along with performing liquidity analysis, income
analysis, Capital structure, growth and risk analysis and prospective analysis of the company.
The objective of the above-mentioned analysis is to evaluate the performance of the company, to
give the current or prospective shareholders, insights about the operations of the entity.
Company Background
Figure 1: Amcor Plc Company
(Source: amcor.com 2019)
Amcor Plc Company is engaged in manufacturing of packaging for food, beverages, home and
personal care, etc. It was incorporated in the name of Arctic Jersey Limited. It is a holding
4 | P a g e
company, which also acquired Bemis Company, the company is listed on the Australian Stock
Exchange. The company has its head office in Thurgauerstrasse 34, Switzerland. The company
has identified two different segments, where the company operates, which are Flexible
Packaging and Rigid Plastics.
Analysis:
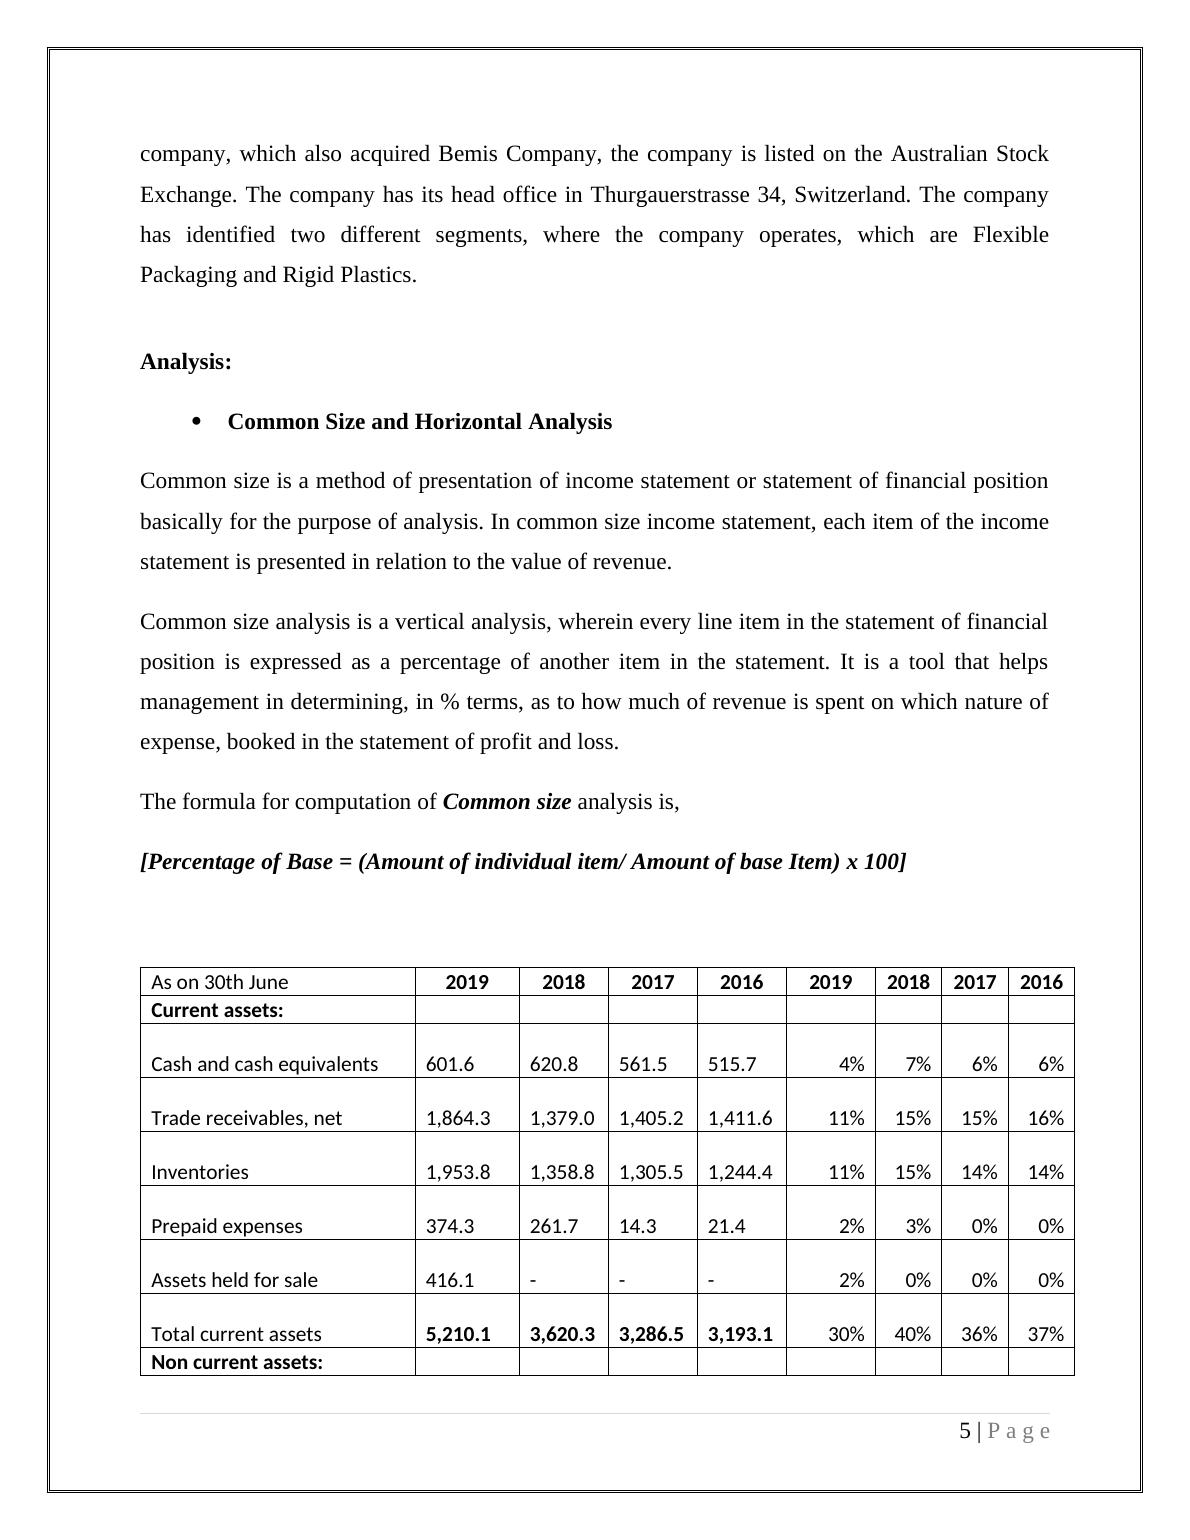
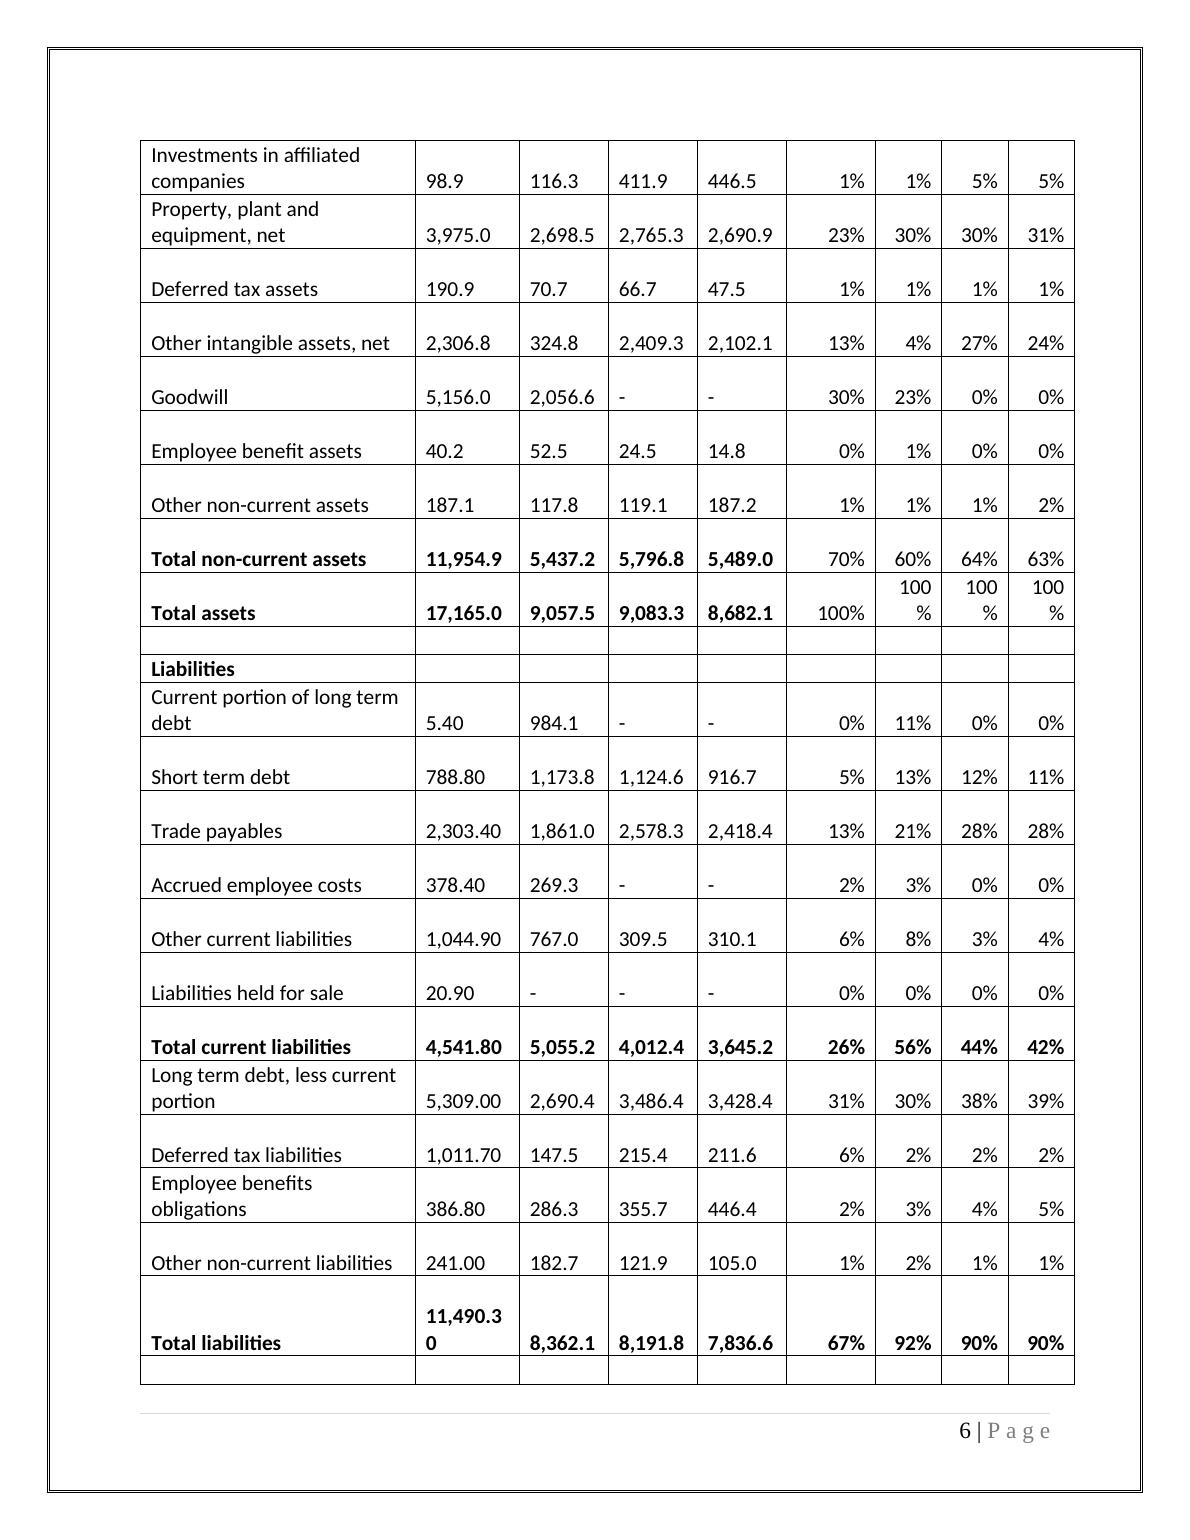
Common Size and Horizontal Analysis
Common size is a method of presentation of income statement or statement of financial position
basically for the purpose of analysis. In common size income statement, each item of the income
statement is presented in relation to the value of revenue.
Common size analysis is a vertical analysis, wherein every line item in the statement of financial
position is expressed as a percentage of another item in the statement. It is a tool that helps
management in determining, in % terms, as to how much of revenue is spent on which nature of
expense, booked in the statement of profit and loss.
The formula for computation of Common size analysis is,
[Percentage of Base = (Amount of individual item/ Amount of base Item) x 100]
As on 30th June 2019 2018 2017 2016 2019
201
8
201
7
201
6
Current assets:
Cash and cash
equivalents 601.6 620.8 561.5 515.7 4% 7% 6% 6%
Trade receivables, net 1,864.3
1,379.
0
1,405
.2
1,411.
6 11%
15
%
15
%
16
%
Inventories 1,953.8
1,358.
8
1,305
.5
1,244.
4 11%
15
%
14
%
14
%
Prepaid expenses 374.3 261.7 14.3 21.4 2% 3% 0% 0%
Assets held for sale 416.1 - - - 2% 0% 0% 0%
Total current assets 30% 40 36 37
5 | P a g e
Exchange. The company has its head office in Thurgauerstrasse 34, Switzerland. The company
has identified two different segments, where the company operates, which are Flexible
Packaging and Rigid Plastics.
Analysis:
Common Size and Horizontal Analysis
Common size is a method of presentation of income statement or statement of financial position
basically for the purpose of analysis. In common size income statement, each item of the income
statement is presented in relation to the value of revenue.
Common size analysis is a vertical analysis, wherein every line item in the statement of financial
position is expressed as a percentage of another item in the statement. It is a tool that helps
management in determining, in % terms, as to how much of revenue is spent on which nature of
expense, booked in the statement of profit and loss.
The formula for computation of Common size analysis is,
[Percentage of Base = (Amount of individual item/ Amount of base Item) x 100]
As on 30th June 2019 2018 2017 2016 2019
201
8
201
7
201
6
Current assets:
Cash and cash
equivalents 601.6 620.8 561.5 515.7 4% 7% 6% 6%
Trade receivables, net 1,864.3
1,379.
0
1,405
.2
1,411.
6 11%
15
%
15
%
16
%
Inventories 1,953.8
1,358.
8
1,305
.5
1,244.
4 11%
15
%
14
%
14
%
Prepaid expenses 374.3 261.7 14.3 21.4 2% 3% 0% 0%
Assets held for sale 416.1 - - - 2% 0% 0% 0%
Total current assets 30% 40 36 37
5 | P a g e
5,210.
1
3,620
.3
3,286
.5
3,193
.1 % % %
Non current assets:
Investments in
affiliated companies 98.9 116.3 411.9 446.5 1% 1% 5% 5%
Property, plant and
equipment, net 3,975.0
2,698.
5
2,765
.3
2,690.
9 23%
30
%
30
%
31
%
Deferred tax assets 190.9 70.7 66.7 47.5 1% 1% 1% 1%
Other intangible
assets, net 2,306.8 324.8
2,409
.3
2,102.
1 13% 4%
27
%
24
%
Goodwill 5,156.0
2,056.
6 - - 30%
23
% 0% 0%
Employee benefit
assets 40.2 52.5 24.5 14.8 0% 1% 0% 0%
Other non-current
assets 187.1 117.8 119.1 187.2 1% 1% 1% 2%
Total non-current
assets
11,954
.9
5,437
.2
5,796
.8
5,489
.0 70%
60
%
64
%
63
%
Total assets
17,165
.0
9,057
.5
9,083
.3
8,682
.1 100%
100
%
100
%
100
%
Liabilities
Current portion of long
term debt 5.40 984.1 - - 0%
11
% 0% 0%
Short term debt 788.80
1,173.
8
1,124
.6 916.7 5%
13
%
12
%
11
%
Trade payables
2,303.4
0
1,861.
0
2,578
.3
2,418.
4 13%
21
%
28
%
28
%
Accrued employee
costs 378.40 269.3 - - 2% 3% 0% 0%
Other current liabilities
1,044.9
0 767.0 309.5 310.1 6% 8% 3% 4%
Liabilities held for sale 20.90 - - - 0% 0% 0% 0%
Total current
liabilities
4,541.
80
5,055
.2
4,012
.4
3,645
.2 26%
56
%
44
%
42
%
Long term debt, less
current portion 5,309.0 2,690. 3,486 3,428.
31% 30
%
38
%
39
%
6 | P a g e
End of preview
Want to access all the pages? Upload your documents or become a member.
Related Documents
Business Valuation and Analysislg...
|26
|6972
|176
Strategic Financial Analysis 2022lg...
|35
|8266
|26
Financial Statement Analysis of Woolworths Limitedlg...
|20
|5600
|75
Ratio Analysis of Veep Marketinglg...
|7
|992
|125
Financial Reporting Assignment | Financial Analysis Reportlg...
|17
|2870
|66
Understanding Financial Statements and Valuation Methods for Investmentlg...
|21
|3412
|211