Financial Analysis Report: Analyzing Sales, Shipping, and Orders Data
VerifiedAdded on 2020/04/21
|15
|2418
|256
Report
AI Summary
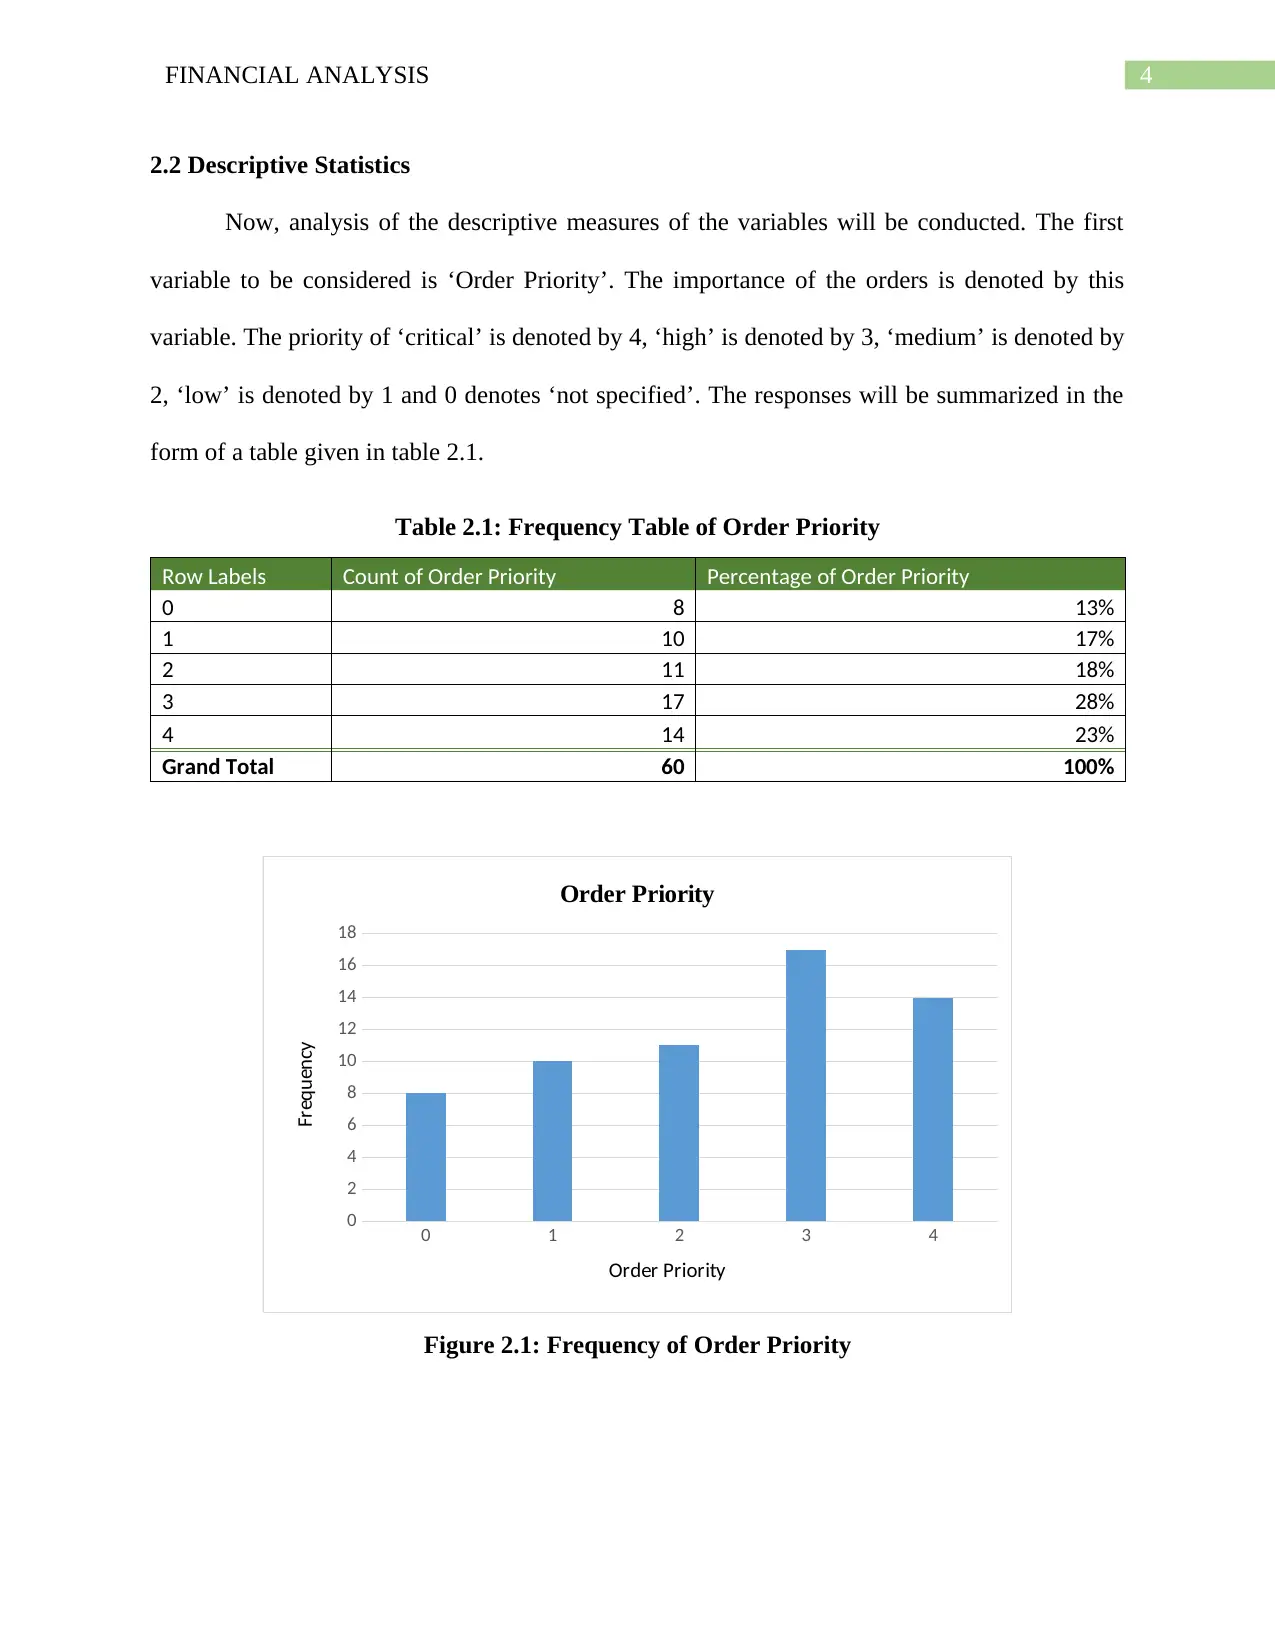
This financial analysis report examines sales data, shipping costs, and order information from 'Hardware and Garden Supplies.' The analysis begins with the selection of 60 random samples from a dataset of 2002 orders and calculates descriptive statistics for various variables including order priority, order quantity, sales amount, shipment mode, shipping cost, region, consumer segment, and days to ship. The report calculates confidence intervals for sales amount and shipping costs, conducts hypothesis tests to compare shipping costs based on order priority and sales differences between regions, and performs regression analysis to assess the relationship between order quantity and sales amount. Key findings include the average order quantity, sales value, and shipping cost, with insights into order priority, shipment modes, and regional distribution. The report concludes with a summary of key findings, including the impact of order quantity on sales and the limitations of the analysis due to the sample size.
1 out of 15
Related Documents


Your All-in-One AI-Powered Toolkit for Academic Success.
+13062052269
info@desklib.com
Available 24*7 on WhatsApp / Email
![[object Object]](/_next/static/media/star-bottom.7253800d.svg)
Copyright © 2020–2026 A2Z Services. All Rights Reserved. Developed and managed by ZUCOL.