Financial Analysis of AGL Energy Limited
Added on 2022-11-17
13 Pages999 Words331 Views
Running head: FINANCIAL ANALYSIS
FINANCIAL ANALYSIS
Name of the student:
Name of the university:
Author Note:
FINANCIAL ANALYSIS
Name of the student:
Name of the university:
Author Note:
FINANCIAL ANALYSIS1
Table of Contents
Introduction:...............................................................................................................................2
Discussion:.................................................................................................................................2
Profitability Ratios.................................................................................................................2
Liquidity Ratios......................................................................................................................3
Debt Management Ratio........................................................................................................4
Efficiency Ratio.....................................................................................................................5
Market Performance Ratio.....................................................................................................6
DuPont Analysis.....................................................................................................................6
Conclusion..................................................................................................................................7
FINANCIAL ANALYSIS2
Introduction:
The aim of the assignment deals with the financial analysis of AGL energy limited
and as anew financial manager of the company it is needed to provide the brief analysis
regarding the performance of the company. The overall financial performance of the
company is needed to be presented in front of the meeting held by the board of directors. The
significant tools which is undertaken for the financial analysis are the financial ratios, DuPont
analysis. Further the interpretation of the financial analysis is conducted in a detailed manner.
Discussion:
The evaluation of financial ratios of A2 milk have been evaluated from the financial
year 2015, 2016, 2017 and 2018. The financial ratios which have been evaluated in that case
are the profitability, debt management ratio, liquidity ratio, efficiency ratio and market
performance ratio. The ratio is performed along with the DuPont analysis of the business
with the help of the information’s obtained from the annual report of the company. The ratios
have been depicted bellow accordingly.
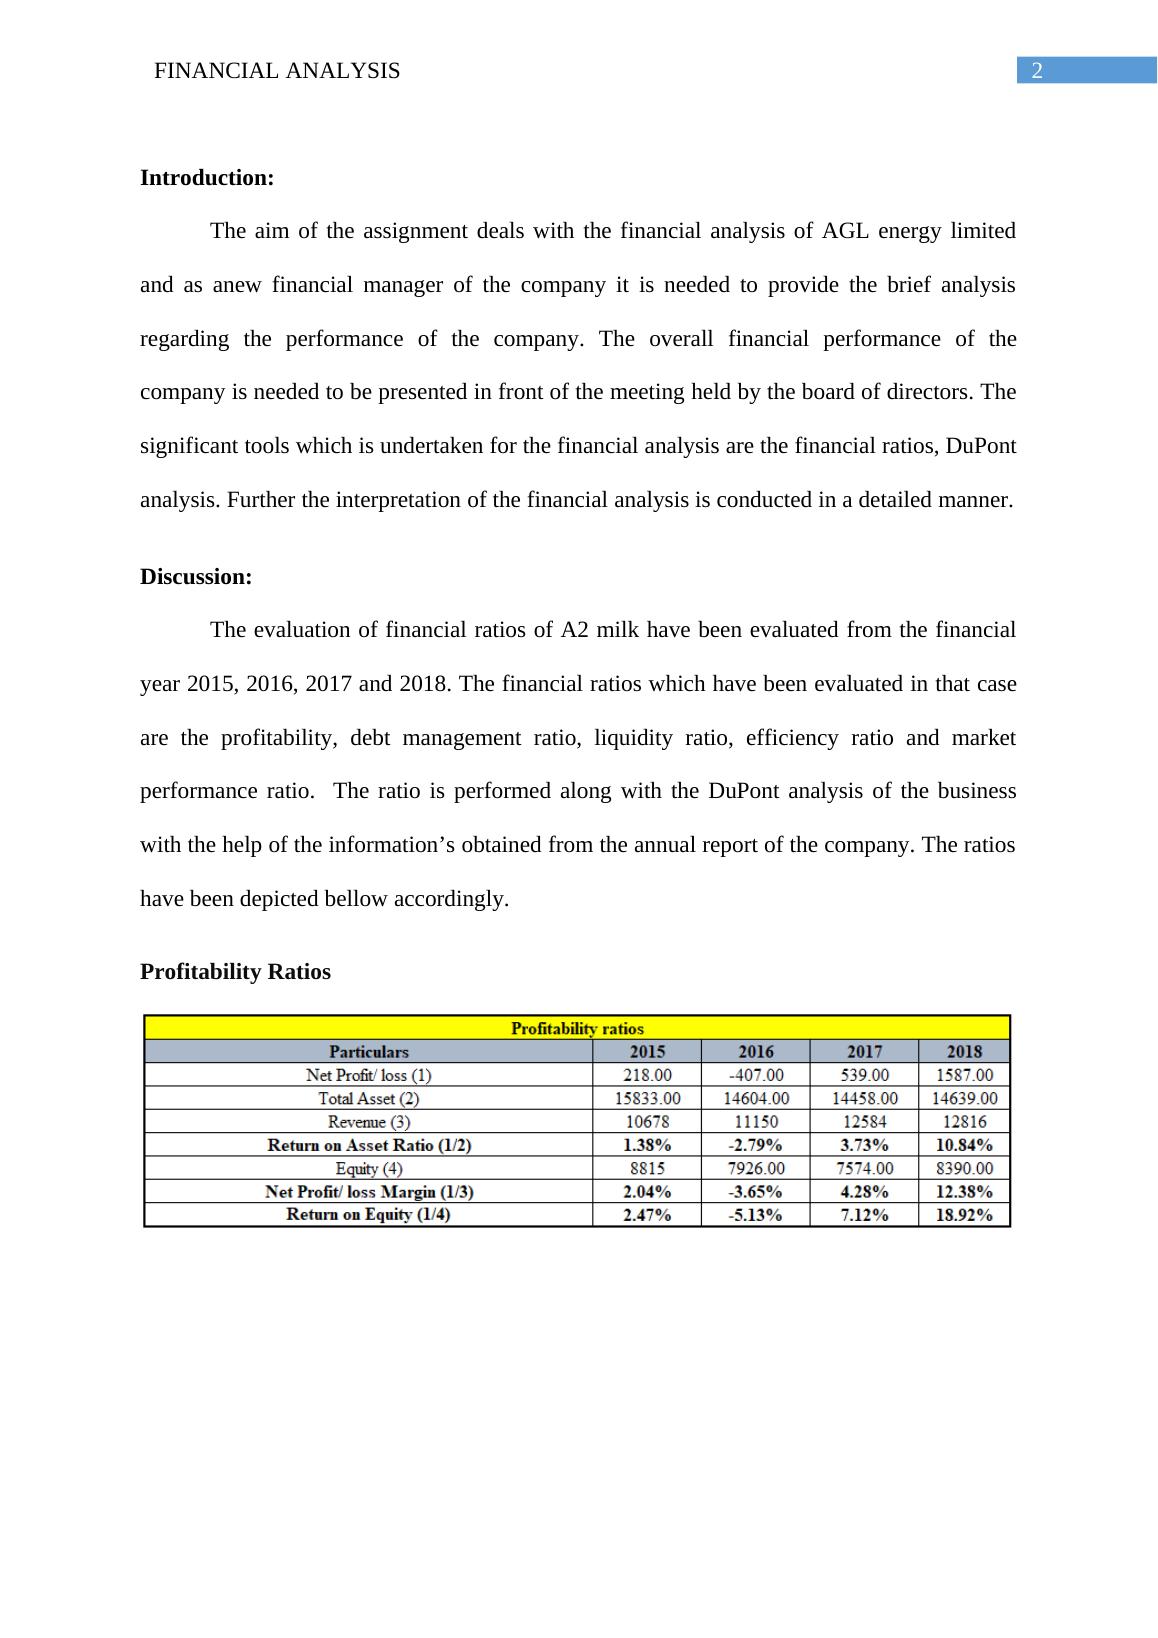
Profitability Ratios
Introduction:
The aim of the assignment deals with the financial analysis of AGL energy limited
and as anew financial manager of the company it is needed to provide the brief analysis
regarding the performance of the company. The overall financial performance of the
company is needed to be presented in front of the meeting held by the board of directors. The
significant tools which is undertaken for the financial analysis are the financial ratios, DuPont
analysis. Further the interpretation of the financial analysis is conducted in a detailed manner.
Discussion:
The evaluation of financial ratios of A2 milk have been evaluated from the financial
year 2015, 2016, 2017 and 2018. The financial ratios which have been evaluated in that case
are the profitability, debt management ratio, liquidity ratio, efficiency ratio and market
performance ratio. The ratio is performed along with the DuPont analysis of the business
with the help of the information’s obtained from the annual report of the company. The ratios
have been depicted bellow accordingly.
Profitability Ratios
FINANCIAL ANALYSIS3
2015 2016 2017 2018
-10.00%
-5.00%
0.00%
5.00%
10.00%
15.00%
20.00%
25.00%
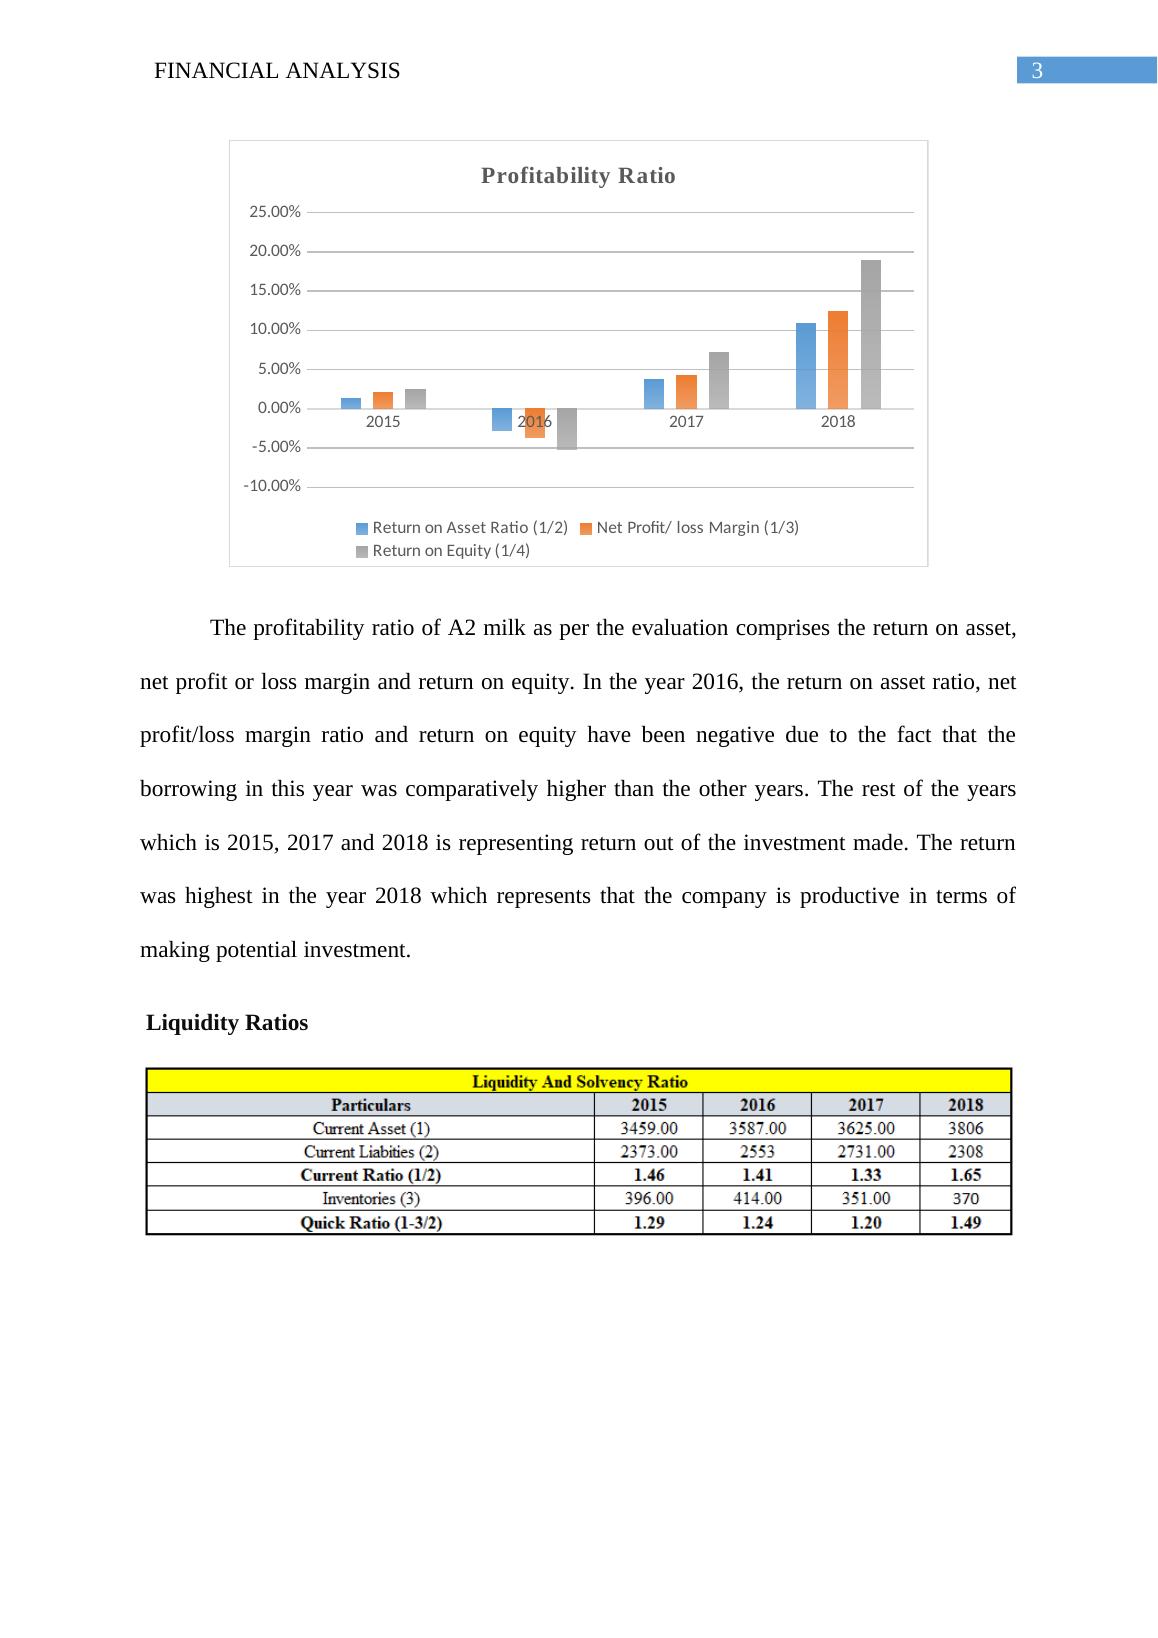
Profitability Ratio
Return on Asset Ratio (1/2) Net Profit/ loss Margin (1/3)
Return on Equity (1/4)
The profitability ratio of A2 milk as per the evaluation comprises the return on asset,
net profit or loss margin and return on equity. In the year 2016, the return on asset ratio, net
profit/loss margin ratio and return on equity have been negative due to the fact that the
borrowing in this year was comparatively higher than the other years. The rest of the years
which is 2015, 2017 and 2018 is representing return out of the investment made. The return
was highest in the year 2018 which represents that the company is productive in terms of
making potential investment.
Liquidity Ratios
2015 2016 2017 2018
-10.00%
-5.00%
0.00%
5.00%
10.00%
15.00%
20.00%
25.00%
Profitability Ratio
Return on Asset Ratio (1/2) Net Profit/ loss Margin (1/3)
Return on Equity (1/4)
The profitability ratio of A2 milk as per the evaluation comprises the return on asset,
net profit or loss margin and return on equity. In the year 2016, the return on asset ratio, net
profit/loss margin ratio and return on equity have been negative due to the fact that the
borrowing in this year was comparatively higher than the other years. The rest of the years
which is 2015, 2017 and 2018 is representing return out of the investment made. The return
was highest in the year 2018 which represents that the company is productive in terms of
making potential investment.
Liquidity Ratios
End of preview
Want to access all the pages? Upload your documents or become a member.
Related Documents
Financial Analysis of The a2 Milk Company and Coca-Cola Amatillg...
|7
|773
|358
Analysis of Business Strategy of Deere and Companylg...
|11
|2402
|406
Financial Statement Analysis & Valuationlg...
|17
|3428
|10
Financial Management: Analysis of Gatsby Grange Boutiquelg...
|19
|729
|24
European Journal of Operational Researchlg...
|9
|750
|9
Financial Statement Analysis of E and A limitedlg...
|8
|1350
|42