Financial and Economic Interpretation and Communication of Macquarie Group
Added on 2022-10-19
5 Pages1428 Words284 Views
Financial and Economic Interpretation and Communication
EXECUTIVE SUMMARY
Macquarie Group started its operation in 1969 at Sydney, Australia. It deals in
services like asset management, banking and finance, advisory, risk and capital
solutions through equities, debts and commodities. This report has outlined the
key ratios, analysed the trend of dividend per share and Price earning ratio and
had studied the ratings given by different rating agencies and outlooks given by
S&P Global. This would assist the readers in evaluating the performance of the
company.
ANALYSIS
Name of ratio Result
(2018)
Result
(2019)
%age
change Significance of Ratio
Gross profit margin
ratio
40% 33% -18% Informs the stakeholders about the operating
performance of the company
Net Profit Margin 52% 56% 7% Gives an idea about the performance of the
company in terms of profit after meeting the
tax and other liabilities
Return on Total
Assets
2% 2% 0% Indicate the readers about the company's
efficiency in utilising its total assets in
generating sales
Return on Equity 16.80% 21% 18% It would help the reader to understand about
how the company is utilising the shareholders
funds in generating profit.
Current Ratio 0.96 0.96 0% Assist the readers about the company's
liquidity and efficiency in meeting its short
term obligations
Equity Percentage 10% 9% -5% Assist the readers in getting an idea about
who enjoys the ownership over the assets of
the company. When equity percentage is high
then shareholders enjoys the maximum
ownership over the assets and in case of high
debt percentage ownership over assets lies
with the creditors of the company.
Debt Percentage 90% 91% 1%
Debt to Equity
Ratio
3.08 2.73 -11% Debt to equity ratio would help the readers to
understand about the capital structure of the
company that would assist them in making an
appropriate investment decision like whether
they should go for extending the credit in form
of debt or contribute the funds as being a
shareholder ofthe company.
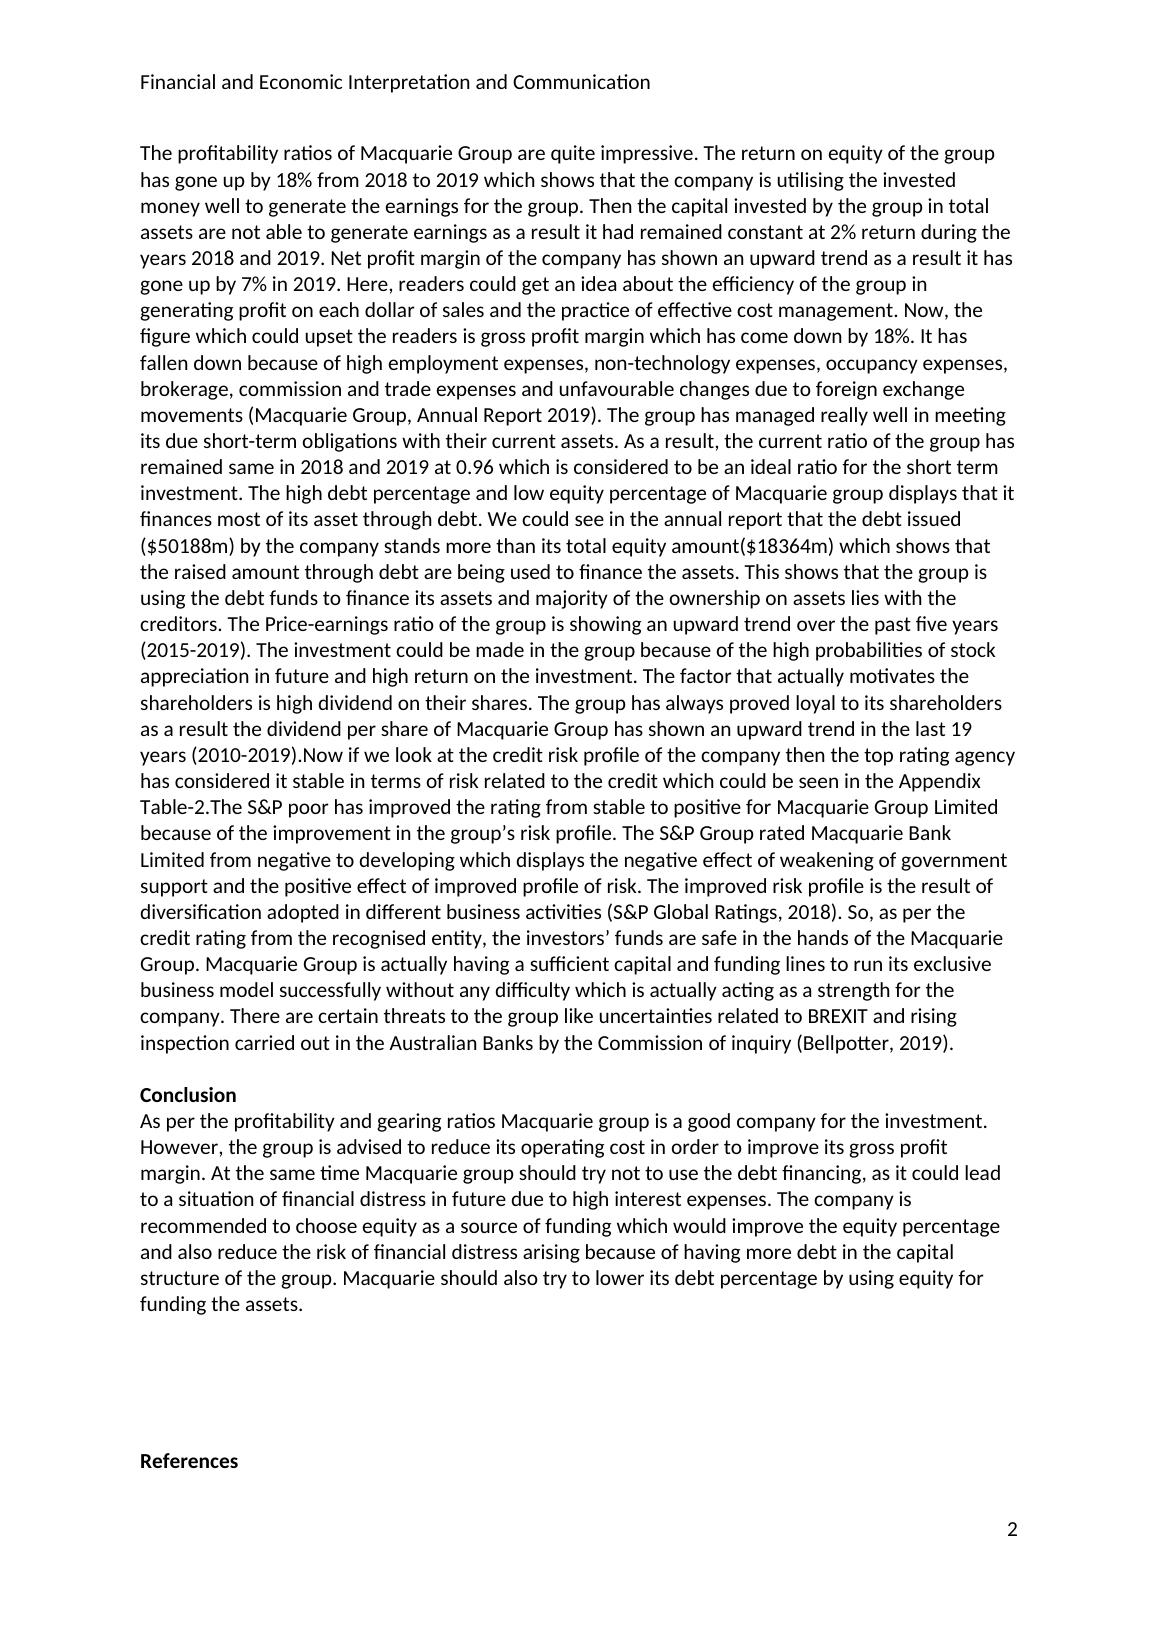
Table 1: Ratios of Macquarie Group
1
EXECUTIVE SUMMARY
Macquarie Group started its operation in 1969 at Sydney, Australia. It deals in
services like asset management, banking and finance, advisory, risk and capital
solutions through equities, debts and commodities. This report has outlined the
key ratios, analysed the trend of dividend per share and Price earning ratio and
had studied the ratings given by different rating agencies and outlooks given by
S&P Global. This would assist the readers in evaluating the performance of the
company.
ANALYSIS
Name of ratio Result
(2018)
Result
(2019)
%age
change Significance of Ratio
Gross profit margin
ratio
40% 33% -18% Informs the stakeholders about the operating
performance of the company
Net Profit Margin 52% 56% 7% Gives an idea about the performance of the
company in terms of profit after meeting the
tax and other liabilities
Return on Total
Assets
2% 2% 0% Indicate the readers about the company's
efficiency in utilising its total assets in
generating sales
Return on Equity 16.80% 21% 18% It would help the reader to understand about
how the company is utilising the shareholders
funds in generating profit.
Current Ratio 0.96 0.96 0% Assist the readers about the company's
liquidity and efficiency in meeting its short
term obligations
Equity Percentage 10% 9% -5% Assist the readers in getting an idea about
who enjoys the ownership over the assets of
the company. When equity percentage is high
then shareholders enjoys the maximum
ownership over the assets and in case of high
debt percentage ownership over assets lies
with the creditors of the company.
Debt Percentage 90% 91% 1%
Debt to Equity
Ratio
3.08 2.73 -11% Debt to equity ratio would help the readers to
understand about the capital structure of the
company that would assist them in making an
appropriate investment decision like whether
they should go for extending the credit in form
of debt or contribute the funds as being a
shareholder ofthe company.
Table 1: Ratios of Macquarie Group
1
Financial and Economic Interpretation and Communication
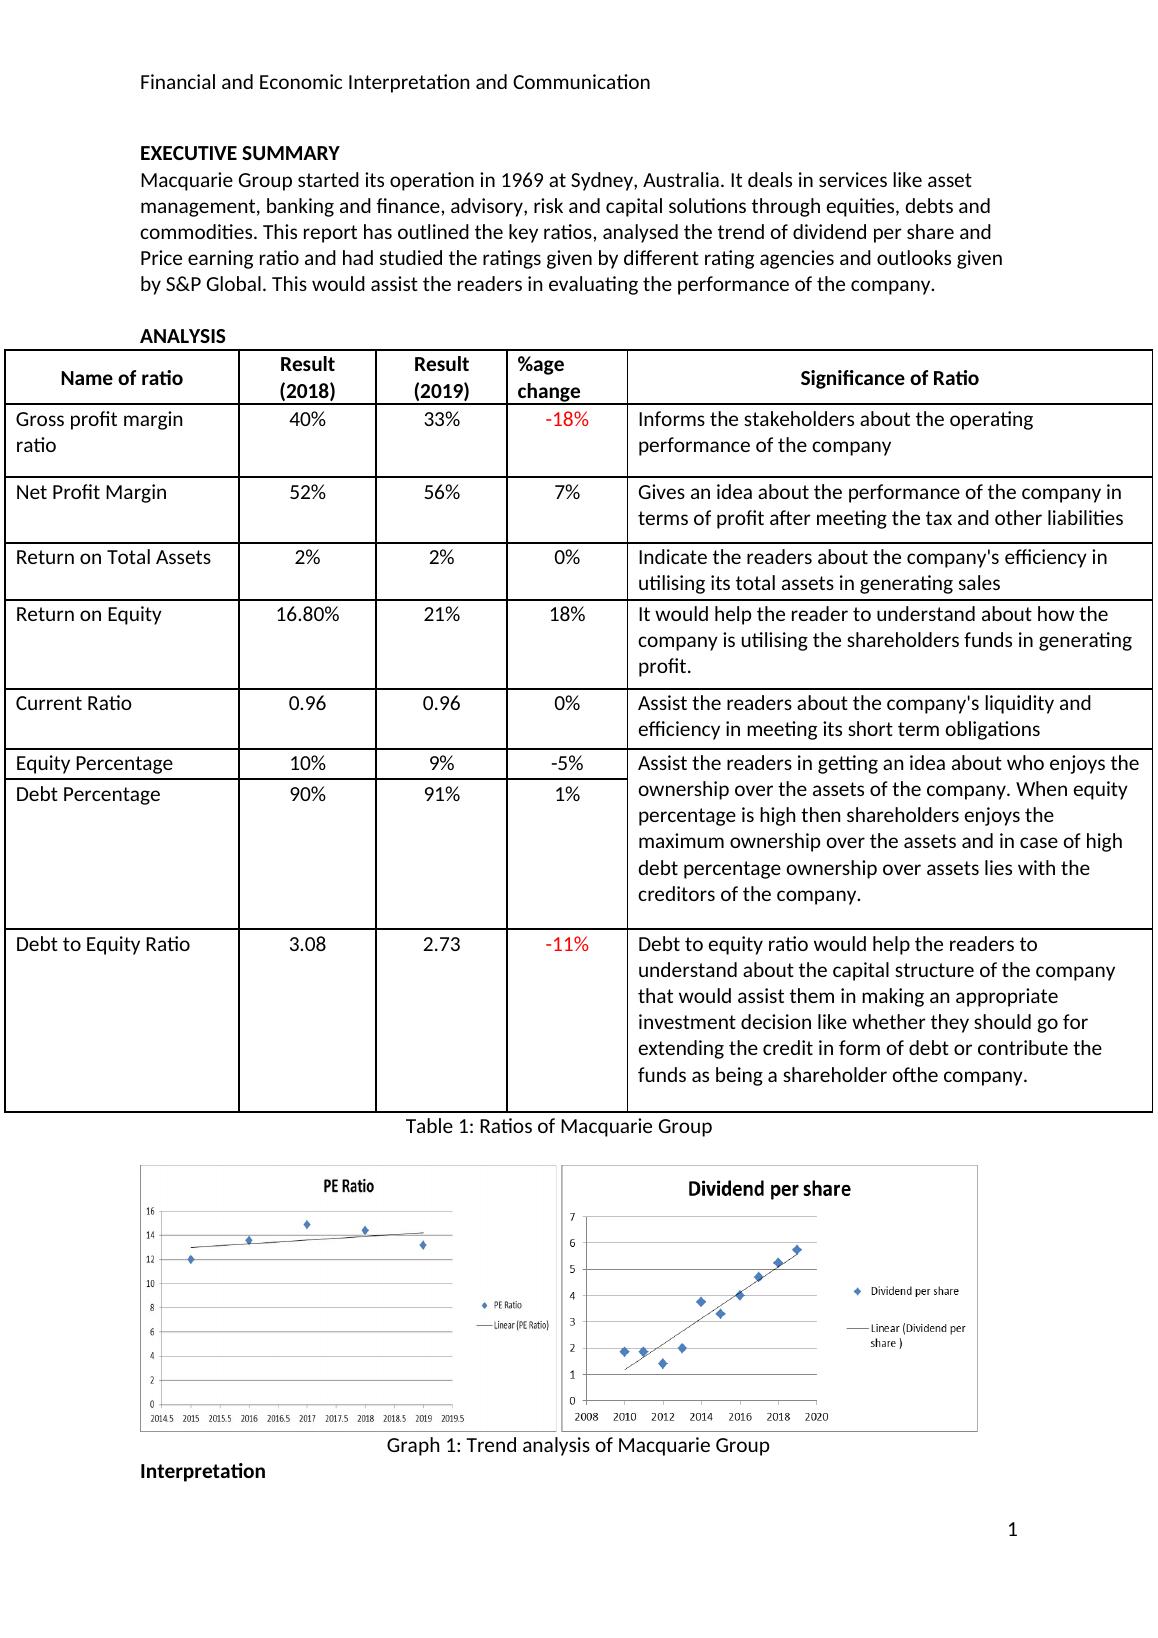
Graph 1: Trend analysis of Macquarie Group
Interpretation
The profitability ratios of Macquarie Group are quite impressive. The return on
equity of the group has gone up by 18% from 2018 to 2019 which shows that the
company is utilising the invested money well to generate the earnings for the
group. Then the capital invested by the group in total assets are not able to
generate earnings as a result it had remained constant at 2% return during the
years 2018 and 2019. Net profit margin of the company has shown an upward
trend as a result it has gone up by 7% in 2019. Here, readers could get an idea
about the efficiency of the group in generating profit on each dollar of sales and
the practice of effective cost management. Now, the figure which could upset
the readers is gross profit margin which has come down by 18%. It has fallen
down because of high employment expenses, non-technology expenses,
occupancy expenses, brokerage, commission and trade expenses and
unfavourable changes due to foreign exchange movements (Macquarie Group,
Annual Report 2019). The group has managed really well in meeting its due
short-term obligations with their current assets. As a result, the current ratio of
the group has remained same in 2018 and 2019 at 0.96 which is considered to
be an ideal ratio for the short term investment. The high debt percentage and
low equity percentage of Macquarie group displays that it finances most of its
asset through debt. We could see in the annual report that the debt issued
($50188m) by the company stands more than its total equity amount($18364m)
which shows that the raised amount through debt are being used to finance the
assets. This shows that the group is using the debt funds to finance its assets
and majority of the ownership on assets lies with the creditors. The Price-
earnings ratio of the group is showing an upward trend over the past five years
(2015-2019). The investment could be made in the group because of the high
probabilities of stock appreciation in future and high return on the investment.
The factor that actually motivates the shareholders is high dividend on their
shares. The group has always proved loyal to its shareholders as a result the
dividend per share of Macquarie Group has shown an upward trend in the last 19
years (2010-2019).Now if we look at the credit risk profile of the company then
the top rating agency has considered it stable in terms of risk related to the
credit which could be seen in the Appendix Table-2.The S&P poor has improved
the rating from stable to positive for Macquarie Group Limited because of the
improvement in the group’s risk profile. The S&P Group rated Macquarie Bank
Limited from negative to developing which displays the negative effect of
weakening of government support and the positive effect of improved profile of
risk. The improved risk profile is the result of diversification adopted in different
business activities (S&P Global Ratings, 2018). So, as per the credit rating from
the recognised entity, the investors’ funds are safe in the hands of the Macquarie
Group. Macquarie Group is actually having a sufficient capital and funding lines
to run its exclusive business model successfully without any difficulty which is
2
End of preview
Want to access all the pages? Upload your documents or become a member.
Related Documents
Ratio Analysis of Transurbanlg...
|7
|1239
|189
Report to Board of Directors for the substantial investmentslg...
|9
|1391
|46
Financial Analysis of Apple Inc. - Return on Assets, Equity, Capital, Gross Margin, SG&A Margin, Current Ratio, Quick Ratio, Net Debt to Equity, Total Revenue, Gross Profitlg...
|6
|951
|211
Financial Performance Analysis of Apix Printing, Deluxe Corporation and R.R. Donnelley & Sons Companylg...
|8
|1415
|434
Aptar Group Financial Health Analysislg...
|5
|869
|326
Principle of Finance: Income Statement, Balance Sheet, Ratio Analysislg...
|7
|939
|32