PepsiCo Financial Performance: Profitability, Liquidity, and Valuation
VerifiedAdded on 2022/08/20
|15
|2449
|11
Report
AI Summary
This report provides a comprehensive financial analysis of PepsiCo, evaluating its performance across several key areas. It begins with an executive summary and then delves into profitability ratios, including gross and net profit margins, comparing PepsiCo's performance to its competitor, Coca-Cola, over several years. The analysis then examines liquidity ratios, such as the current and quick ratios, to assess the company's ability to meet short-term obligations. The funding structure is then assessed, focusing on the debt-equity ratio. The report also includes an assessment of PepsiCo's share price, using DuPont analysis to break down Return on Equity (ROE) and identify the factors driving changes in ROE. The conclusion summarizes the findings, highlighting trends in profitability, liquidity, and the overall financial health of PepsiCo, with comparative analysis conducted for the period from 2014 to 2018. The report uses financial ratios to analyze the financial health of the company. The analysis includes comparisons with competitors and consideration of the business's underlying nature.
Running head: FINANCIAL HEALTH OF PEPSI CO.
FINANCIAL HEALTH OF PEPSI CO.
Name of the Student
Name of the University
Author's Note:
FINANCIAL HEALTH OF PEPSI CO.
Name of the Student
Name of the University
Author's Note:
Paraphrase This Document
Need a fresh take? Get an instant paraphrase of this document with our AI Paraphraser
1FINANCIAL HEALTH OF PEPSI CO.
Executive Summary
Pepsi co., considered as one of the world's largest food and beverage providing a brand whose
headquarter is situated in Harrison, New York. The profitability, liquidity ratio of the Company
along with its competitor "Coca-cola" has been discussed in the report to know the financial
health of the businesses. In addition, the funding structure of the Company has also been
discussed in the report along with the assessment of whether the share price is under, over or
fairly priced. Lastly, DuPont style analysis has been made in the report to analyse the ROE and
factors that lead to maximum change in ROE.
2FINANCIAL HEALTH OF PEPSI CO.
Table of Contents
Introduction................................................................................................................................................3
Discussion..................................................................................................................................................3
Profitability ratio....................................................................................................................................3
Liquidity ratio.........................................................................................................................................4
Funding structure..................................................................................................................................6
Assessment of Share Price.................................................................................................................7
Conclusion.................................................................................................................................................8
References..............................................................................................................................................10
Bibliography.............................................................................................................................................10
Appendix..................................................................................................................................................12
⊘ This is a preview!⊘
Do you want full access?
Subscribe today to unlock all pages.
Trusted by 1+ million students worldwide
3FINANCIAL HEALTH OF PEPSI CO.
Introduction
Pepsi co., considered as one of the world's largest food and beverage providing brand
whose headquarter is situated in Harrison, New York. The profitability, liquidity ratio of the
Company along with its competitor "Coca-Cola" has been discussed in the report to know the
financial health of these different businesses. In addition, the funding structure of the
Companies has also been discussed in the report along with the assessment of whether the
share price is under, over or fairly priced. Lastly, DuPont style analysis has been covered in the
report.
Discussion
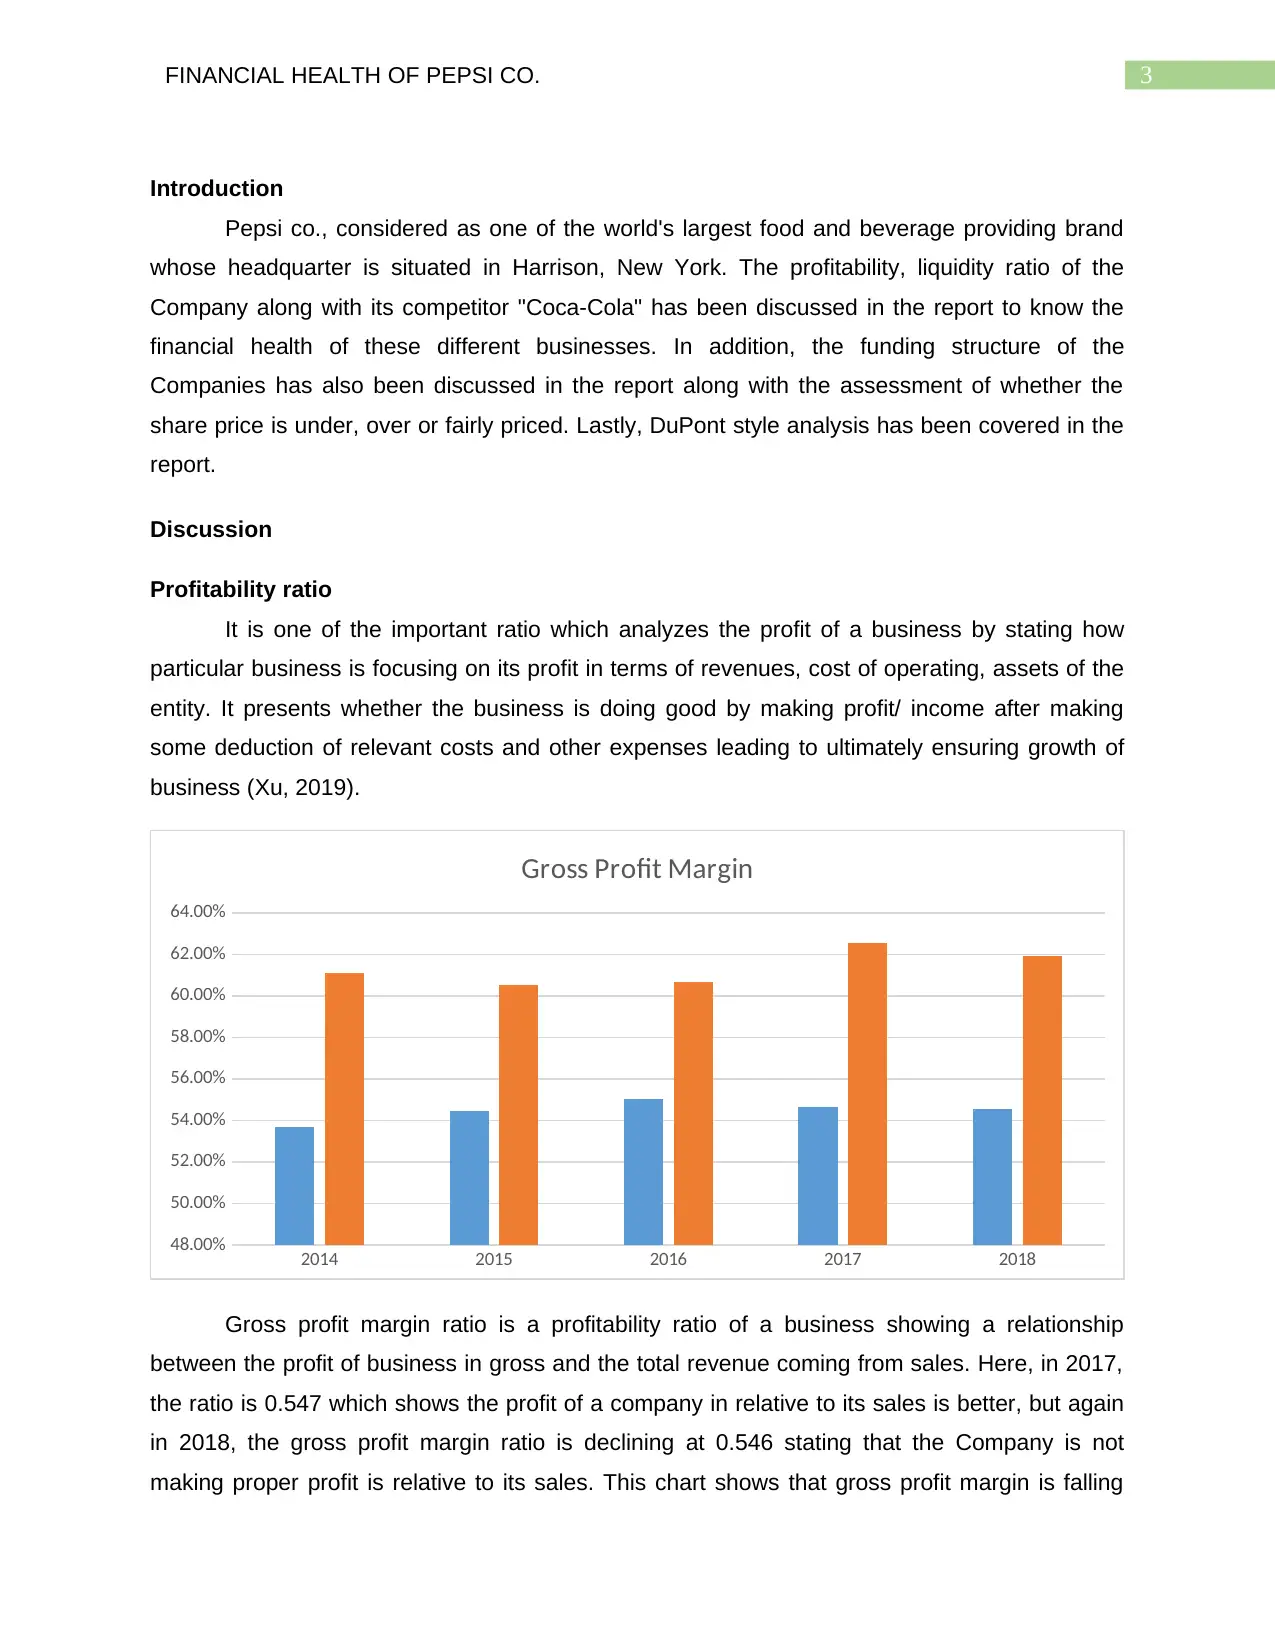
Profitability ratio
It is one of the important ratio which analyzes the profit of a business by stating how
particular business is focusing on its profit in terms of revenues, cost of operating, assets of the
entity. It presents whether the business is doing good by making profit/ income after making
some deduction of relevant costs and other expenses leading to ultimately ensuring growth of
business (Xu, 2019).
2014 2015 2016 2017 2018
48.00%
50.00%
52.00%
54.00%
56.00%
58.00%
60.00%
62.00%
64.00%
Gross Profit Margin
Gross profit margin ratio is a profitability ratio of a business showing a relationship
between the profit of business in gross and the total revenue coming from sales. Here, in 2017,
the ratio is 0.547 which shows the profit of a company in relative to its sales is better, but again
in 2018, the gross profit margin ratio is declining at 0.546 stating that the Company is not
making proper profit is relative to its sales. This chart shows that gross profit margin is falling
Introduction
Pepsi co., considered as one of the world's largest food and beverage providing brand
whose headquarter is situated in Harrison, New York. The profitability, liquidity ratio of the
Company along with its competitor "Coca-Cola" has been discussed in the report to know the
financial health of these different businesses. In addition, the funding structure of the
Companies has also been discussed in the report along with the assessment of whether the
share price is under, over or fairly priced. Lastly, DuPont style analysis has been covered in the
report.
Discussion
Profitability ratio
It is one of the important ratio which analyzes the profit of a business by stating how
particular business is focusing on its profit in terms of revenues, cost of operating, assets of the
entity. It presents whether the business is doing good by making profit/ income after making
some deduction of relevant costs and other expenses leading to ultimately ensuring growth of
business (Xu, 2019).
2014 2015 2016 2017 2018
48.00%
50.00%
52.00%
54.00%
56.00%
58.00%
60.00%
62.00%
64.00%
Gross Profit Margin
Gross profit margin ratio is a profitability ratio of a business showing a relationship
between the profit of business in gross and the total revenue coming from sales. Here, in 2017,
the ratio is 0.547 which shows the profit of a company in relative to its sales is better, but again
in 2018, the gross profit margin ratio is declining at 0.546 stating that the Company is not
making proper profit is relative to its sales. This chart shows that gross profit margin is falling
Paraphrase This Document
Need a fresh take? Get an instant paraphrase of this document with our AI Paraphraser
4FINANCIAL HEALTH OF PEPSI CO.
from 2016; in 2016, it was at 55.06%, and in 2017 went down at 54.67%, and now in 2018, it
falls to 54.56%. The blue color represents Pepsico, and the other represents its competitor
Coca Cola. The graph shows the gross profit margin of both the companies to draw the
comparison and evaluate the growth and its financial performance. The analysis is conducted
for five years to assess its financial, liquid performance, and analyze overall growth.
2014 2015 2016 2017 2018
0.00%
5.00%
10.00%
15.00%
20.00%
25.00%
Net Profit Margin
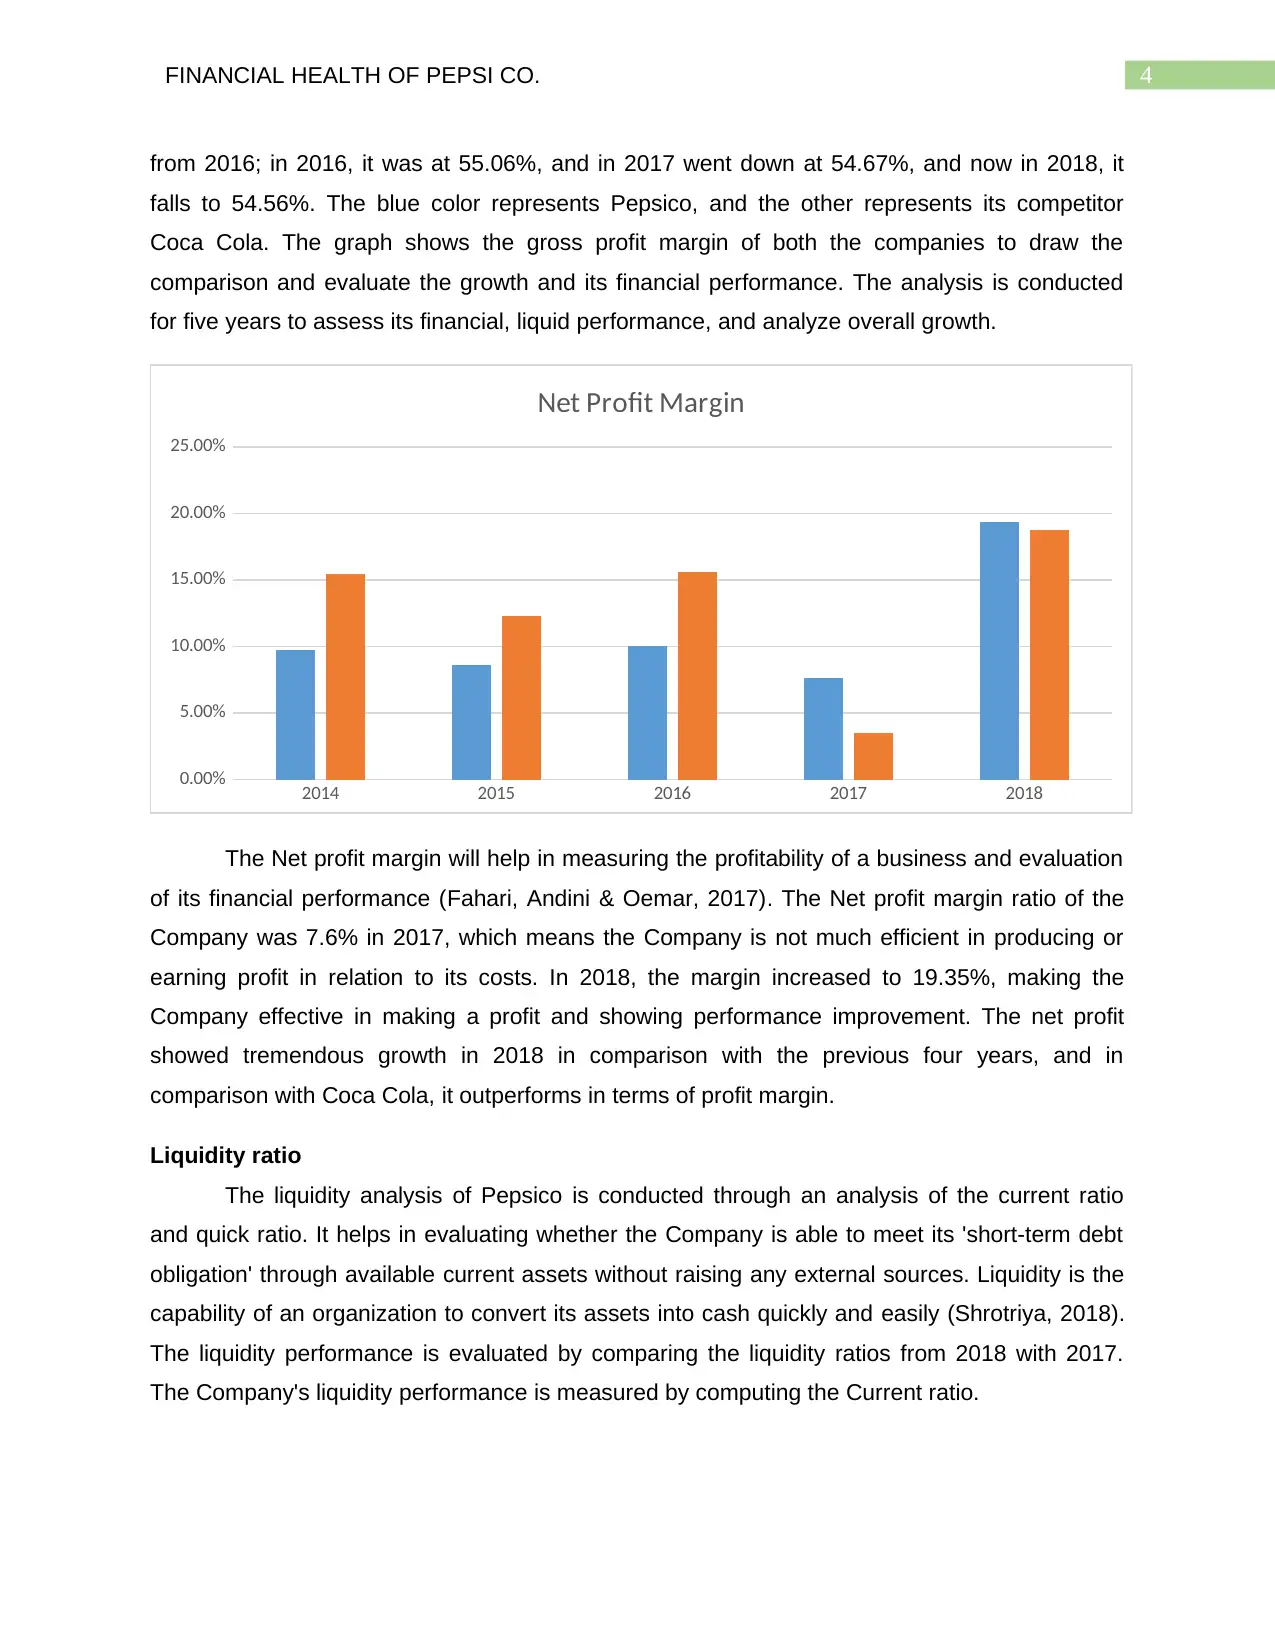
The Net profit margin will help in measuring the profitability of a business and evaluation
of its financial performance (Fahari, Andini & Oemar, 2017). The Net profit margin ratio of the
Company was 7.6% in 2017, which means the Company is not much efficient in producing or
earning profit in relation to its costs. In 2018, the margin increased to 19.35%, making the
Company effective in making a profit and showing performance improvement. The net profit
showed tremendous growth in 2018 in comparison with the previous four years, and in
comparison with Coca Cola, it outperforms in terms of profit margin.
Liquidity ratio
The liquidity analysis of Pepsico is conducted through an analysis of the current ratio
and quick ratio. It helps in evaluating whether the Company is able to meet its 'short-term debt
obligation' through available current assets without raising any external sources. Liquidity is the
capability of an organization to convert its assets into cash quickly and easily (Shrotriya, 2018).
The liquidity performance is evaluated by comparing the liquidity ratios from 2018 with 2017.
The Company's liquidity performance is measured by computing the Current ratio.
from 2016; in 2016, it was at 55.06%, and in 2017 went down at 54.67%, and now in 2018, it
falls to 54.56%. The blue color represents Pepsico, and the other represents its competitor
Coca Cola. The graph shows the gross profit margin of both the companies to draw the
comparison and evaluate the growth and its financial performance. The analysis is conducted
for five years to assess its financial, liquid performance, and analyze overall growth.
2014 2015 2016 2017 2018
0.00%
5.00%
10.00%
15.00%
20.00%
25.00%
Net Profit Margin
The Net profit margin will help in measuring the profitability of a business and evaluation
of its financial performance (Fahari, Andini & Oemar, 2017). The Net profit margin ratio of the
Company was 7.6% in 2017, which means the Company is not much efficient in producing or
earning profit in relation to its costs. In 2018, the margin increased to 19.35%, making the
Company effective in making a profit and showing performance improvement. The net profit
showed tremendous growth in 2018 in comparison with the previous four years, and in
comparison with Coca Cola, it outperforms in terms of profit margin.
Liquidity ratio
The liquidity analysis of Pepsico is conducted through an analysis of the current ratio
and quick ratio. It helps in evaluating whether the Company is able to meet its 'short-term debt
obligation' through available current assets without raising any external sources. Liquidity is the
capability of an organization to convert its assets into cash quickly and easily (Shrotriya, 2018).
The liquidity performance is evaluated by comparing the liquidity ratios from 2018 with 2017.
The Company's liquidity performance is measured by computing the Current ratio.
5FINANCIAL HEALTH OF PEPSI CO.
2014 2015 2016 2017 2018
-
0.20
0.40
0.60
0.80
1.00
1.20
1.40
1.60
Current ratio
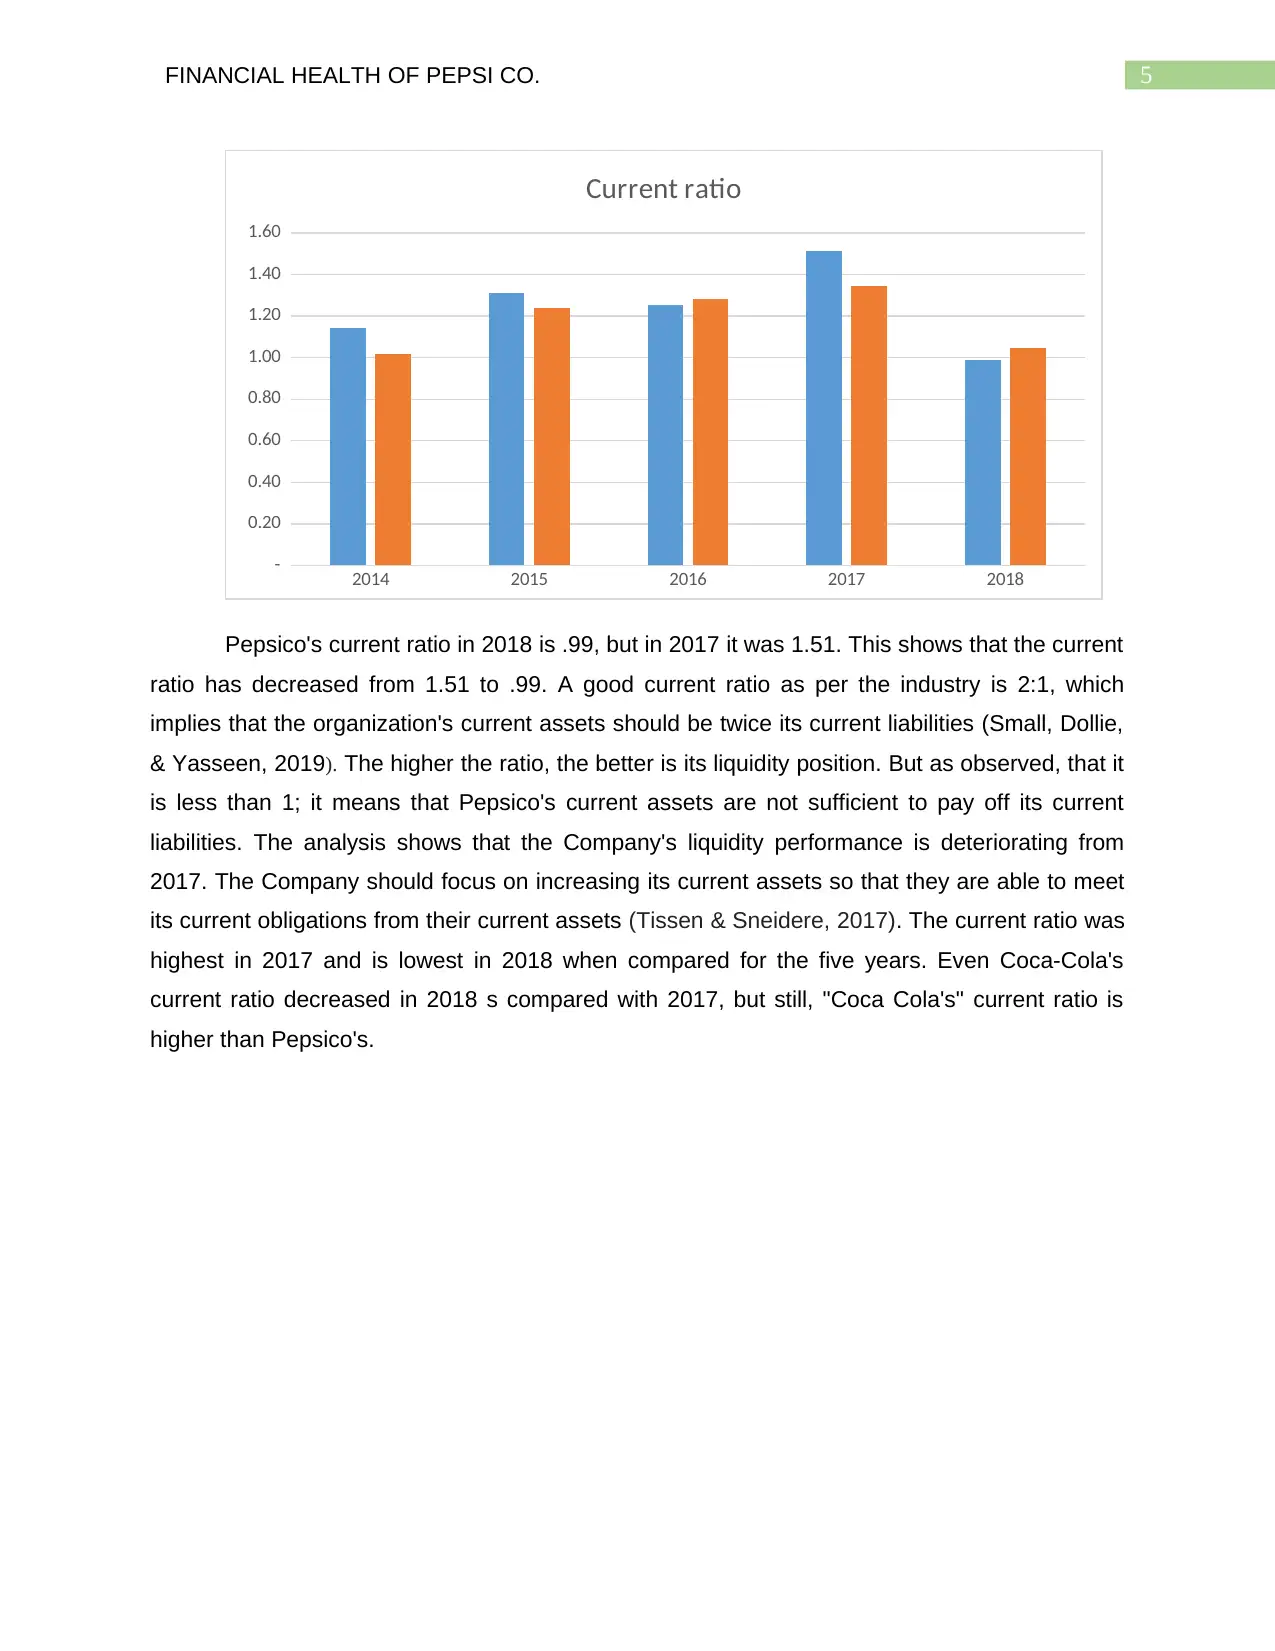
Pepsico's current ratio in 2018 is .99, but in 2017 it was 1.51. This shows that the current
ratio has decreased from 1.51 to .99. A good current ratio as per the industry is 2:1, which
implies that the organization's current assets should be twice its current liabilities (Small, Dollie,
& Yasseen, 2019). The higher the ratio, the better is its liquidity position. But as observed, that it
is less than 1; it means that Pepsico's current assets are not sufficient to pay off its current
liabilities. The analysis shows that the Company's liquidity performance is deteriorating from
2017. The Company should focus on increasing its current assets so that they are able to meet
its current obligations from their current assets (Tissen & Sneidere, 2017). The current ratio was
highest in 2017 and is lowest in 2018 when compared for the five years. Even Coca-Cola's
current ratio decreased in 2018 s compared with 2017, but still, "Coca Cola's" current ratio is
higher than Pepsico's.
2014 2015 2016 2017 2018
-
0.20
0.40
0.60
0.80
1.00
1.20
1.40
1.60
Current ratio
Pepsico's current ratio in 2018 is .99, but in 2017 it was 1.51. This shows that the current
ratio has decreased from 1.51 to .99. A good current ratio as per the industry is 2:1, which
implies that the organization's current assets should be twice its current liabilities (Small, Dollie,
& Yasseen, 2019). The higher the ratio, the better is its liquidity position. But as observed, that it
is less than 1; it means that Pepsico's current assets are not sufficient to pay off its current
liabilities. The analysis shows that the Company's liquidity performance is deteriorating from
2017. The Company should focus on increasing its current assets so that they are able to meet
its current obligations from their current assets (Tissen & Sneidere, 2017). The current ratio was
highest in 2017 and is lowest in 2018 when compared for the five years. Even Coca-Cola's
current ratio decreased in 2018 s compared with 2017, but still, "Coca Cola's" current ratio is
higher than Pepsico's.
⊘ This is a preview!⊘
Do you want full access?
Subscribe today to unlock all pages.
Trusted by 1+ million students worldwide
6FINANCIAL HEALTH OF PEPSI CO.
2014 2015 2016 2017 2018
-
0.20
0.40
0.60
0.80
1.00
1.20
1.40
Quick ratio
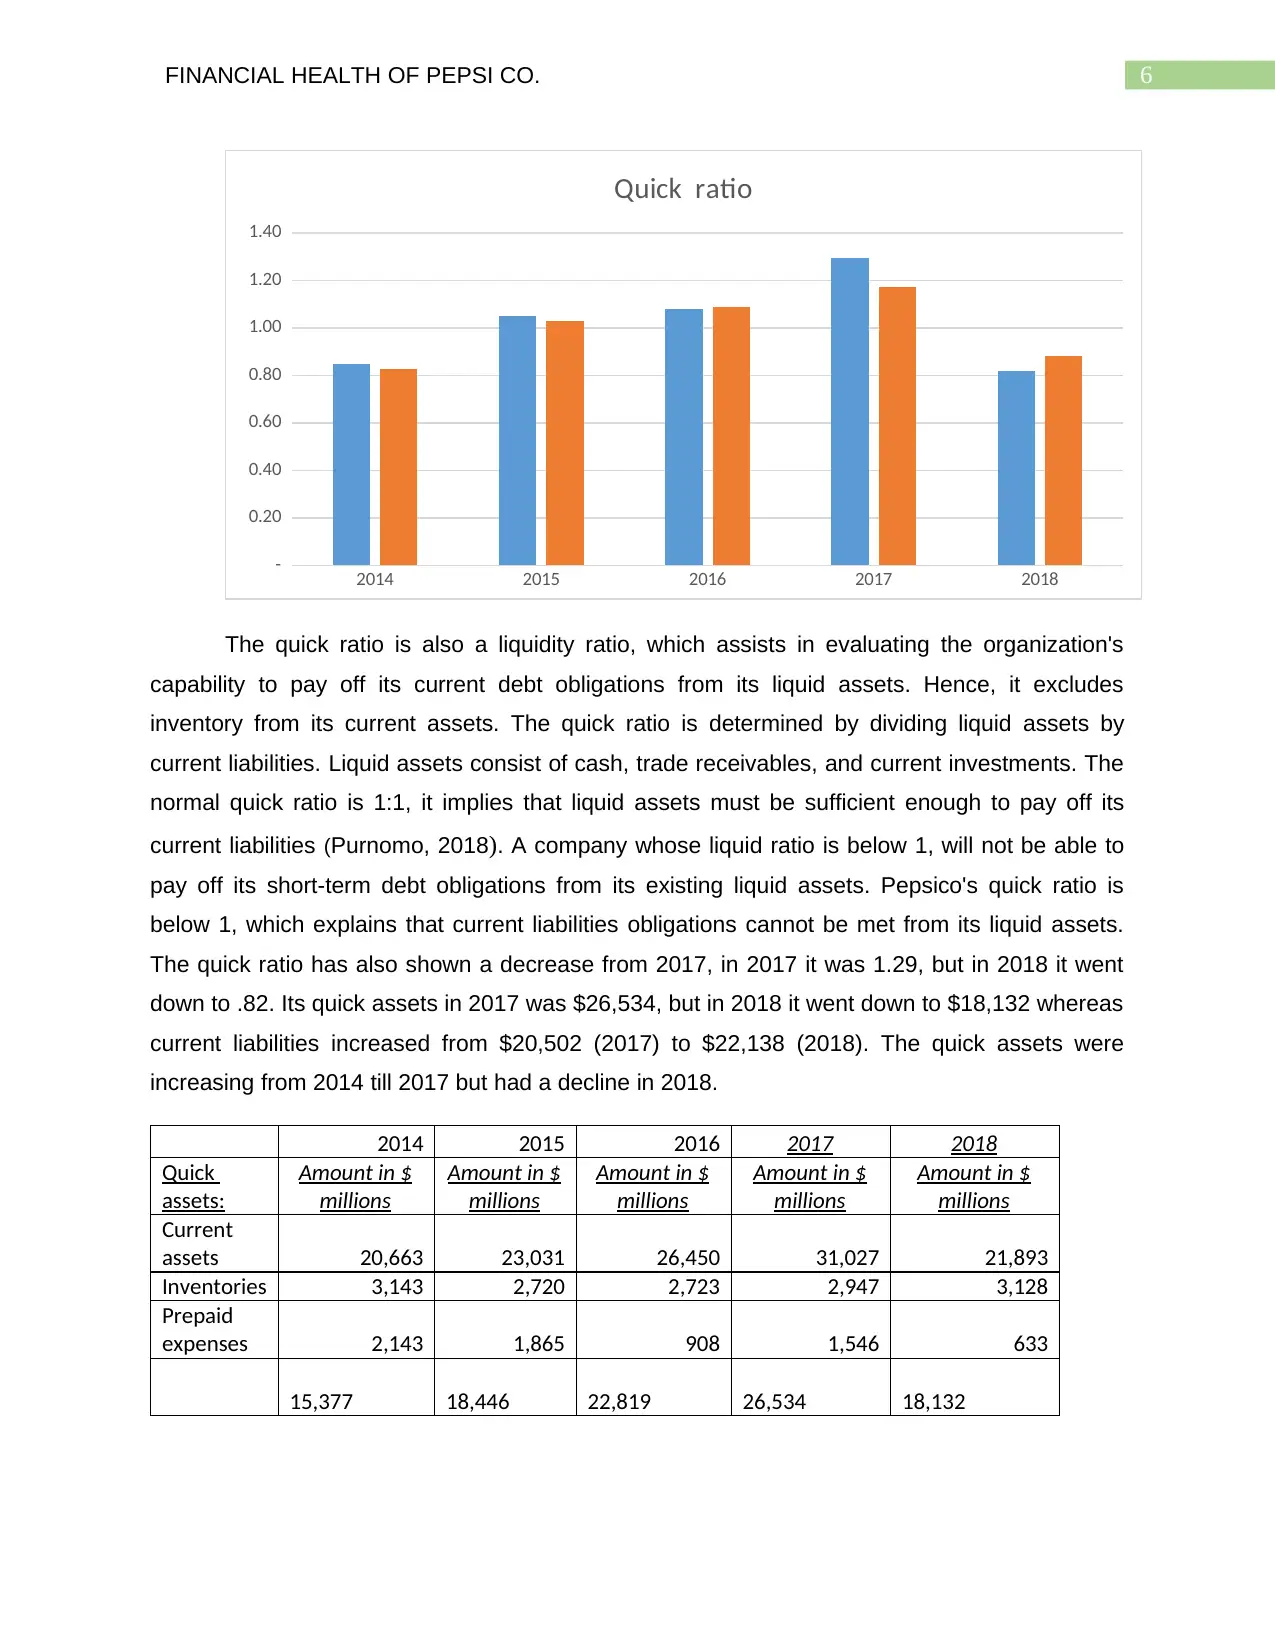
The quick ratio is also a liquidity ratio, which assists in evaluating the organization's
capability to pay off its current debt obligations from its liquid assets. Hence, it excludes
inventory from its current assets. The quick ratio is determined by dividing liquid assets by
current liabilities. Liquid assets consist of cash, trade receivables, and current investments. The
normal quick ratio is 1:1, it implies that liquid assets must be sufficient enough to pay off its
current liabilities (Purnomo, 2018). A company whose liquid ratio is below 1, will not be able to
pay off its short-term debt obligations from its existing liquid assets. Pepsico's quick ratio is
below 1, which explains that current liabilities obligations cannot be met from its liquid assets.
The quick ratio has also shown a decrease from 2017, in 2017 it was 1.29, but in 2018 it went
down to .82. Its quick assets in 2017 was $26,534, but in 2018 it went down to $18,132 whereas
current liabilities increased from $20,502 (2017) to $22,138 (2018). The quick assets were
increasing from 2014 till 2017 but had a decline in 2018.
2014 2015 2016 2017 2018
Quick
assets:
Amount in $
millions
Amount in $
millions
Amount in $
millions
Amount in $
millions
Amount in $
millions
Current
assets 20,663 23,031 26,450 31,027 21,893
Inventories 3,143 2,720 2,723 2,947 3,128
Prepaid
expenses 2,143 1,865 908 1,546 633
15,377 18,446 22,819 26,534 18,132
2014 2015 2016 2017 2018
-
0.20
0.40
0.60
0.80
1.00
1.20
1.40
Quick ratio
The quick ratio is also a liquidity ratio, which assists in evaluating the organization's
capability to pay off its current debt obligations from its liquid assets. Hence, it excludes
inventory from its current assets. The quick ratio is determined by dividing liquid assets by
current liabilities. Liquid assets consist of cash, trade receivables, and current investments. The
normal quick ratio is 1:1, it implies that liquid assets must be sufficient enough to pay off its
current liabilities (Purnomo, 2018). A company whose liquid ratio is below 1, will not be able to
pay off its short-term debt obligations from its existing liquid assets. Pepsico's quick ratio is
below 1, which explains that current liabilities obligations cannot be met from its liquid assets.
The quick ratio has also shown a decrease from 2017, in 2017 it was 1.29, but in 2018 it went
down to .82. Its quick assets in 2017 was $26,534, but in 2018 it went down to $18,132 whereas
current liabilities increased from $20,502 (2017) to $22,138 (2018). The quick assets were
increasing from 2014 till 2017 but had a decline in 2018.
2014 2015 2016 2017 2018
Quick
assets:
Amount in $
millions
Amount in $
millions
Amount in $
millions
Amount in $
millions
Amount in $
millions
Current
assets 20,663 23,031 26,450 31,027 21,893
Inventories 3,143 2,720 2,723 2,947 3,128
Prepaid
expenses 2,143 1,865 908 1,546 633
15,377 18,446 22,819 26,534 18,132
Paraphrase This Document
Need a fresh take? Get an instant paraphrase of this document with our AI Paraphraser
7FINANCIAL HEALTH OF PEPSI CO.
Current
liabilities
18,092 17,578 21,135 20,502 22,138
This overall goes to show that the Company's liquidity is not strong and performance is
falling down. Pepsico should try to increase their current assets and liquid assets so that they
will be capable to meet its current liabilities from current and quick assets itself and so they do
not have to utilise their non-current assets.
Funding structure
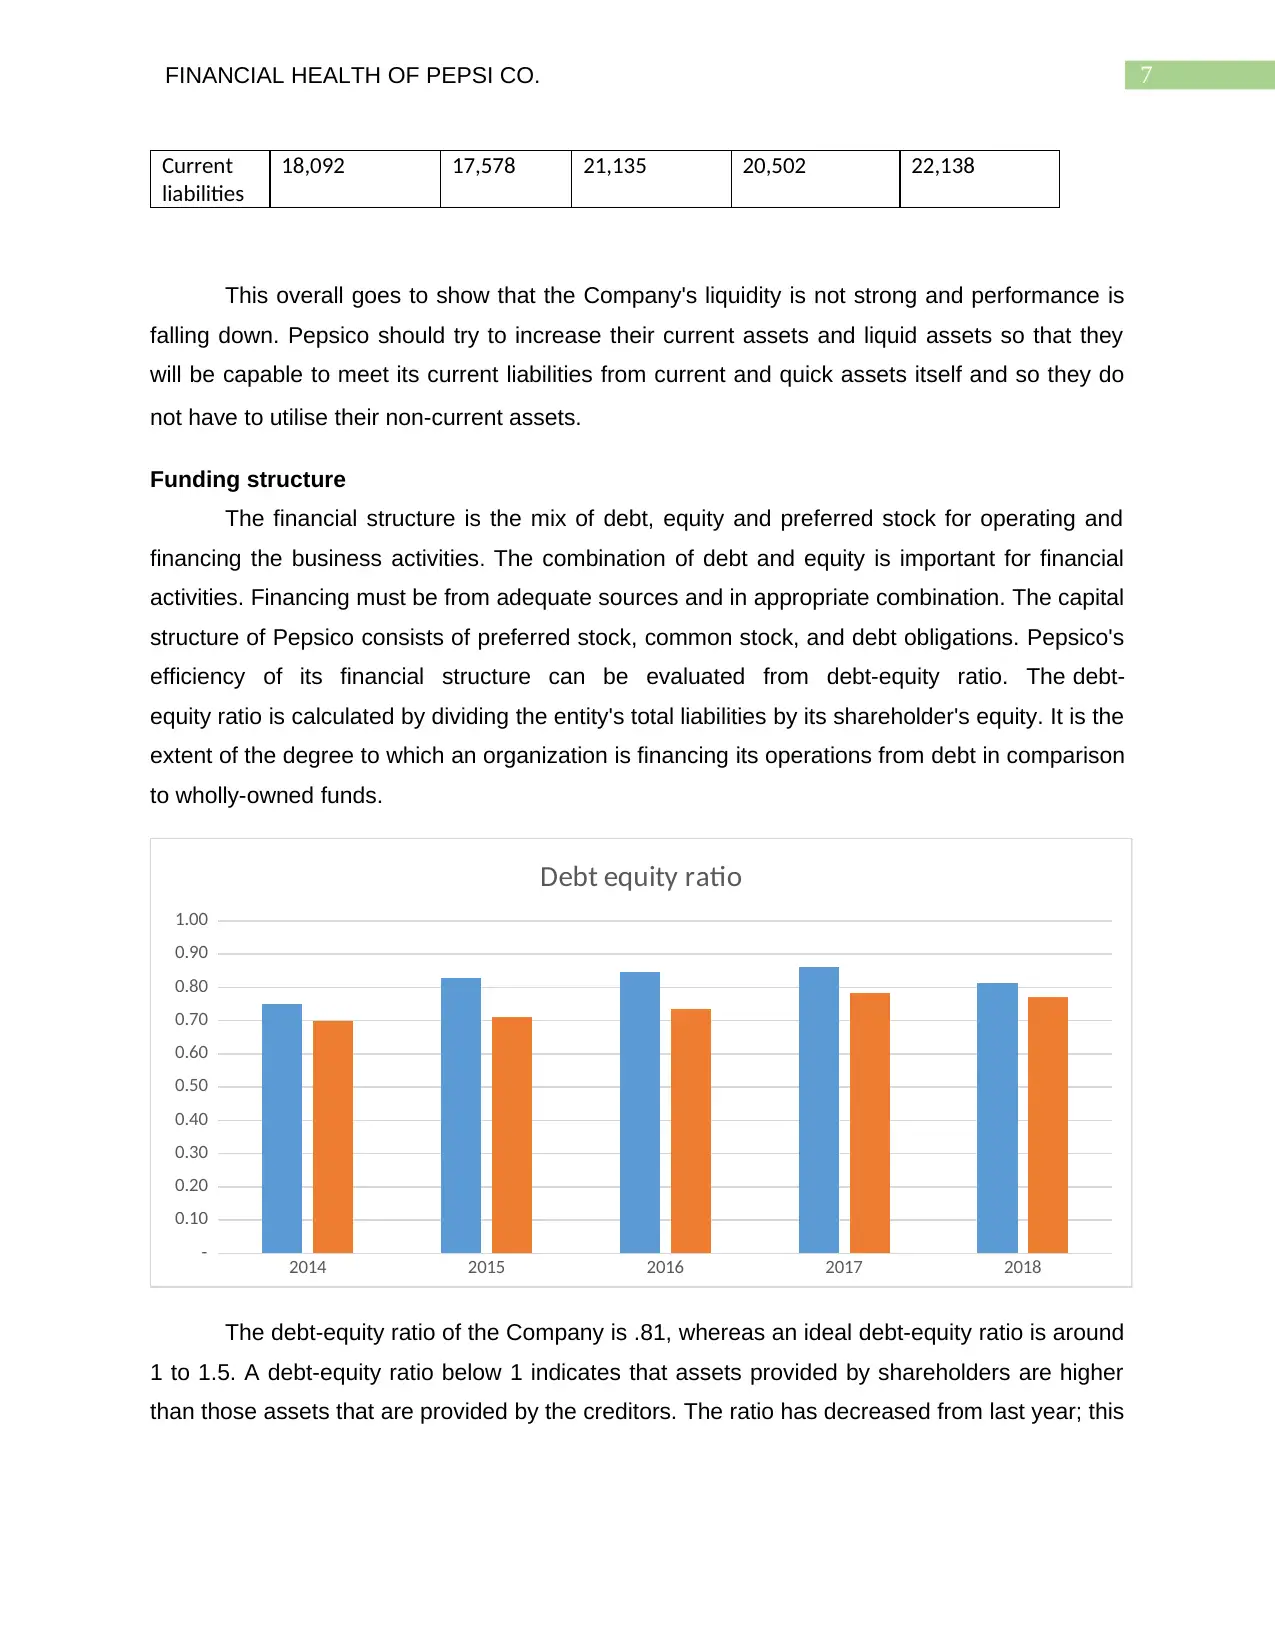
The financial structure is the mix of debt, equity and preferred stock for operating and
financing the business activities. The combination of debt and equity is important for financial
activities. Financing must be from adequate sources and in appropriate combination. The capital
structure of Pepsico consists of preferred stock, common stock, and debt obligations. Pepsico's
efficiency of its financial structure can be evaluated from debt-equity ratio. The debt-
equity ratio is calculated by dividing the entity's total liabilities by its shareholder's equity. It is the
extent of the degree to which an organization is financing its operations from debt in comparison
to wholly-owned funds.
2014 2015 2016 2017 2018
-
0.10
0.20
0.30
0.40
0.50
0.60
0.70
0.80
0.90
1.00
Debt equity ratio
The debt-equity ratio of the Company is .81, whereas an ideal debt-equity ratio is around
1 to 1.5. A debt-equity ratio below 1 indicates that assets provided by shareholders are higher
than those assets that are provided by the creditors. The ratio has decreased from last year; this
Current
liabilities
18,092 17,578 21,135 20,502 22,138
This overall goes to show that the Company's liquidity is not strong and performance is
falling down. Pepsico should try to increase their current assets and liquid assets so that they
will be capable to meet its current liabilities from current and quick assets itself and so they do
not have to utilise their non-current assets.
Funding structure
The financial structure is the mix of debt, equity and preferred stock for operating and
financing the business activities. The combination of debt and equity is important for financial
activities. Financing must be from adequate sources and in appropriate combination. The capital
structure of Pepsico consists of preferred stock, common stock, and debt obligations. Pepsico's
efficiency of its financial structure can be evaluated from debt-equity ratio. The debt-
equity ratio is calculated by dividing the entity's total liabilities by its shareholder's equity. It is the
extent of the degree to which an organization is financing its operations from debt in comparison
to wholly-owned funds.
2014 2015 2016 2017 2018
-
0.10
0.20
0.30
0.40
0.50
0.60
0.70
0.80
0.90
1.00
Debt equity ratio
The debt-equity ratio of the Company is .81, whereas an ideal debt-equity ratio is around
1 to 1.5. A debt-equity ratio below 1 indicates that assets provided by shareholders are higher
than those assets that are provided by the creditors. The ratio has decreased from last year; this
8FINANCIAL HEALTH OF PEPSI CO.
indicates that lower financing from debt versus funding through equity. Debt is lower than the
equity, and it can be good for the Company.
Assessment of Share Price
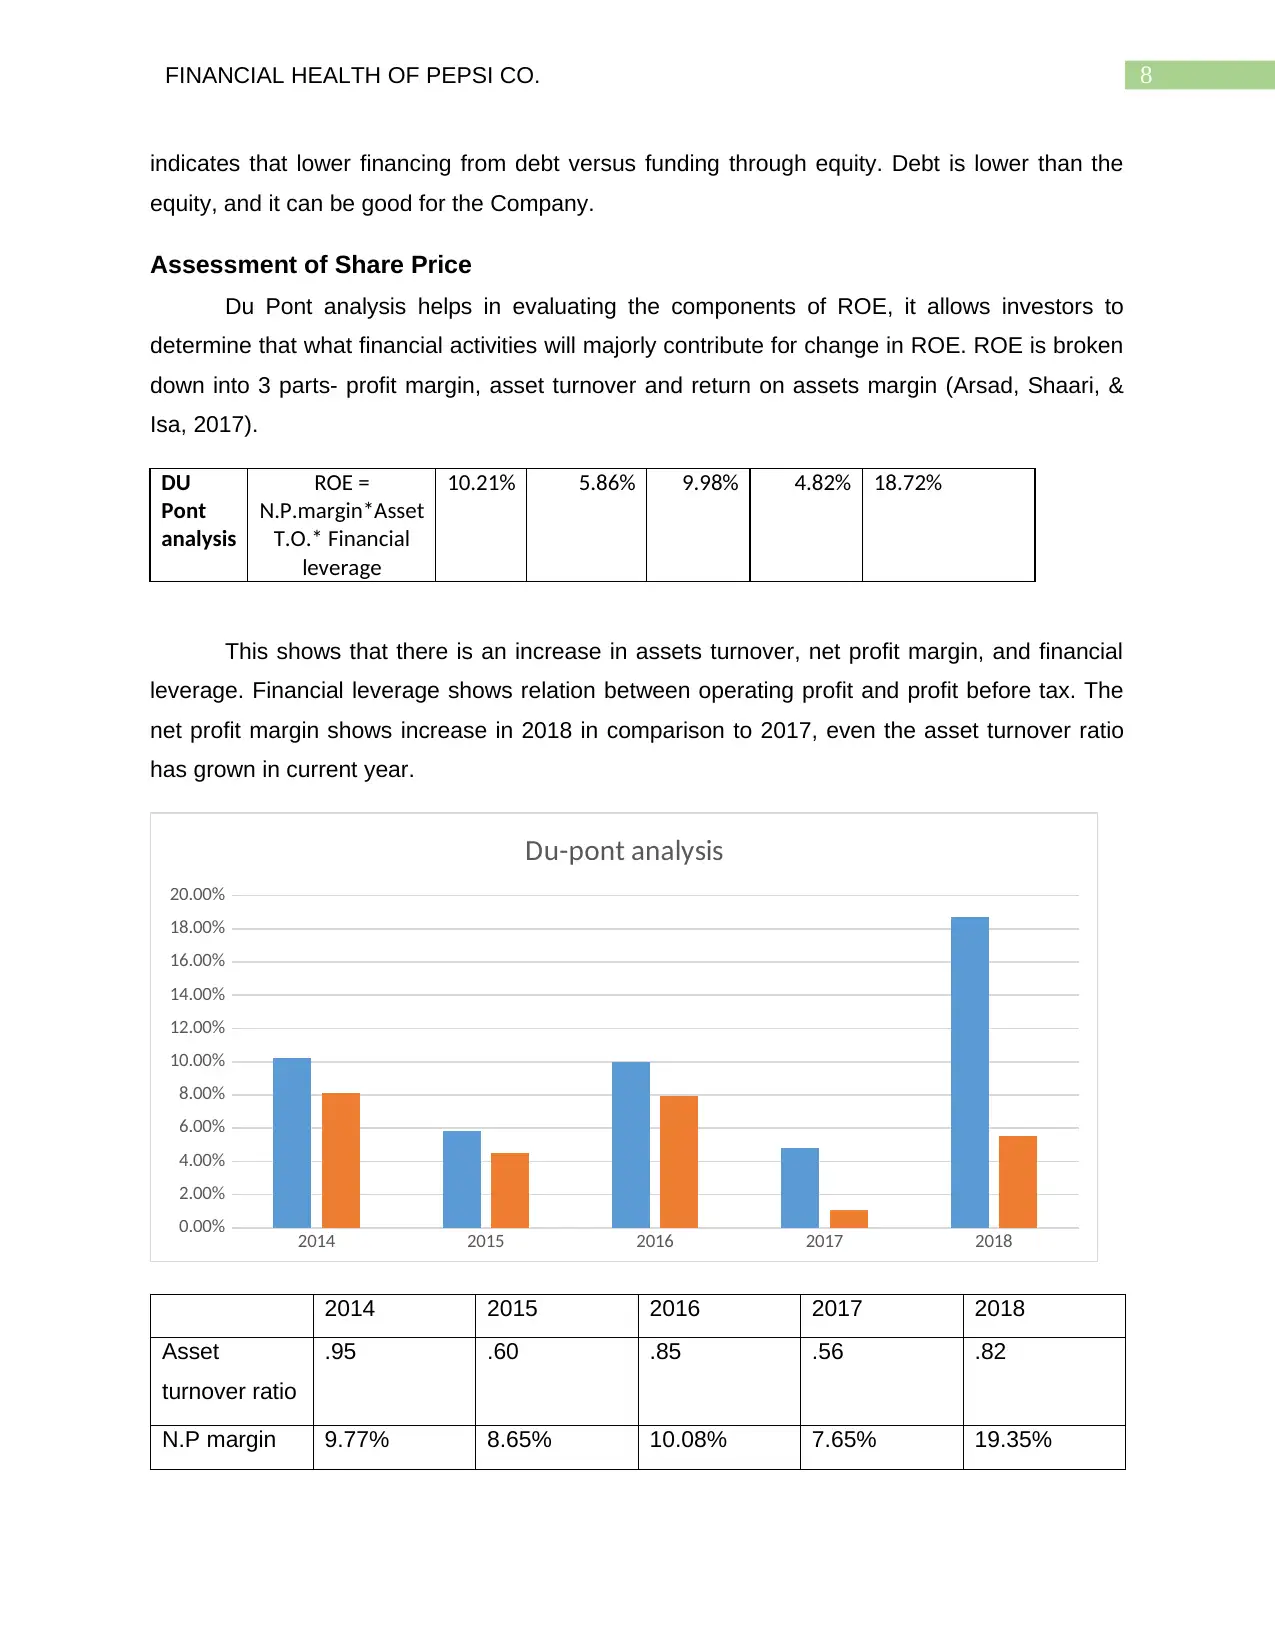
Du Pont analysis helps in evaluating the components of ROE, it allows investors to
determine that what financial activities will majorly contribute for change in ROE. ROE is broken
down into 3 parts- profit margin, asset turnover and return on assets margin (Arsad, Shaari, &
Isa, 2017).
DU
Pont
analysis
ROE =
N.P.margin*Asset
T.O.* Financial
leverage
10.21% 5.86% 9.98% 4.82% 18.72%
This shows that there is an increase in assets turnover, net profit margin, and financial
leverage. Financial leverage shows relation between operating profit and profit before tax. The
net profit margin shows increase in 2018 in comparison to 2017, even the asset turnover ratio
has grown in current year.
2014 2015 2016 2017 2018
0.00%
2.00%
4.00%
6.00%
8.00%
10.00%
12.00%
14.00%
16.00%
18.00%
20.00%
Du-pont analysis
2014 2015 2016 2017 2018
Asset
turnover ratio
.95 .60 .85 .56 .82
N.P margin 9.77% 8.65% 10.08% 7.65% 19.35%
indicates that lower financing from debt versus funding through equity. Debt is lower than the
equity, and it can be good for the Company.
Assessment of Share Price
Du Pont analysis helps in evaluating the components of ROE, it allows investors to
determine that what financial activities will majorly contribute for change in ROE. ROE is broken
down into 3 parts- profit margin, asset turnover and return on assets margin (Arsad, Shaari, &
Isa, 2017).
DU
Pont
analysis
ROE =
N.P.margin*Asset
T.O.* Financial
leverage
10.21% 5.86% 9.98% 4.82% 18.72%
This shows that there is an increase in assets turnover, net profit margin, and financial
leverage. Financial leverage shows relation between operating profit and profit before tax. The
net profit margin shows increase in 2018 in comparison to 2017, even the asset turnover ratio
has grown in current year.
2014 2015 2016 2017 2018
0.00%
2.00%
4.00%
6.00%
8.00%
10.00%
12.00%
14.00%
16.00%
18.00%
20.00%
Du-pont analysis
2014 2015 2016 2017 2018
Asset
turnover ratio
.95 .60 .85 .56 .82
N.P margin 9.77% 8.65% 10.08% 7.65% 19.35%
⊘ This is a preview!⊘
Do you want full access?
Subscribe today to unlock all pages.
Trusted by 1+ million students worldwide
9FINANCIAL HEALTH OF PEPSI CO.
Financial
leverage
1.10 1.13 1.16 1.13 1.18
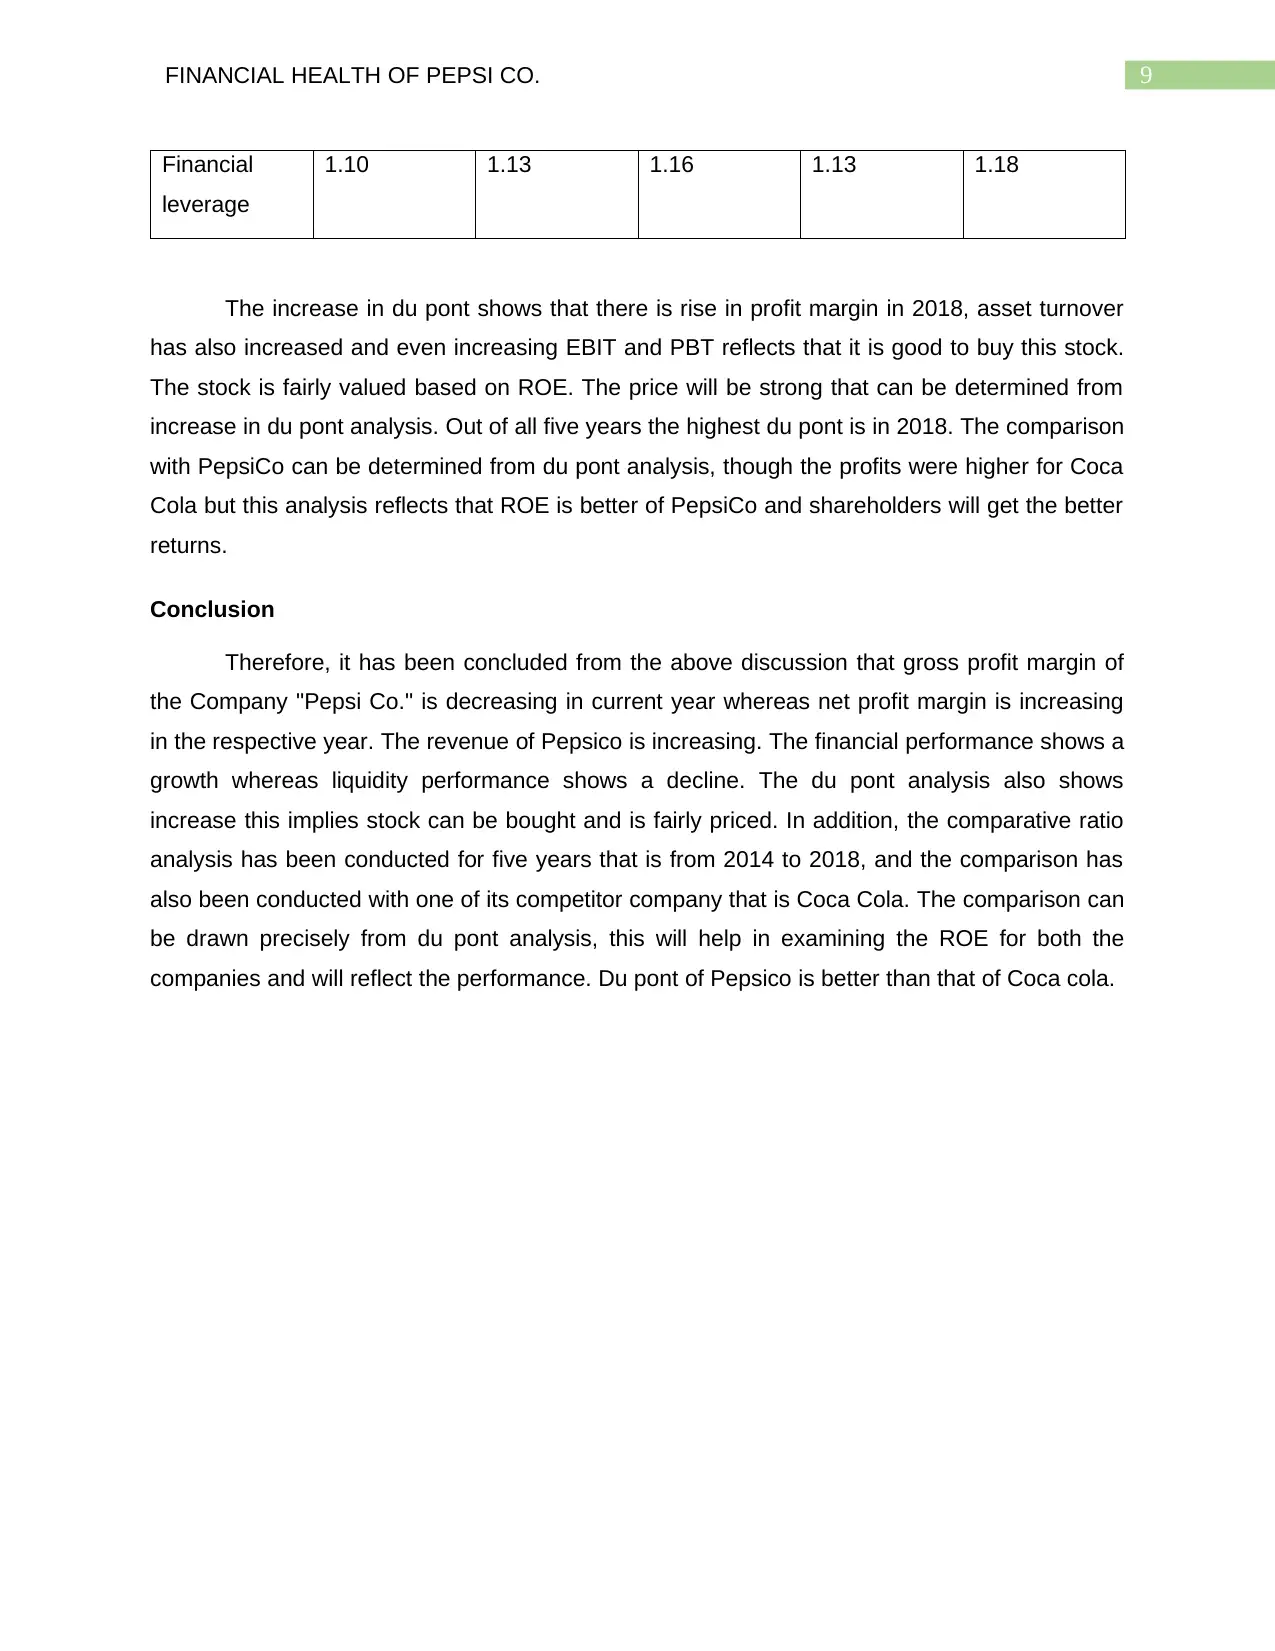
The increase in du pont shows that there is rise in profit margin in 2018, asset turnover
has also increased and even increasing EBIT and PBT reflects that it is good to buy this stock.
The stock is fairly valued based on ROE. The price will be strong that can be determined from
increase in du pont analysis. Out of all five years the highest du pont is in 2018. The comparison
with PepsiCo can be determined from du pont analysis, though the profits were higher for Coca
Cola but this analysis reflects that ROE is better of PepsiCo and shareholders will get the better
returns.
Conclusion
Therefore, it has been concluded from the above discussion that gross profit margin of
the Company "Pepsi Co." is decreasing in current year whereas net profit margin is increasing
in the respective year. The revenue of Pepsico is increasing. The financial performance shows a
growth whereas liquidity performance shows a decline. The du pont analysis also shows
increase this implies stock can be bought and is fairly priced. In addition, the comparative ratio
analysis has been conducted for five years that is from 2014 to 2018, and the comparison has
also been conducted with one of its competitor company that is Coca Cola. The comparison can
be drawn precisely from du pont analysis, this will help in examining the ROE for both the
companies and will reflect the performance. Du pont of Pepsico is better than that of Coca cola.
Financial
leverage
1.10 1.13 1.16 1.13 1.18
The increase in du pont shows that there is rise in profit margin in 2018, asset turnover
has also increased and even increasing EBIT and PBT reflects that it is good to buy this stock.
The stock is fairly valued based on ROE. The price will be strong that can be determined from
increase in du pont analysis. Out of all five years the highest du pont is in 2018. The comparison
with PepsiCo can be determined from du pont analysis, though the profits were higher for Coca
Cola but this analysis reflects that ROE is better of PepsiCo and shareholders will get the better
returns.
Conclusion
Therefore, it has been concluded from the above discussion that gross profit margin of
the Company "Pepsi Co." is decreasing in current year whereas net profit margin is increasing
in the respective year. The revenue of Pepsico is increasing. The financial performance shows a
growth whereas liquidity performance shows a decline. The du pont analysis also shows
increase this implies stock can be bought and is fairly priced. In addition, the comparative ratio
analysis has been conducted for five years that is from 2014 to 2018, and the comparison has
also been conducted with one of its competitor company that is Coca Cola. The comparison can
be drawn precisely from du pont analysis, this will help in examining the ROE for both the
companies and will reflect the performance. Du pont of Pepsico is better than that of Coca cola.
Paraphrase This Document
Need a fresh take? Get an instant paraphrase of this document with our AI Paraphraser
10FINANCIAL HEALTH OF PEPSI CO.
References
Arsad, R., Shaari, S. N. M., & Isa, Z. (2017, November). Comparative study on DuPont analysis
and DEA models for measuring stock performance using financial ratio. In AIP
Conference Proceedings (Vol. 1905, No. 1, p. 040007). AIP Publishing LLC.
Fahari, H., Andini, R., and Oemar, A., (2017). COMPARATIVE ANALYSIS OF CURRENT
RATIO, DEBT TO ASSETS RATIO, DEBT TO EQUITY RATIO, NET PROFIT MARGIN
AND RETURN ON ASSETS BEFORE AND AFTER IFRS CONVERGENCE (Study on
Trading Companies Listed on the Stock Exchange Year 2009-2015). Journal Of
Accounting, 3(3).
KOSTYUKOVA, E. I., YAKOVENKO, V. S., GERMANOVA, V. S., FROLOV, A. V., &
GRISHANOVA, S. V. (2017). Evaluation of the Company's financial condition from the
position of different groups of stakeholders. Revista ESPACIOS, 38(33).
Purnomo, A. (2018). Influence of The Ratio of Profit Margin, Financial Leverage Ratio, Current
Ratio, Quick Ratio Against The Conditions and Financial Distress. Indonesian Journal of
Business, Accounting and Management, 1(1)
Shrotriya, V. (2018). Analysis of Liquidity Management of Dabur India Limited through Liquidity
Ratios.
Small, R., Dollie, Z., & Yasseen, Y. (2019). Independent review–understanding ratio
analysis. Professional Accountant, 2019(35), 12-13.
Tissen, M., & Sneidere, R. (2017). THE MODIFICATION OF LIQUIDITY RATIO FOR THE
COMPANY'S SOLVENCY ASSESSMENT. New Challenges of Economic and Business
Development–2017 Digital Economy, 660.
Xu, X., (2019). Assessment of Profitability of the Company BMW AG.
Bibliography
Mkhondo, R. S., & Pretorius, M. (2017). Funding structures in business reorganisations:
Locating the role of pre-packaging as a restructuring tool. Journal of Contemporary
Management, 14(1), 831-863.
Priyar, M. R. J., Sowmya, S., & Pavithra, M. (2020). Financial Performance Of Infosys And TCS
Using Liquidity Ratios A Comparative Analysis. Our Heritage, 68(44), 402-408.

11FINANCIAL HEALTH OF PEPSI CO.
Rashid, C. A. (2018). Efficiency of Financial Ratios Analysis for Evaluating Companies'
Liquidity. International Journal of Social Sciences & Educational Studies, 4(4), 110-123.
Sakinç, M. E. (2016). Innovation or Financialization?: The Evoloution of the Systems-Integration
Buisness Model at Airbus and Boeing (Doctoral dissertation, Bordeaux).
⊘ This is a preview!⊘
Do you want full access?
Subscribe today to unlock all pages.
Trusted by 1+ million students worldwide
1 out of 15
Related Documents


Your All-in-One AI-Powered Toolkit for Academic Success.
+13062052269
info@desklib.com
Available 24*7 on WhatsApp / Email
![[object Object]](/_next/static/media/star-bottom.7253800d.svg)
Unlock your academic potential
Copyright © 2020–2026 A2Z Services. All Rights Reserved. Developed and managed by ZUCOL.