Coca Cola Company and PepsiCo Inc.
Added on 2023-03-31
8 Pages1462 Words322 Views
Surname 1
Coca Cola Company and PepsiCo Inc.
Student’s Name
Course Title
Instructor
State
Date
Coca Cola Company and PepsiCo Inc.
Student’s Name
Course Title
Instructor
State
Date
Surname 2
Introduction
The Coca-Cola Company was established in 1886 and founded in 1919 with its
headquarters in Atlanta, Georgia, USA. Coca-Cola is an American beverage corporation and
a multinational producer, marketer, and retailer of soft and non-alcoholic drinks. Mostly, the
company operates as a franchise where it produces the syrup and other companies bottle it
and sell it across the world. Some of Coca-Cola Company’s products include Fanta, Coke,
Dasani, Minute Maid, Coca-Cola Life, and Diet Coke among others. Coca-Cola Company is
listed in NYSE with its symbol being KO.
On the other hand, Pepsi which is commonly referred to as PepsiCo Inc. was founded
in 1965 with its headquarters in Purchase, New York, after a merger between Pepsi-Cola and
Frito-Lay Inc. which widened its product portfolio. It is among the leading soft drink and fast
food producer in the world. Some of PepsiCo Inc.’s products include Tropicana, Quaker Oats
and Pepsi. PepsiCo Inc. is Coca-Cola’s largest competitor and is listed on NYSE with its
symbol being PEP.
Ratio Analysis
Liquidity Ratios
Liquidity refers to how easily a company can convert its assets into cash to enable it
pay its bills.1 In other words it determines the ability of a firm for meet its short-term debt
obligations. Mostly, it is expressed as a percentage of liabilities as current or liquidity ratio. It
helps short-term creditors to establish how soon a firm will clear their debts. In general terms,
if a company has a higher current or liquidity ratio, it is in a better position of clearing its
short-term liabilities.
1 Vintilă, Georgeta, and Elena Alexandra Nenu. "Liquidity and profitability analysis on the Romanian
listed companies."
Surname 3
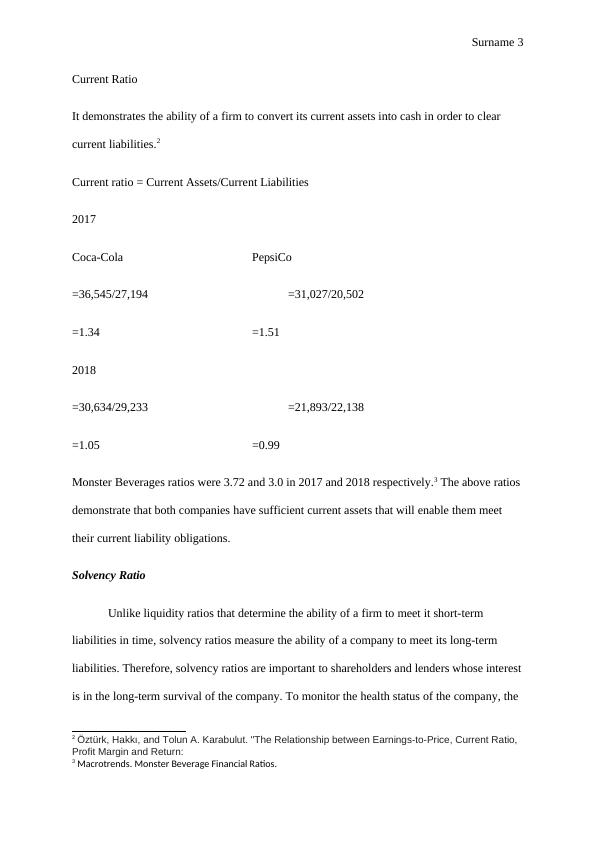
Current Ratio
It demonstrates the ability of a firm to convert its current assets into cash in order to clear
current liabilities.2
Current ratio = Current Assets/Current Liabilities
2017
Coca-Cola PepsiCo
=36,545/27,194 =31,027/20,502
=1.34 =1.51
2018
=30,634/29,233 =21,893/22,138
=1.05 =0.99
Monster Beverages ratios were 3.72 and 3.0 in 2017 and 2018 respectively.3 The above ratios
demonstrate that both companies have sufficient current assets that will enable them meet
their current liability obligations.
Solvency Ratio
Unlike liquidity ratios that determine the ability of a firm to meet it short-term
liabilities in time, solvency ratios measure the ability of a company to meet its long-term
liabilities. Therefore, solvency ratios are important to shareholders and lenders whose interest
is in the long-term survival of the company. To monitor the health status of the company, the
2 Öztürk, Hakkı, and Tolun A. Karabulut. "The Relationship between Earnings-to-Price, Current Ratio,
Profit Margin and Return:
3 Macrotrends. Monster Beverage Financial Ratios.
End of preview
Want to access all the pages? Upload your documents or become a member.
Related Documents
Finance Definition & Meaninglg...
|21
|3423
|17
Company Overview on PepsiCo PDFlg...
|3
|746
|142
Financial Management In Coca Colalg...
|12
|2895
|1704
Importance of Auditing and Accountinglg...
|7
|1320
|30
Financial and Economical Interpretation of Coca Cola Amatil Limitedlg...
|3
|1290
|341
Project Report: Business Financelg...
|19
|4058
|83