Financial Management Analysis of Vodafone Inc.
VerifiedAdded on 2019/09/16
|16
|3165
|181
Report
AI Summary
The table shows an increasing trend in the share price of Vodafone Inc. except for 2015 when there was a decrease compared to 2014. The analysis is limited by factors such as lack of planning, qualitative aspect, time constraint, and ignoring future prospects. The report recommends measures to improve financial performance, including investing in current assets, increasing advertisement, providing internet-based phone services, focusing on brand development, and forming a special committee to address losses.
Contribute Materials
Your contribution can guide someone’s learning journey. Share your
documents today.

FINANCIAL MANAGEMENT ANALYSIS
1
1
Secure Best Marks with AI Grader
Need help grading? Try our AI Grader for instant feedback on your assignments.

Contents
Introduction......................................................................................................................................3
Financial Performance Analysis......................................................................................................4
Liquidity analysis.........................................................................................................................5
Profitability analysis....................................................................................................................7
Efficiency analysis.......................................................................................................................9
Capital structure.........................................................................................................................10
Stock market performance.........................................................................................................11
Limitation of analysis....................................................................................................................13
Recommendations..........................................................................................................................15
Conclusion.....................................................................................................................................16
References......................................................................................................................................17
2

Introduction
Financial management analysis can be referred to as a process of analysing of financial
performance of an organisation. Main objective of such analysis is to determine the financial
health and future prospective of an organisation. Financial management analysis is an important
business tool as it helps management of an organisation in strategy development. It also helps
stakeholders such as shareholders, government, creditors, lenders etc. to evaluate their
investment in the organisation (Brighamand Ehrhardt, 2013). There are various techniques which
can be used for financial management analysis such as vertical analysis, horizontal analysis, ratio
analysis, etc. Financial statements of an organisation play a very important role in this process as
this analysis is done on the basis of financial statement prepared by the organisation. All the
above mentioned techniques of financial management analysis are based on financial statements
(Van Horneand Wachowicz, 2008). In this report we will try to understand different aspects of
financial management analysis with the help of financial analysis of Vodafone Plc. Vodafone
Plc. is an British multinational telecommunication company with subsidiaries in Asia, Africa and
Europe. As of 2016, Vodafone is eight largest company listed on UK stock exchange with a
market capital of approximately £52.5 billion. Vodafone owns network in around 26 countries
and has partnership networks in more than 50 countries. Hence it could be said that Vodafone of
among one of the largest telecommunication companies in the world. In this report we will
analyse financial statement of the company of last 3 years to determine its financial health and
future prospective.
3

Financial Performance Analysis
In this part of the report we will try to analyse the financial performance the company over the
last five years. For proper and efficient evaluation this category has been divided into five sub
parts i.e. Liquidity, profitability, efficiency, capital structure and stock market performance. All
the data for the calculation has been taken from the annual reports published by the company at
the end of the financial year (Healyand Palepu, 2012.).
Relevant financial data-
Financial data on which majority of ratio analysis is based on is as follows-
Particular 2016 2015 2014
Revenue 40,973.00 42,227.00 38,346.00
Gross profit 10,538.00 11,345.00 10,404.00
PBT -449.00 1,095.00 -5,270.00
PAT -3,818.00 5,917.00 59,420.00
EPS
-basic -15.08 21.53 42.10
-diluted -15.08 21.42 41.77
Non-current assets 1,05,569.00 1,02,726.00 97,118.00
Goodwill 22,789.00 22,573.00 23,315.00
Other intangible assets 23,979.00 20,953.00 23,373.00
Current assets 28,144.00 19,847.00 24,722.00
4
Paraphrase This Document
Need a fresh take? Get an instant paraphrase of this document with our AI Paraphraser

Inventory 565.00 482.00 41.00
Equity 67,317.00 67,733.00 71,781.00
Non-current liabilities 33,001.00 25,943.00 25,020.00
Current liabilities 33,395.00 28,897.00 25,039.00
Liquidity analysis
Liquidity of a company is based on its ability to convert its assets into cash without affecting the
market price of such assets. It can also be said that liquidity of a company refers to its ability to
meet its short term obligations. These short term obligations affects the operating cycle of an
organisation i.e. purchasing, manufacturing, selling and collection of debt. In this part of the
report we will analyse liquidity position of the company with the help of ratio analysisGoodhart,
2008). Following are some of the ratios which will be helpful in such evaluation-
Current ratio-
This ratio is also known as working capital ratio. This ratio determines the company’s ability to
pay off its short term and long term liabilities. As per market experts, ideal current ratio is 2:1
which shows that company has double the amount in current assets to pay off its current
liabilities. But this ratio may change industry to industry (Reimers,2014). If ratio is less than 1
than it shows that company does not have sufficient assets to pay its liability hence its liquidity
position is not sound.
Formula- Current ratio = Current Assets / Current Liabilities
Current ratio for –
5

2014- 0.99
2015- 0.67
2016- 0.85
We can say that company does not have sufficient current assets to cover its current liabilities.
The current ratio has been decreased substantially from .99 in 2014 to .67 in 2015 but there is a
rise in 2016 in current ratio. Company should try to maintain it around 1.5.
Quick ratio
Current ratio represents company’s ability to meetlong tern as well as short term liabilities
whereas quick ratio represents company’s ability to meet its short term liability. For calculation
of liquid assets, inventory and prepaid assets are deducted from current assets (Michalski and
Mercik, 2011). Ideally company should have a quick ratio of 1:1, but it may change as per
industry standards.
Formula- Quick ratio= Quick assets/Current Liabilities
2014- 0.81
2015- 0.56
2016- 0.63
Company’s quick ratio is also not as per industry standard. Company should invest more in
highly liquid assets such as certificated of deposits, stocks, mutual funds, etc.
6

Profitability analysis
Most appropriate method of evaluating financial health of a company is by evaluating its
profitability. Profitability of an organisation represents its ability to generate revenues with the
help of available assets. We will analyse company’s profitability over past three years with the
help of profitability ratios (Boohene&Agyapong, 2010). For such analyses we will compare
revenue generated by the company with its profits, assets, capital employed etc.
Net profit ratio
This ratio helps is determining the relationship between net profit and revenue generated by an
organisation. Main objective of this ratio is to determine the financial viability of company to
pay dividend to shareholders and retain certain amount of profit for business growth. While
calculating net profits, tax paid by company should also be deducted (Deegan, 2013).
Formulae- Net profit ratio = Net profit after taxation / Net revenue * 100
2014- 154.51%
2015- 13.64%
2016- -9.82%
In the year 2016, the net profit ratio has decreased from 13.64 in 2015 to -9.82% in current year.
This is due to the heavy loss incurred by company in 2016. Company should evaluate the reason
for such loss and cut back its indirect expense to increase net profit.
Return on asset ratio
7
Secure Best Marks with AI Grader
Need help grading? Try our AI Grader for instant feedback on your assignments.
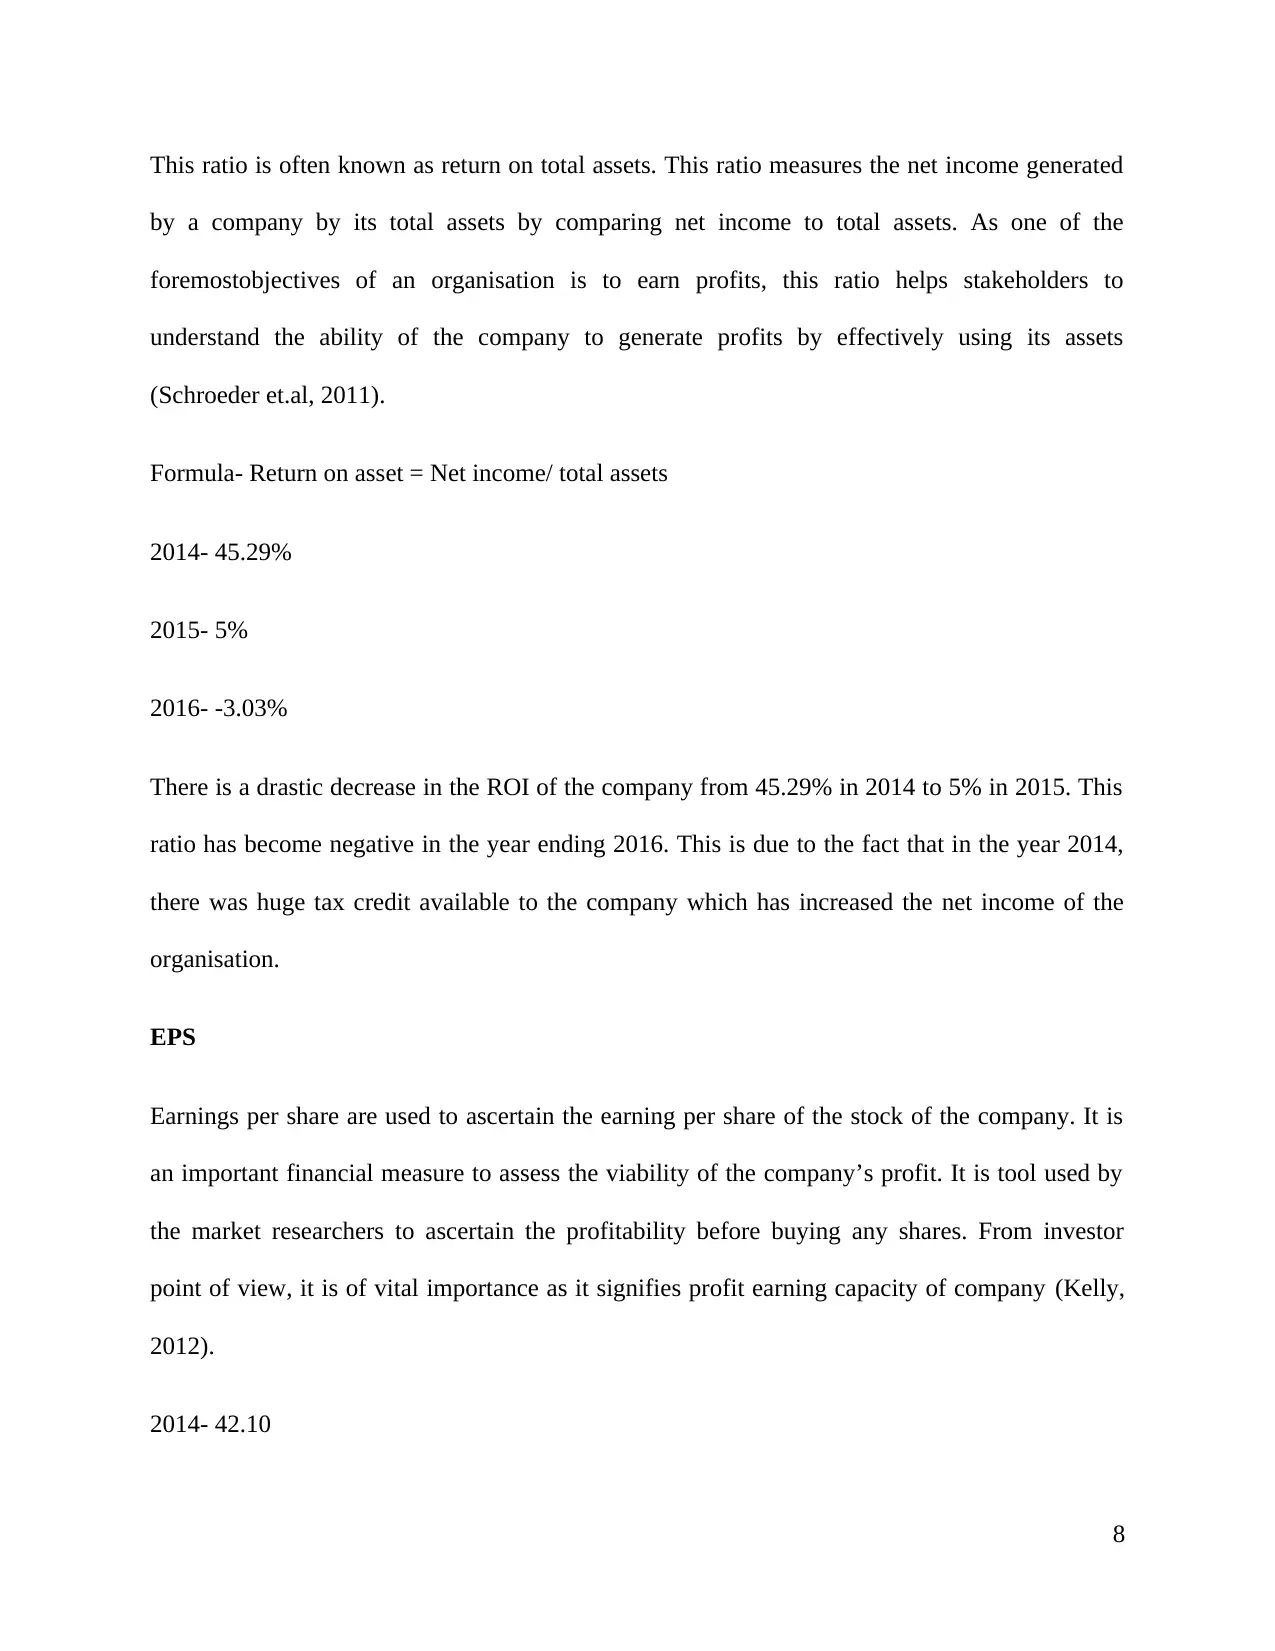
This ratio is often known as return on total assets. This ratio measures the net income generated
by a company by its total assets by comparing net income to total assets. As one of the
foremostobjectives of an organisation is to earn profits, this ratio helps stakeholders to
understand the ability of the company to generate profits by effectively using its assets
(Schroeder et.al, 2011).
Formula- Return on asset = Net income/ total assets
2014- 45.29%
2015- 5%
2016- -3.03%
There is a drastic decrease in the ROI of the company from 45.29% in 2014 to 5% in 2015. This
ratio has become negative in the year ending 2016. This is due to the fact that in the year 2014,
there was huge tax credit available to the company which has increased the net income of the
organisation.
EPS
Earnings per share are used to ascertain the earning per share of the stock of the company. It is
an important financial measure to assess the viability of the company’s profit. It is tool used by
the market researchers to ascertain the profitability before buying any shares. From investor
point of view, it is of vital importance as it signifies profit earning capacity of company (Kelly,
2012).
2014- 42.10
8

2015- 21.53
2016- -15.08
Over the period of three years EPS of the company has decreased from 42.10 in 2014 to -15.08
in 2016. This decrease might affect the market standing of the company.
Efficiency analysis
Funds are invested by stakeholders in the company with an objective of getting returns in form of
profits. Efficiency ratios measure the ability of the company to convert the available resources
such as debtors, inventory etc. into profits. We will analyse efficiency of company with the help
of inventory turnover ratio and receivable turnover ratio (Karimzadeh, 2012).
Receivable turnover ratio
This ratio shows the efficiency of the company to collect money from its creditors. It shows the
efficiency of company’s collection management. If company does not have an efficient
collection management system then there will be loss of interest as the money to be collected is
in form of interest free loan given to creditor (Sinha, 2012).
Formula- Net credit sales/ Average account receivables
2014- 10.17
2015- 11.80
2016- 9.46
9

This ratio has decreased from 11.80 in 2015 to 9.46 in 2016. This shows that company has
lenient policies for collection and credit period allowed to creditors is also higher as compared to
previous year.
Inventory turnover ratio
Inventory turnover ratio represents how many times an organisation has sold its inventory and
new inventory is purchased in a given year. It shows quantity of production and sales activities in
organisation. This ratio is dependent upon two functions of organisation i.e. stock purchasing
and sales of organisation (Taylor, 2012). Lower ITR can result in increased Stock holding cost
and storage cost.
2014- 63.37
2015- 70.80
2016- 56.11
This ratio shows that company is able to sell off its entire stock 56 times in 2016. That means
company has good brand value and it is popular among customers.
Capital structure
Capital structure of an organisation refers to the types of ownership involved in an organisation.
Capital structure of an organisation can be categorised into two major types i.e. equity and debt.
It is very important for any organisation to maintain a right balance between equity funds and
debt funds in an organisation. If the share of equity funds is in excess than ownership of the
company will be highly diluted and decision making process can become very difficult. On the
10
Paraphrase This Document
Need a fresh take? Get an instant paraphrase of this document with our AI Paraphraser

other hand if debt content in capital structure is in excess than company had to pay a large
amount in form of fixed interest (Shubitaand Alsawalhah, 2012).
In case of Vodafone Inc. around 60% of the company’s total capital represents equity holding
whereas 40% is debt holding. This equity ownership is held by investors through institutions and
mutual funds. As per the annual report of the organisation, major shareholders of the origination
are Black Rock Investment Management Ltd. and Legal & General Investment Management Ltd.
These two hold approximately 13.46% of total ordinary share capital of the company.It can be
said that there is an appropriate balance in capital structure of the company. It will help company
is efficient and effective management.
Stock market performance
Ordinary shares of the Vodafone Inc. are traded on London stock exchange and in the form of
ADSs on NASDAQ. ADS’s is a set of shares representing 10orrdinary shares of company. These
ADS holders are not considered as owners of the company but can exercise their voting right in
accordance with number of ordinary shares acquired by them.As on 31 March 2016, the closing
share price of the company was 221.20 pence and as on 31 March 2015 this closing price was
220.45 pence. With the help of following table we can analyse the high and low middle market
quotations of the company during the given financial years.
Year
London Stock Exchange (Pounds per
ordinary share)
NASDAQ(Dollars per ADS)
2012 1.84 1.54 29.46 24.31
2013 1.92 1.54 30.07 24.42
2014 2.52 1.8 41.57 27.74
2015 2.4 1.85 38.26 29.67
11

2015 2.55 2 39.21 29.19
We can see in the above table that there is an increasing trend in both the stock exchanges in
share price of the company except in case of 2015. Share prices in both stock exchanges have
decreased in 2015 as compared to 2014.
Limitation of analysis
Limitations are the factors which can affect the intended objective of a research analysis. As any
topic can have wide aspects, it is inherent that there will be some limitations of any research.
Main objective of researcher should be to decrease such limitation to a tolerable levelMackeyand
Gass, 2015). In this part of the report we have discussed various limitations of the research
conducted by us on financial management analysis of Vodafone Inc. some of these research
limitations are as follows-
1. Lack of planning
All the above discussed financial management analysis is based on the financial statement of
Vodafone Inc. Since all the data collected in financial statements are based on historical data,
such information may not be effective in management planning process.
2. Lack of qualitative aspect
Majority of the report represent the quantitative aspect and qualitative aspect of business has
been ignored. This may lead to wrong judgement by the user of the research.
3. Limited period of time
12
Time available for conducting the above research was limited. Financial management analysis
has various aspects which cannot be explored by us due to lack of time.
4. Future prospects
While preparation of report main focus has been given on the past and present evaluation of the
company but no importance has been given to future prospects of company.
5. Period of analysis
For proper evaluation financial statements of past 10 years should have been considered but due
to lack of time only 3 years had been taken.
13
Secure Best Marks with AI Grader
Need help grading? Try our AI Grader for instant feedback on your assignments.

Recommendations
We have already evaluated with the help of financial statement analyses that there are a lot of
scope for improvement for Vodafone Inc. In this part of the report we will discuss some of the
measures with the help of which organisation can improve its financial performance-
1. We have evaluated that long term liquidity position of company is not as per the norms of
telecommunication industry. Company should invest more in current assets such as
inventory, marketable securities, fixed deposits, bonds, mutual funds etc.
2. The level of advertisement done by Vodafone Inc. is also very low as compared to other
competitors in market. Being fourth largest telecommunication company in the world, it
should invest more on advertisement policy. It should consider modern advertisement
measures such as promotion through YouTube, social media etc.
3. Company should provide internet based phone service in rural areas of Africa and Asia at
lower cost to increase its customer base. This will also contribute to companies marketing
strategy in these countries which will help in increasing overall sales of the company.
4. Company should focus on developing its brand name by helping in social cases. This will
also allow company to take advantage of tax rebates in various counties. It can also help
company towards in corporate social responsibility.
5. In the year 2016, company has incurred losses as compared to in year 2014 and 2015.
Vodafone should form a special committee to evaluate the reason of such losses and provide
measures to recover in 2017.
14

Conclusion
We can conclude that with the help of this report we are able to understand various aspects of
financial management analysis. We can say that by adopting financial management analysis in
business an organisation can bring various positive changes in its daily as well as long term
operation. For above research we have collected and analysed financial data of Vodafone Inc.
for the past three years. This data had helped us to understand working of a business organisation
and how financial management can be used by these organisations for improvement. We have
also discussed the various limitations of the report and there will be considered while preparation
of business report in future.On the basis of our evaluation of Vodafone Inc. we have also
recommended various measures. By following these measure can bring some positive changes in
the recent decrease in the financial performance of the company.
15

References
Boohene, R. and Agyapong, G.K., 2010. Analysis of the antecedents of customer loyalty of
telecommunication industry in Ghana: The case of Vodafone (Ghana). International Business
Research, 4(1), p.229.
Brigham, E.F. and Ehrhardt, M.C., 2013. Financial management: Theory & practice. Cengage
Learning.
Deegan, C., 2013. Financial accounting theory. McGraw-Hill Education Australia.
Goodhart, C., 2008. Liquidity risk management. Banque de France Financial Stability
Review, 11, pp.39-44.
Healy, P.M. and Palepu, K.G., 2012. Business analysis valuation: Using financial statements.
Cengage Learning.
Karimzadeh, M., 2012. Efficiency analysis by using Data Envelop Analysis model: evidence
from Indian banks. International Journal of Latest Trends in Finance and Economic
Sciences, 2(3), pp.228-237.
Kelly, P., 2012. Vodafone PLC. Business Ethics.
Mackey, A. and Gass, S.M., 2015. Second language research: Methodology and design.
Routledge.
Michalski, G. and Mercik, A., 2011. Liquid assets strategies in Silesian non-profit
organizations. Financial Management of Firms and Financial Institutions, 2011, pp.258-270.
16
1 out of 16
Related Documents


Your All-in-One AI-Powered Toolkit for Academic Success.
+13062052269
info@desklib.com
Available 24*7 on WhatsApp / Email
![[object Object]](/_next/static/media/star-bottom.7253800d.svg)
Unlock your academic potential
© 2024 | Zucol Services PVT LTD | All rights reserved.