Financial Management and Analysis
VerifiedAdded on 2022/12/26
|17
|3683
|1
AI Summary
This document provides a detailed analysis of the financial condition and health of Tesco plc. It includes ratio analysis, liquidity ratio, profitability ratio, and recommendations for improving the company's financial position.
Contribute Materials
Your contribution can guide someone’s learning journey. Share your
documents today.

FINANCIAL MANAGEMENT AND ANALYSIS
Secure Best Marks with AI Grader
Need help grading? Try our AI Grader for instant feedback on your assignments.
Contents
INTRODUCTION...........................................................................................................................3
MAIN BODY..................................................................................................................................3
Task 1...........................................................................................................................................3
Task 2...........................................................................................................................................7
Task 3.........................................................................................................................................10
Task 4.........................................................................................................................................11
Task 5.........................................................................................................................................13
REFERENCES..............................................................................................................................17
INTRODUCTION
Financial governance is one of the most relevant and necessary aspects for any company as it
supports the corporation in the proper management and allocation of the most important finance
capital, so as to contribute to the long-term value of the business (Shapiro and Hanouna, 2019).
For the first task the report is based on a company which is Tesco plc located in UK and listed in
London stock exchange. The report contains detailed information about ratio analysis of
company and guidance to them as per the analysis in task one. While in rest of task, there is
different kinds of requirement like investment appraisal approaches, guidance to investors as per
the scenario and many more.
MAIN BODY
Task 1
1. Critically analysis of variations in financial condition and health during previous two years.
Financial performance analysis- For firms, this is necessary to carefully evaluate financial
factors to make the financial health of firms inside and outside stakeholders aware of different
aspects (Prihartono and Asandimitra, 2018). In order to evaluate the tax arrangements of
businesses, a number of factors have to be considered. As for Tesco plc, for two years, for
instance, those items are covered below:
Ratio analysis- The measurement of ratios is a quantitative approach of analysing its financial
statements, such as a balance sheet and a statement of sales, for an insight into liquidity,
operations performance and performance of a company. Ratio analyses are a central pillar of an
appraisal of equity (Yuniningsih, Pertiwi and Purwanto, 2019). The ratio study compares line
data from the accounting records to offer insights into performance, liquidity, operating efficacy
and solvency. Ratio analysis may indicate how a company performs over time and compare a
business in the same market or field with yet another company.
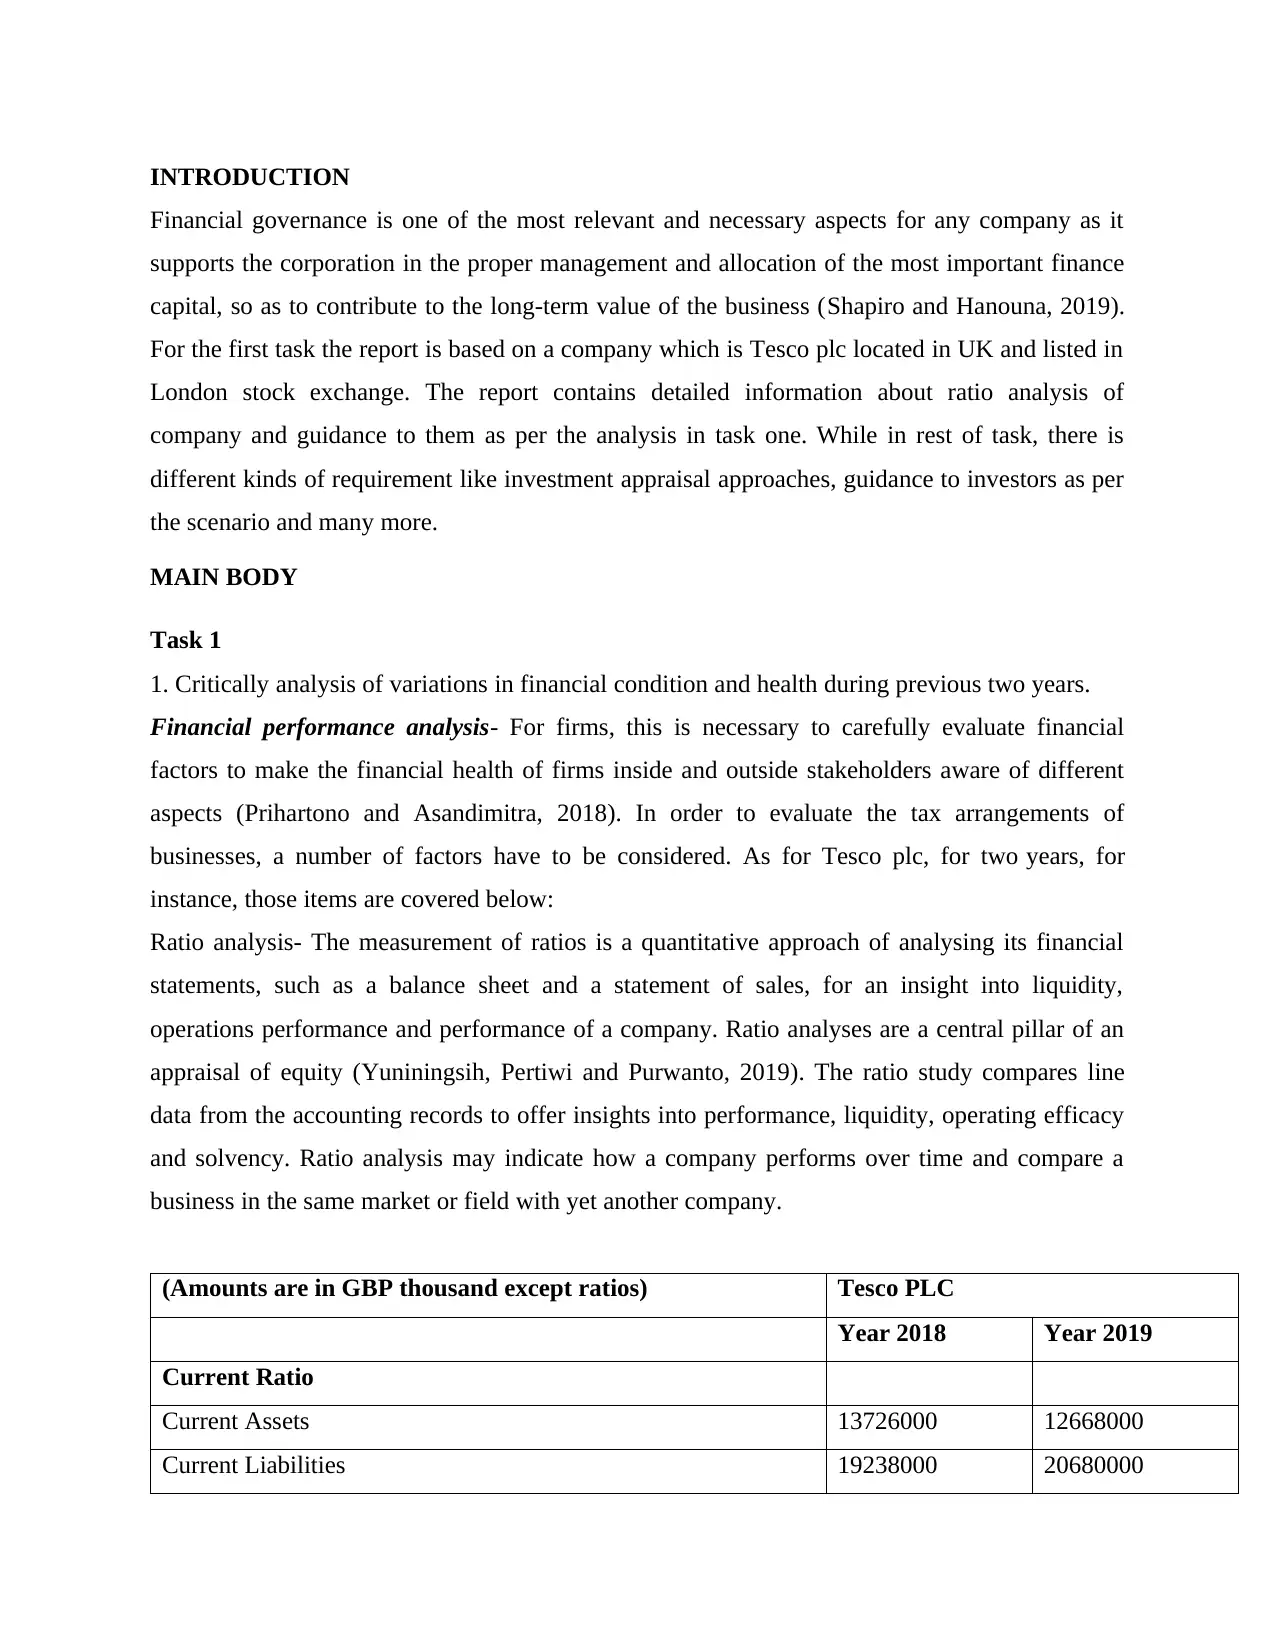
(Amounts are in GBP thousand except ratios) Tesco PLC
Year 2018 Year 2019
Current Ratio
Current Assets 13726000 12668000
Current Liabilities 19238000 20680000
Financial governance is one of the most relevant and necessary aspects for any company as it
supports the corporation in the proper management and allocation of the most important finance
capital, so as to contribute to the long-term value of the business (Shapiro and Hanouna, 2019).
For the first task the report is based on a company which is Tesco plc located in UK and listed in
London stock exchange. The report contains detailed information about ratio analysis of
company and guidance to them as per the analysis in task one. While in rest of task, there is
different kinds of requirement like investment appraisal approaches, guidance to investors as per
the scenario and many more.
MAIN BODY
Task 1
1. Critically analysis of variations in financial condition and health during previous two years.
Financial performance analysis- For firms, this is necessary to carefully evaluate financial
factors to make the financial health of firms inside and outside stakeholders aware of different
aspects (Prihartono and Asandimitra, 2018). In order to evaluate the tax arrangements of
businesses, a number of factors have to be considered. As for Tesco plc, for two years, for
instance, those items are covered below:
Ratio analysis- The measurement of ratios is a quantitative approach of analysing its financial
statements, such as a balance sheet and a statement of sales, for an insight into liquidity,
operations performance and performance of a company. Ratio analyses are a central pillar of an
appraisal of equity (Yuniningsih, Pertiwi and Purwanto, 2019). The ratio study compares line
data from the accounting records to offer insights into performance, liquidity, operating efficacy
and solvency. Ratio analysis may indicate how a company performs over time and compare a
business in the same market or field with yet another company.
(Amounts are in GBP thousand except ratios) Tesco PLC
Year 2018 Year 2019
Current Ratio
Current Assets 13726000 12668000
Current Liabilities 19238000 20680000
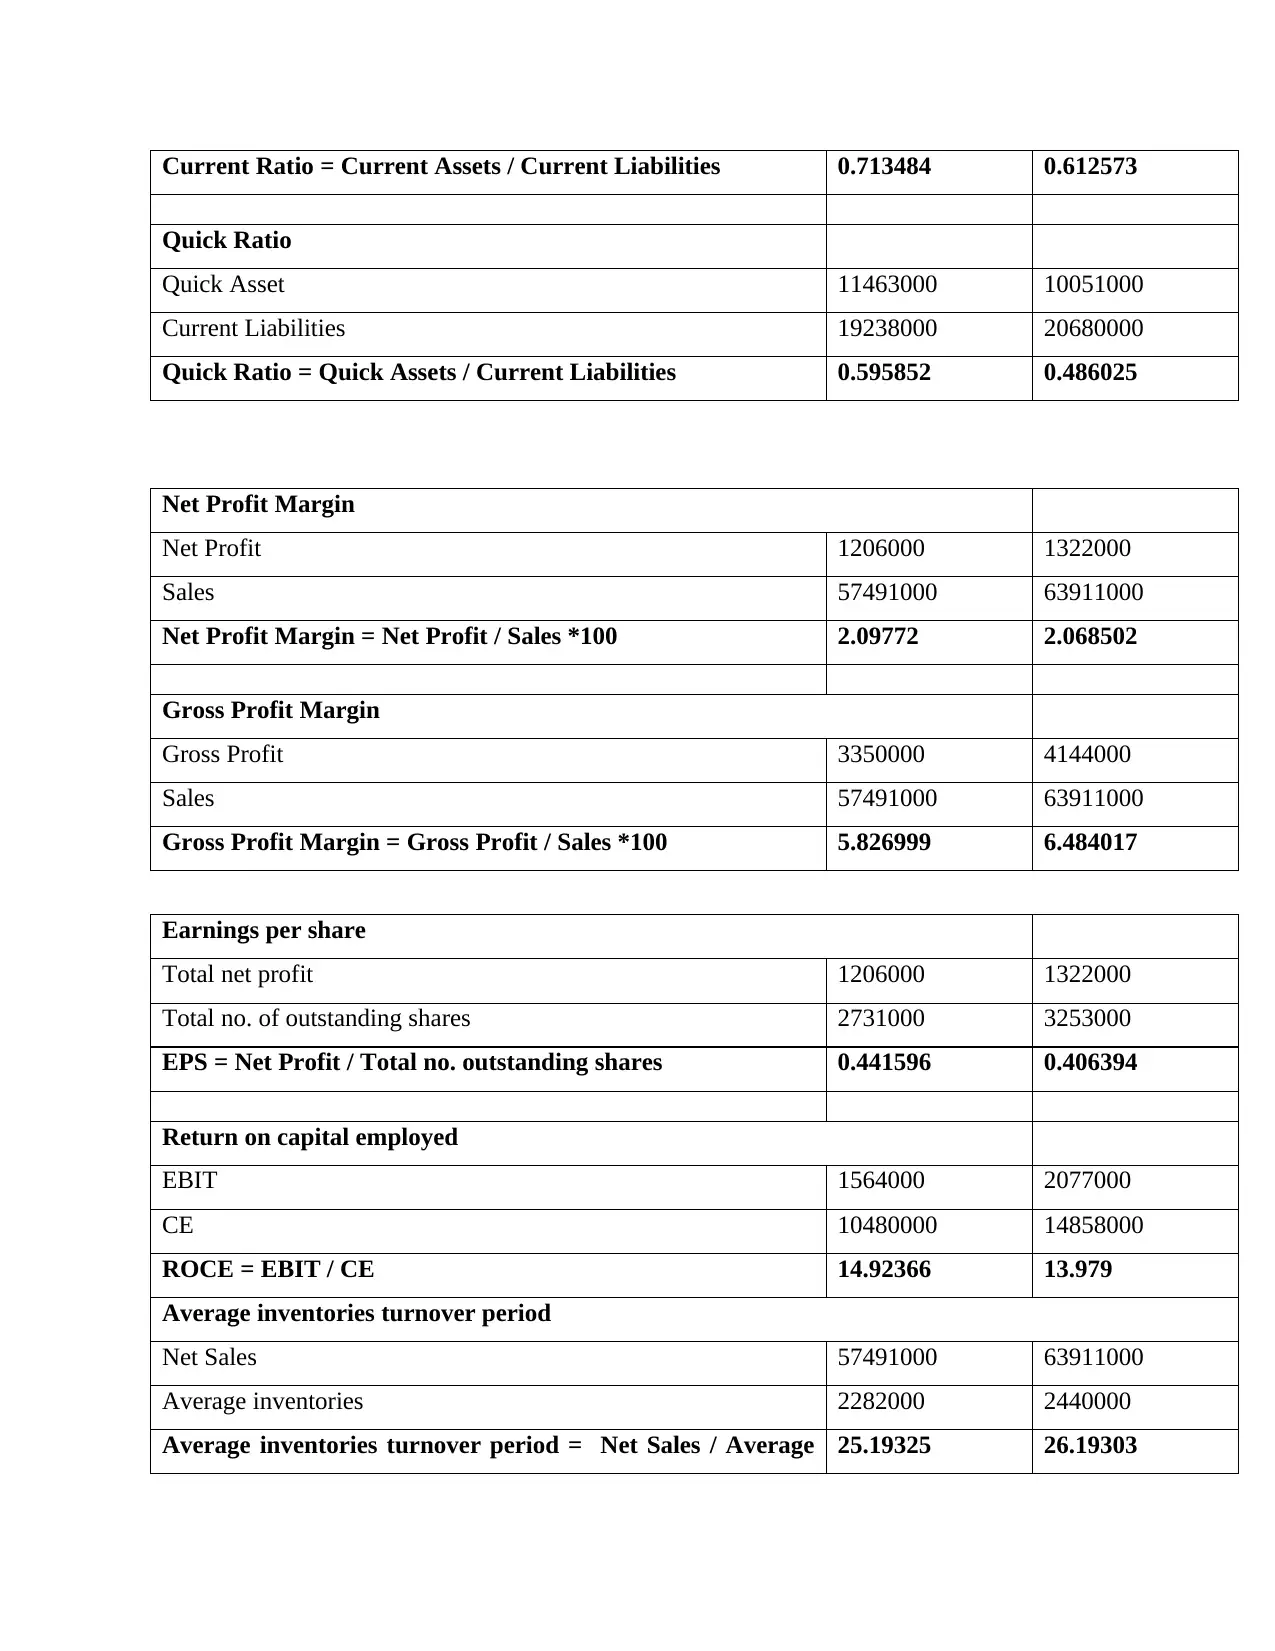
Current Ratio = Current Assets / Current Liabilities 0.713484 0.612573
Quick Ratio
Quick Asset 11463000 10051000
Current Liabilities 19238000 20680000
Quick Ratio = Quick Assets / Current Liabilities 0.595852 0.486025
Net Profit Margin
Net Profit 1206000 1322000
Sales 57491000 63911000
Net Profit Margin = Net Profit / Sales *100 2.09772 2.068502
Gross Profit Margin
Gross Profit 3350000 4144000
Sales 57491000 63911000
Gross Profit Margin = Gross Profit / Sales *100 5.826999 6.484017
Earnings per share
Total net profit 1206000 1322000
Total no. of outstanding shares 2731000 3253000
EPS = Net Profit / Total no. outstanding shares 0.441596 0.406394
Return on capital employed
EBIT 1564000 2077000
CE 10480000 14858000
ROCE = EBIT / CE 14.92366 13.979
Average inventories turnover period
Net Sales 57491000 63911000
Average inventories 2282000 2440000
Average inventories turnover period = Net Sales / Average 25.19325 26.19303
Secure Best Marks with AI Grader
Need help grading? Try our AI Grader for instant feedback on your assignments.
Inventory
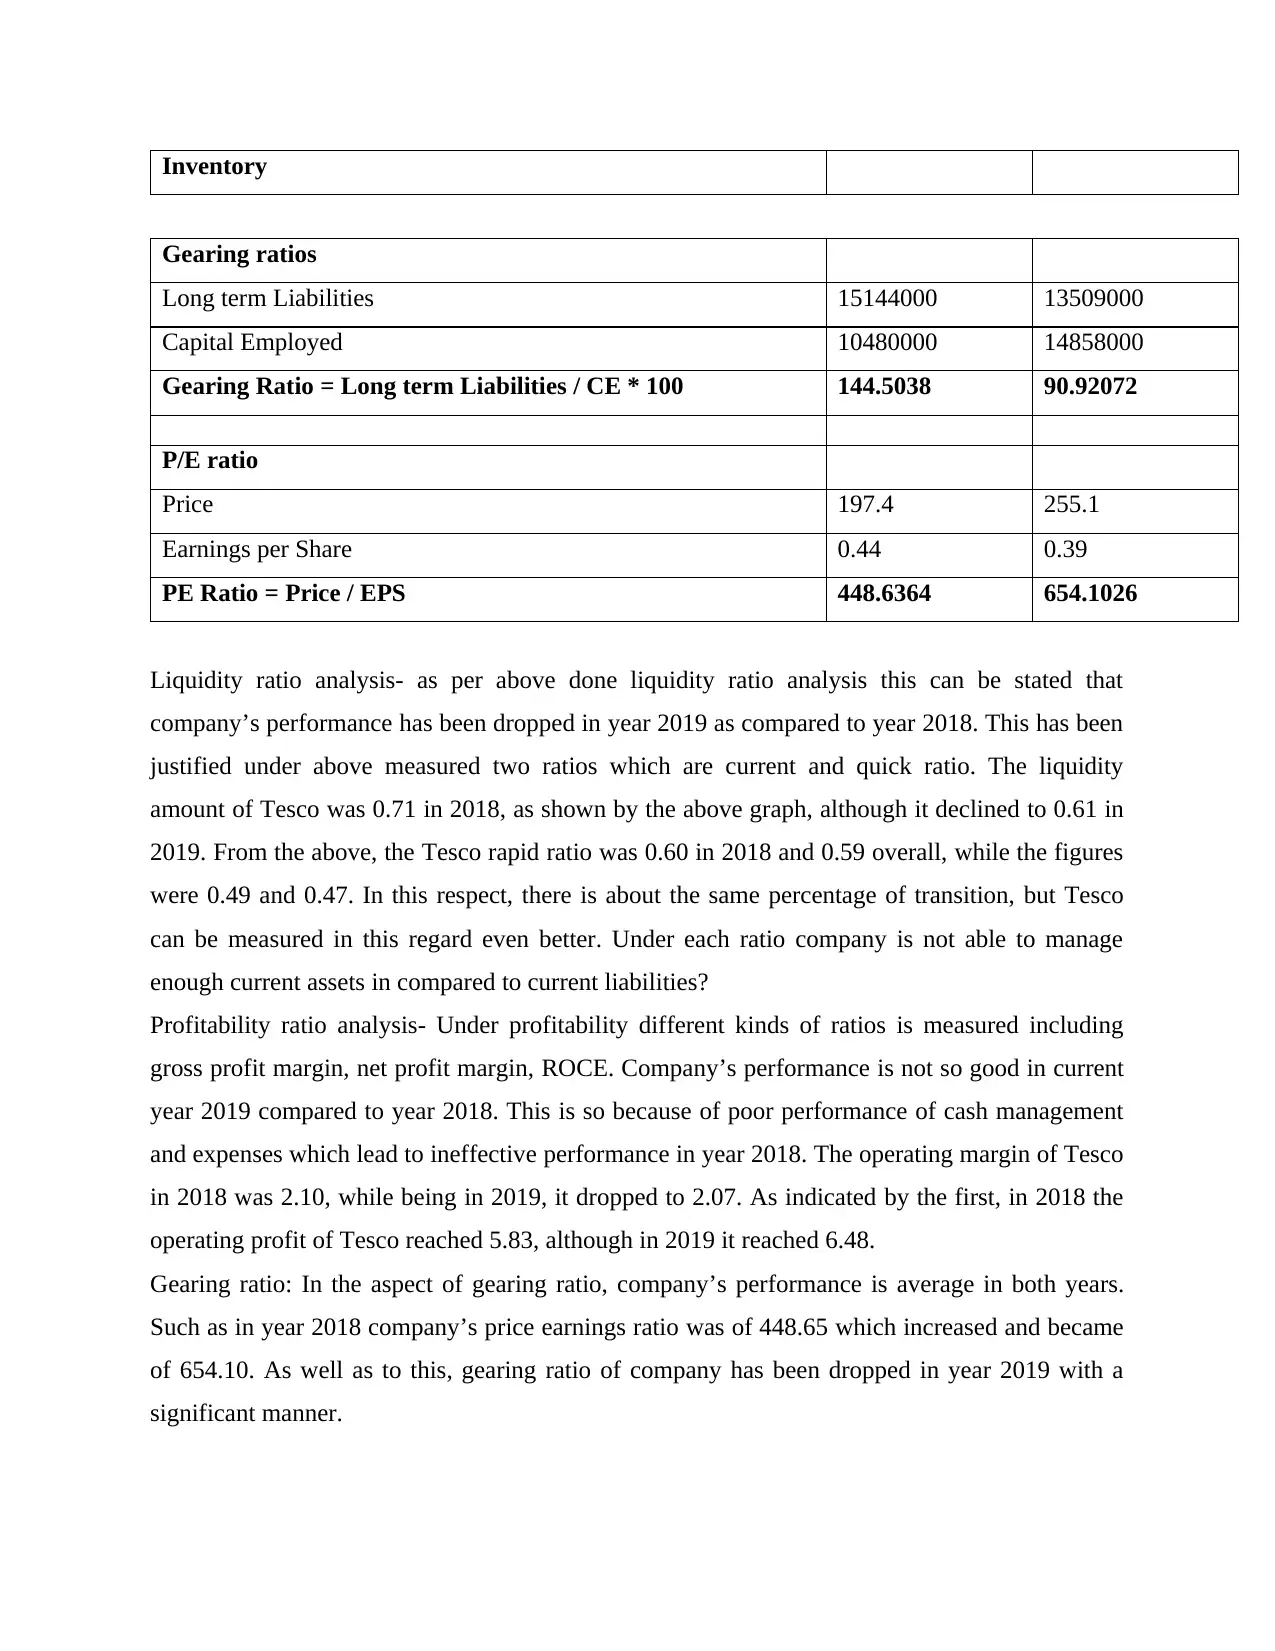
Gearing ratios
Long term Liabilities 15144000 13509000
Capital Employed 10480000 14858000
Gearing Ratio = Long term Liabilities / CE * 100 144.5038 90.92072
P/E ratio
Price 197.4 255.1
Earnings per Share 0.44 0.39
PE Ratio = Price / EPS 448.6364 654.1026
Liquidity ratio analysis- as per above done liquidity ratio analysis this can be stated that
company’s performance has been dropped in year 2019 as compared to year 2018. This has been
justified under above measured two ratios which are current and quick ratio. The liquidity
amount of Tesco was 0.71 in 2018, as shown by the above graph, although it declined to 0.61 in
2019. From the above, the Tesco rapid ratio was 0.60 in 2018 and 0.59 overall, while the figures
were 0.49 and 0.47. In this respect, there is about the same percentage of transition, but Tesco
can be measured in this regard even better. Under each ratio company is not able to manage
enough current assets in compared to current liabilities?
Profitability ratio analysis- Under profitability different kinds of ratios is measured including
gross profit margin, net profit margin, ROCE. Company’s performance is not so good in current
year 2019 compared to year 2018. This is so because of poor performance of cash management
and expenses which lead to ineffective performance in year 2018. The operating margin of Tesco
in 2018 was 2.10, while being in 2019, it dropped to 2.07. As indicated by the first, in 2018 the
operating profit of Tesco reached 5.83, although in 2019 it reached 6.48.
Gearing ratio: In the aspect of gearing ratio, company’s performance is average in both years.
Such as in year 2018 company’s price earnings ratio was of 448.65 which increased and became
of 654.10. As well as to this, gearing ratio of company has been dropped in year 2019 with a
significant manner.
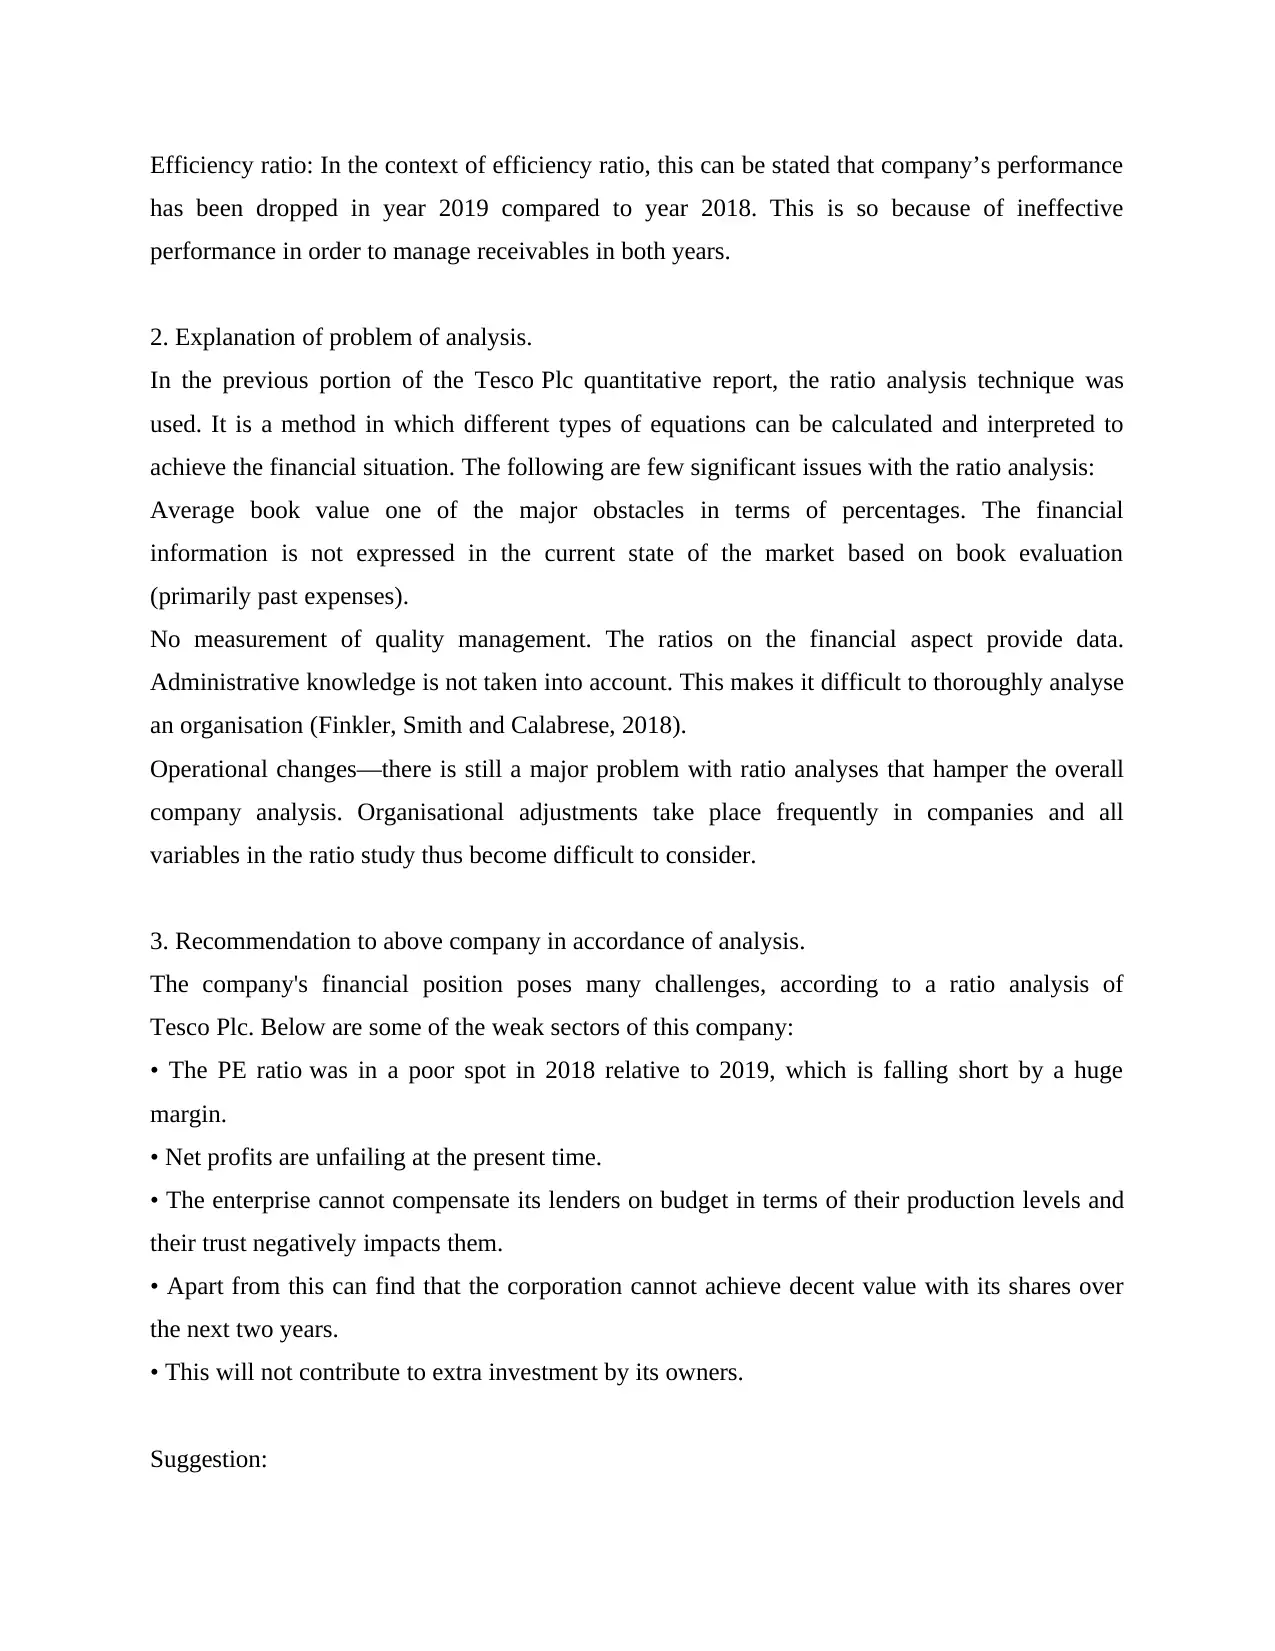
Efficiency ratio: In the context of efficiency ratio, this can be stated that company’s performance
has been dropped in year 2019 compared to year 2018. This is so because of ineffective
performance in order to manage receivables in both years.
2. Explanation of problem of analysis.
In the previous portion of the Tesco Plc quantitative report, the ratio analysis technique was
used. It is a method in which different types of equations can be calculated and interpreted to
achieve the financial situation. The following are few significant issues with the ratio analysis:
Average book value one of the major obstacles in terms of percentages. The financial
information is not expressed in the current state of the market based on book evaluation
(primarily past expenses).
No measurement of quality management. The ratios on the financial aspect provide data.
Administrative knowledge is not taken into account. This makes it difficult to thoroughly analyse
an organisation (Finkler, Smith and Calabrese, 2018).
Operational changes—there is still a major problem with ratio analyses that hamper the overall
company analysis. Organisational adjustments take place frequently in companies and all
variables in the ratio study thus become difficult to consider.
3. Recommendation to above company in accordance of analysis.
The company's financial position poses many challenges, according to a ratio analysis of
Tesco Plc. Below are some of the weak sectors of this company:
• The PE ratio was in a poor spot in 2018 relative to 2019, which is falling short by a huge
margin.
• Net profits are unfailing at the present time.
• The enterprise cannot compensate its lenders on budget in terms of their production levels and
their trust negatively impacts them.
• Apart from this can find that the corporation cannot achieve decent value with its shares over
the next two years.
• This will not contribute to extra investment by its owners.
Suggestion:
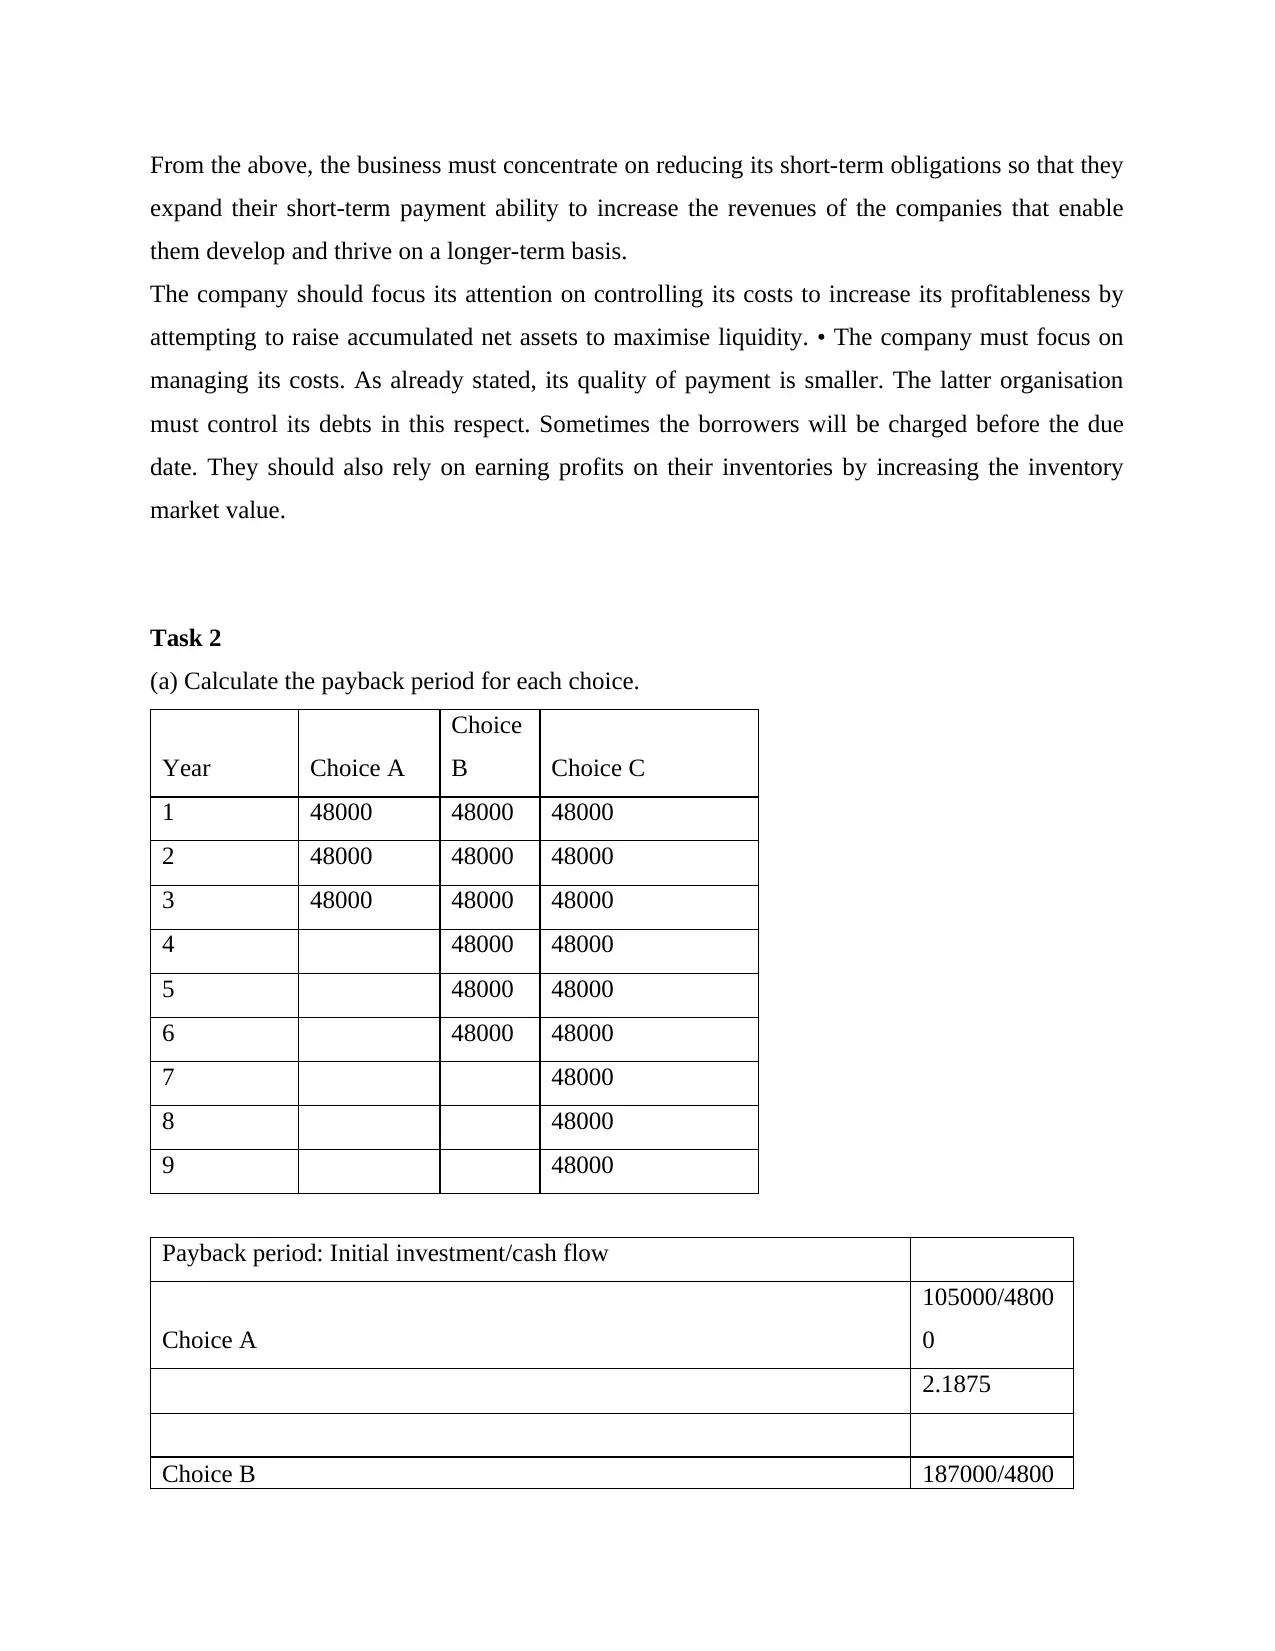
From the above, the business must concentrate on reducing its short-term obligations so that they
expand their short-term payment ability to increase the revenues of the companies that enable
them develop and thrive on a longer-term basis.
The company should focus its attention on controlling its costs to increase its profitableness by
attempting to raise accumulated net assets to maximise liquidity. • The company must focus on
managing its costs. As already stated, its quality of payment is smaller. The latter organisation
must control its debts in this respect. Sometimes the borrowers will be charged before the due
date. They should also rely on earning profits on their inventories by increasing the inventory
market value.
Task 2
(a) Calculate the payback period for each choice.
Year Choice A
Choice
B Choice C
1 48000 48000 48000
2 48000 48000 48000
3 48000 48000 48000
4 48000 48000
5 48000 48000
6 48000 48000
7 48000
8 48000
9 48000
Payback period: Initial investment/cash flow
Choice A
105000/4800
0
2.1875
Choice B 187000/4800
Paraphrase This Document
Need a fresh take? Get an instant paraphrase of this document with our AI Paraphraser
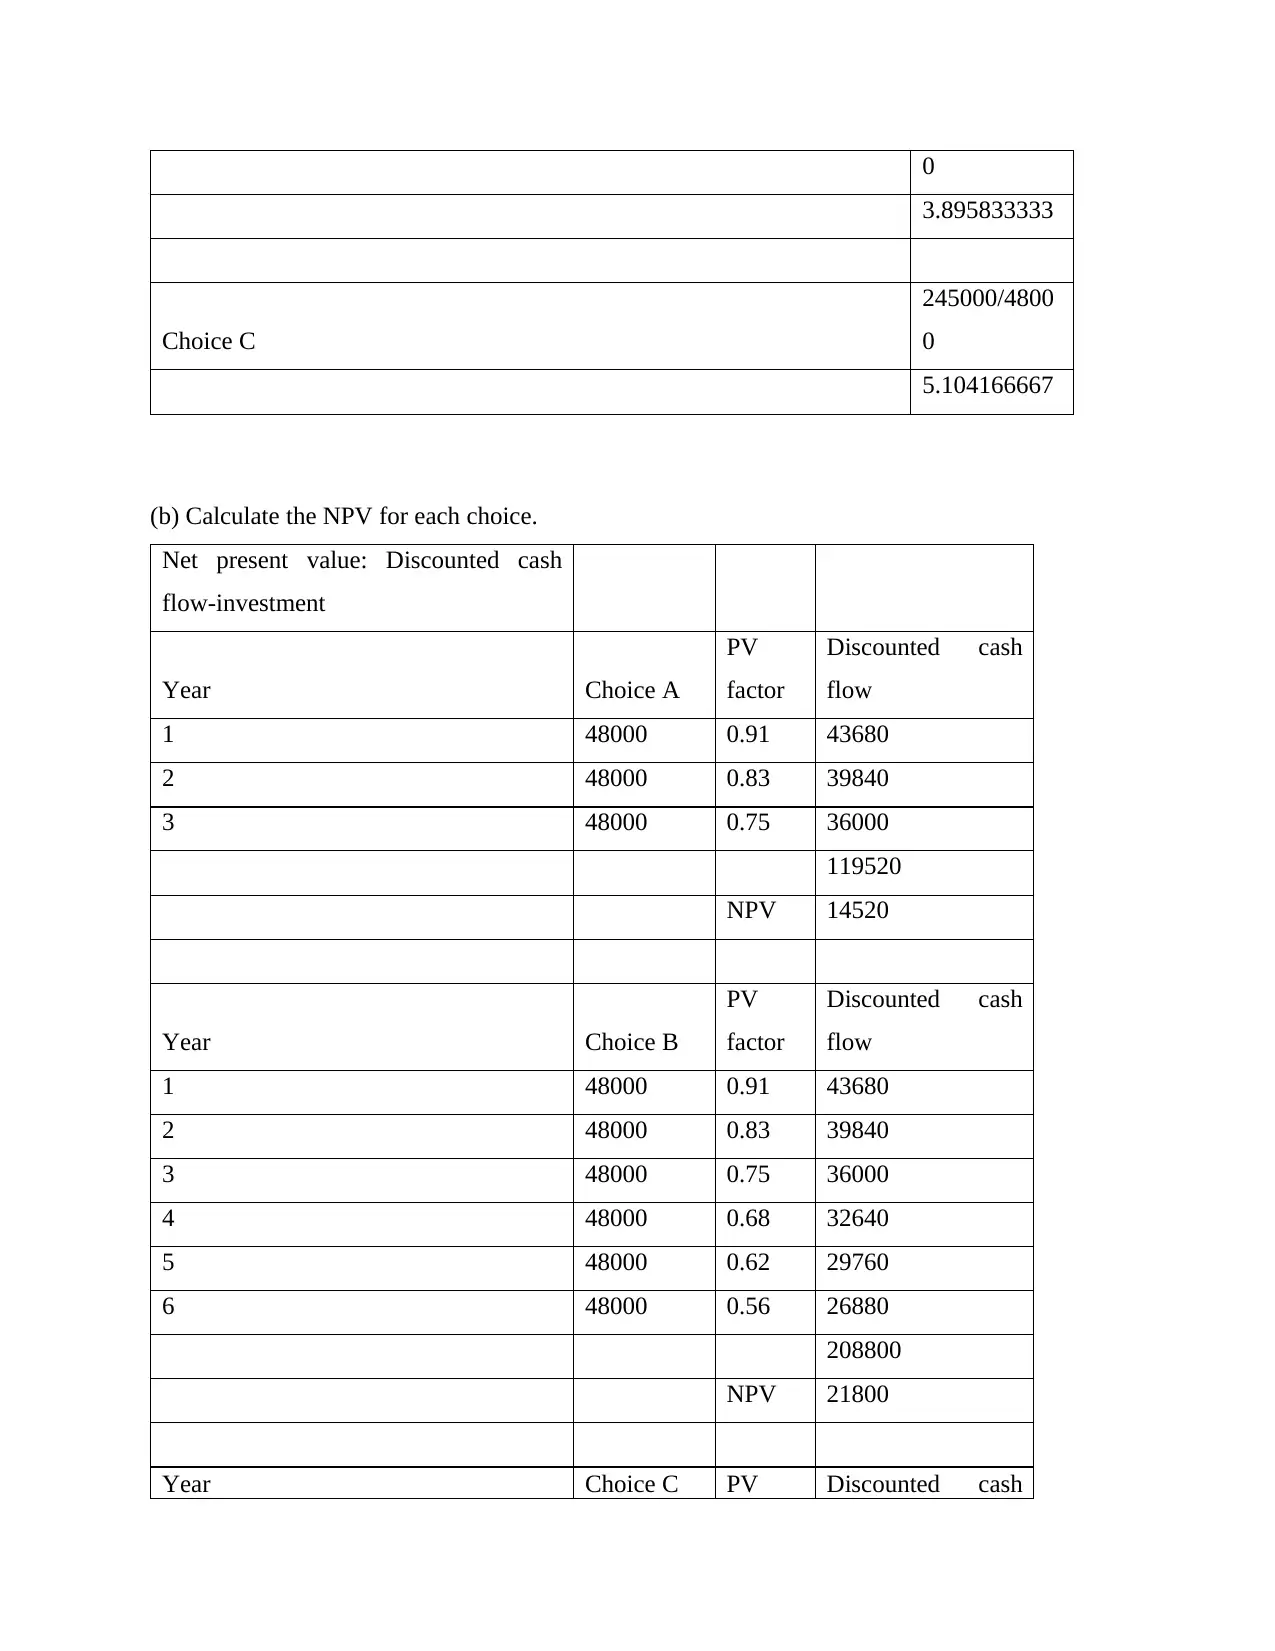
0
3.895833333
Choice C
245000/4800
0
5.104166667
(b) Calculate the NPV for each choice.
Net present value: Discounted cash
flow-investment
Year Choice A
PV
factor
Discounted cash
flow
1 48000 0.91 43680
2 48000 0.83 39840
3 48000 0.75 36000
119520
NPV 14520
Year Choice B
PV
factor
Discounted cash
flow
1 48000 0.91 43680
2 48000 0.83 39840
3 48000 0.75 36000
4 48000 0.68 32640
5 48000 0.62 29760
6 48000 0.56 26880
208800
NPV 21800
Year Choice C PV Discounted cash
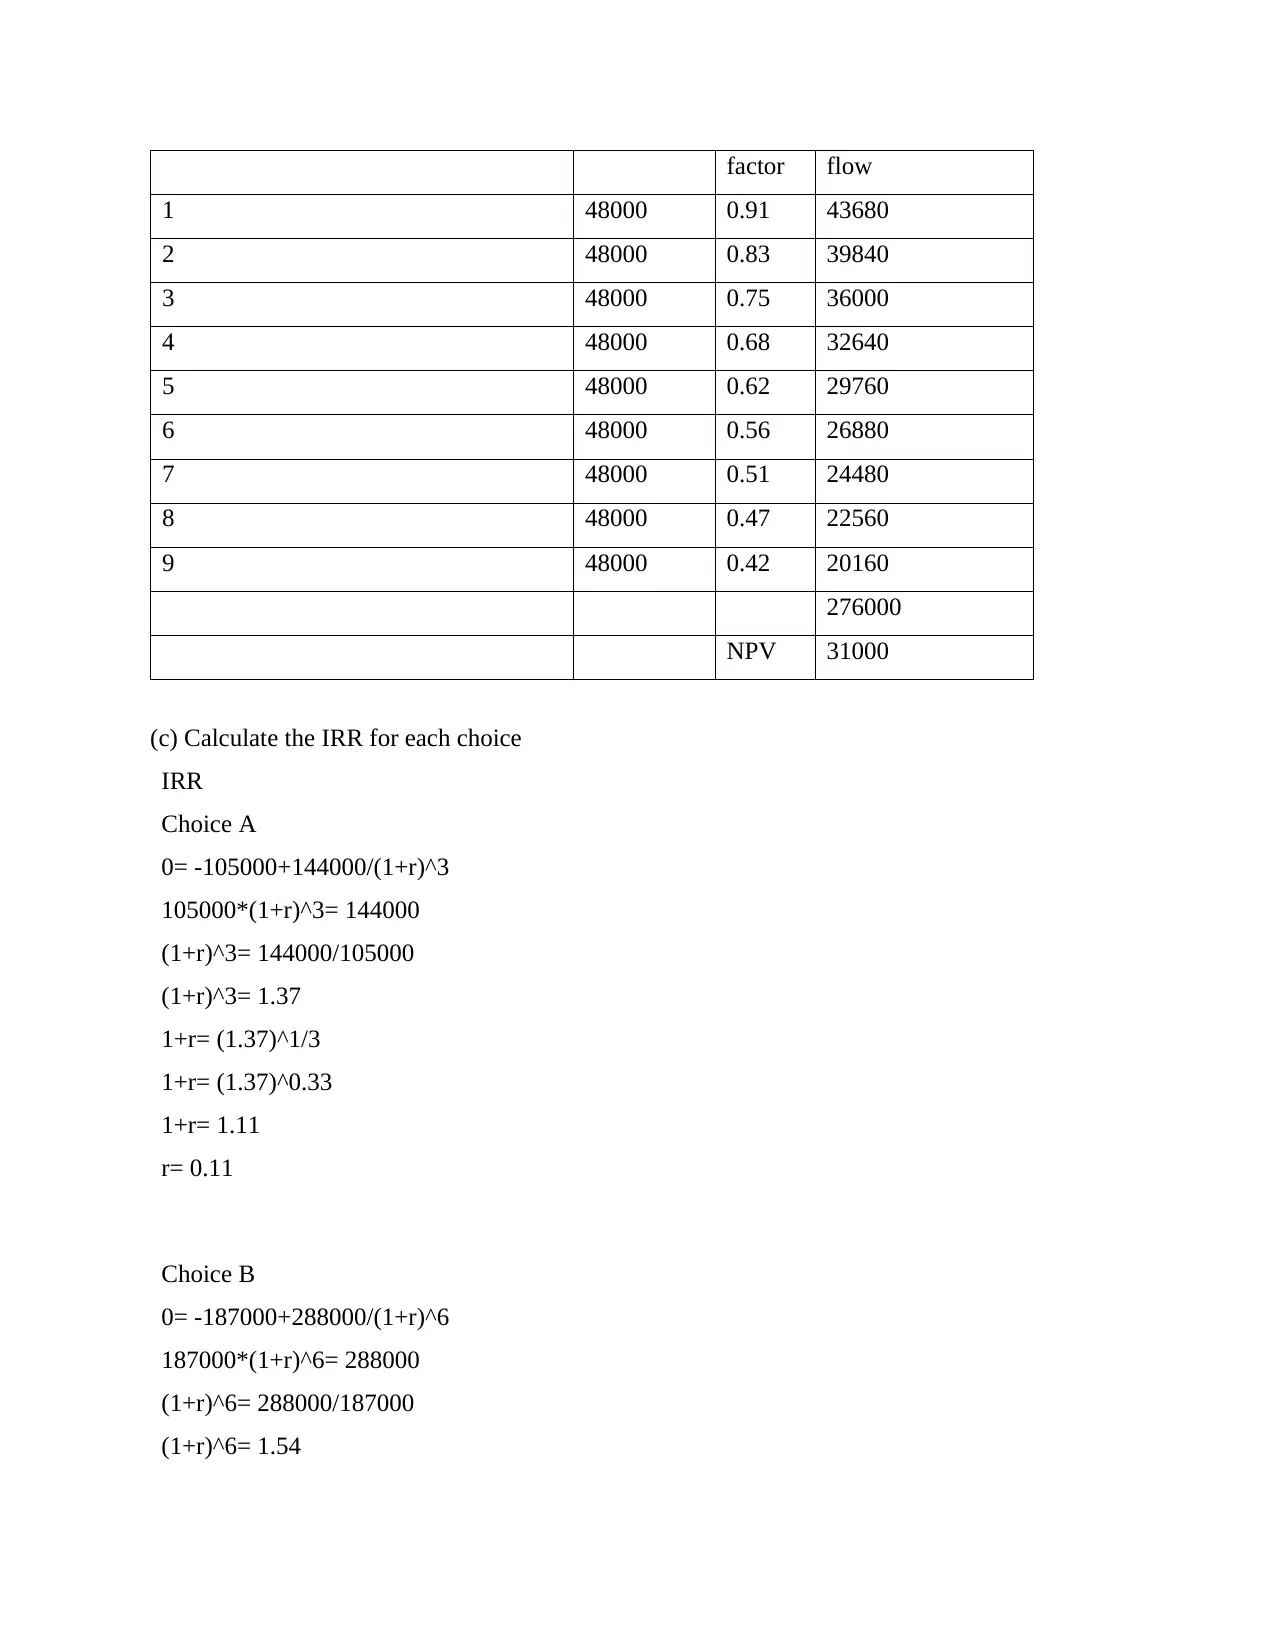
factor flow
1 48000 0.91 43680
2 48000 0.83 39840
3 48000 0.75 36000
4 48000 0.68 32640
5 48000 0.62 29760
6 48000 0.56 26880
7 48000 0.51 24480
8 48000 0.47 22560
9 48000 0.42 20160
276000
NPV 31000
(c) Calculate the IRR for each choice
IRR
Choice A
0= -105000+144000/(1+r)^3
105000*(1+r)^3= 144000
(1+r)^3= 144000/105000
(1+r)^3= 1.37
1+r= (1.37)^1/3
1+r= (1.37)^0.33
1+r= 1.11
r= 0.11
Choice B
0= -187000+288000/(1+r)^6
187000*(1+r)^6= 288000
(1+r)^6= 288000/187000
(1+r)^6= 1.54
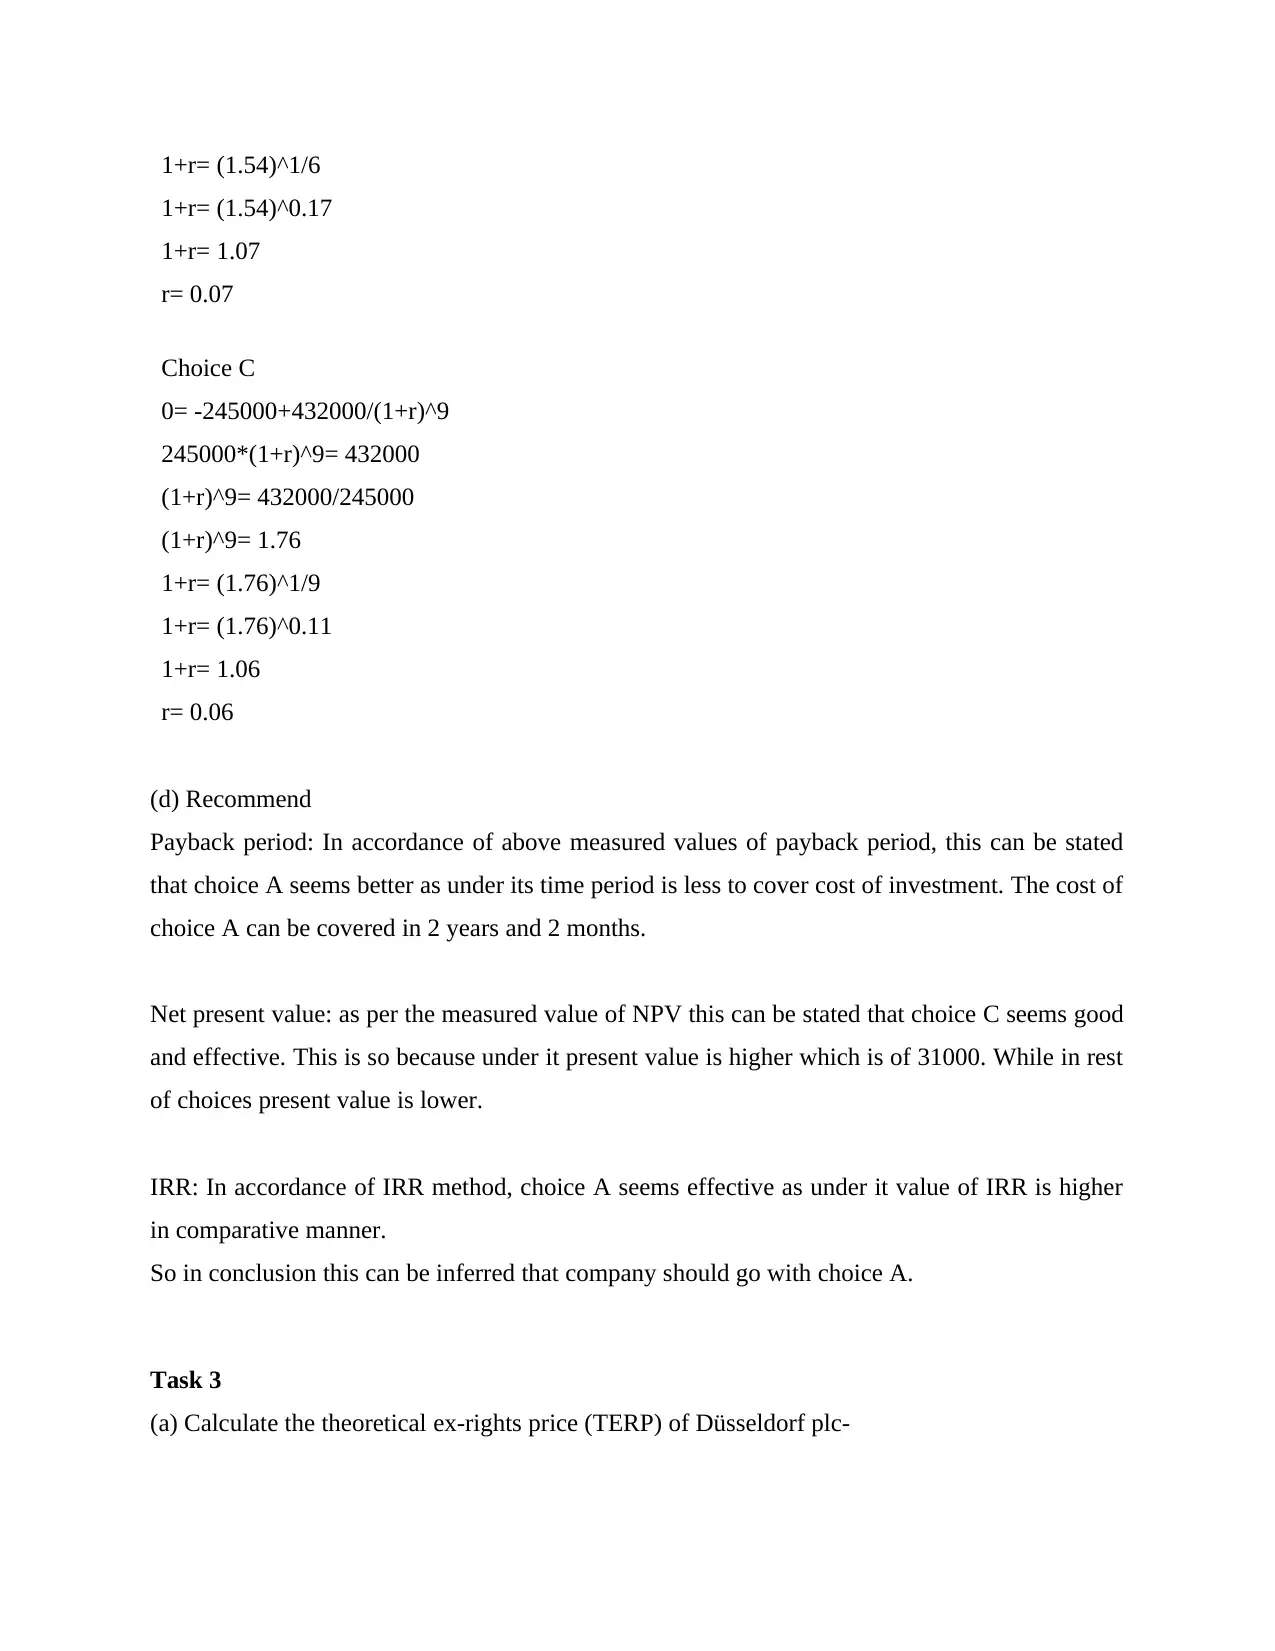
1+r= (1.54)^1/6
1+r= (1.54)^0.17
1+r= 1.07
r= 0.07
Choice C
0= -245000+432000/(1+r)^9
245000*(1+r)^9= 432000
(1+r)^9= 432000/245000
(1+r)^9= 1.76
1+r= (1.76)^1/9
1+r= (1.76)^0.11
1+r= 1.06
r= 0.06
(d) Recommend
Payback period: In accordance of above measured values of payback period, this can be stated
that choice A seems better as under its time period is less to cover cost of investment. The cost of
choice A can be covered in 2 years and 2 months.
Net present value: as per the measured value of NPV this can be stated that choice C seems good
and effective. This is so because under it present value is higher which is of 31000. While in rest
of choices present value is lower.
IRR: In accordance of IRR method, choice A seems effective as under it value of IRR is higher
in comparative manner.
So in conclusion this can be inferred that company should go with choice A.
Task 3
(a) Calculate the theoretical ex-rights price (TERP) of Düsseldorf plc-
Secure Best Marks with AI Grader
Need help grading? Try our AI Grader for instant feedback on your assignments.
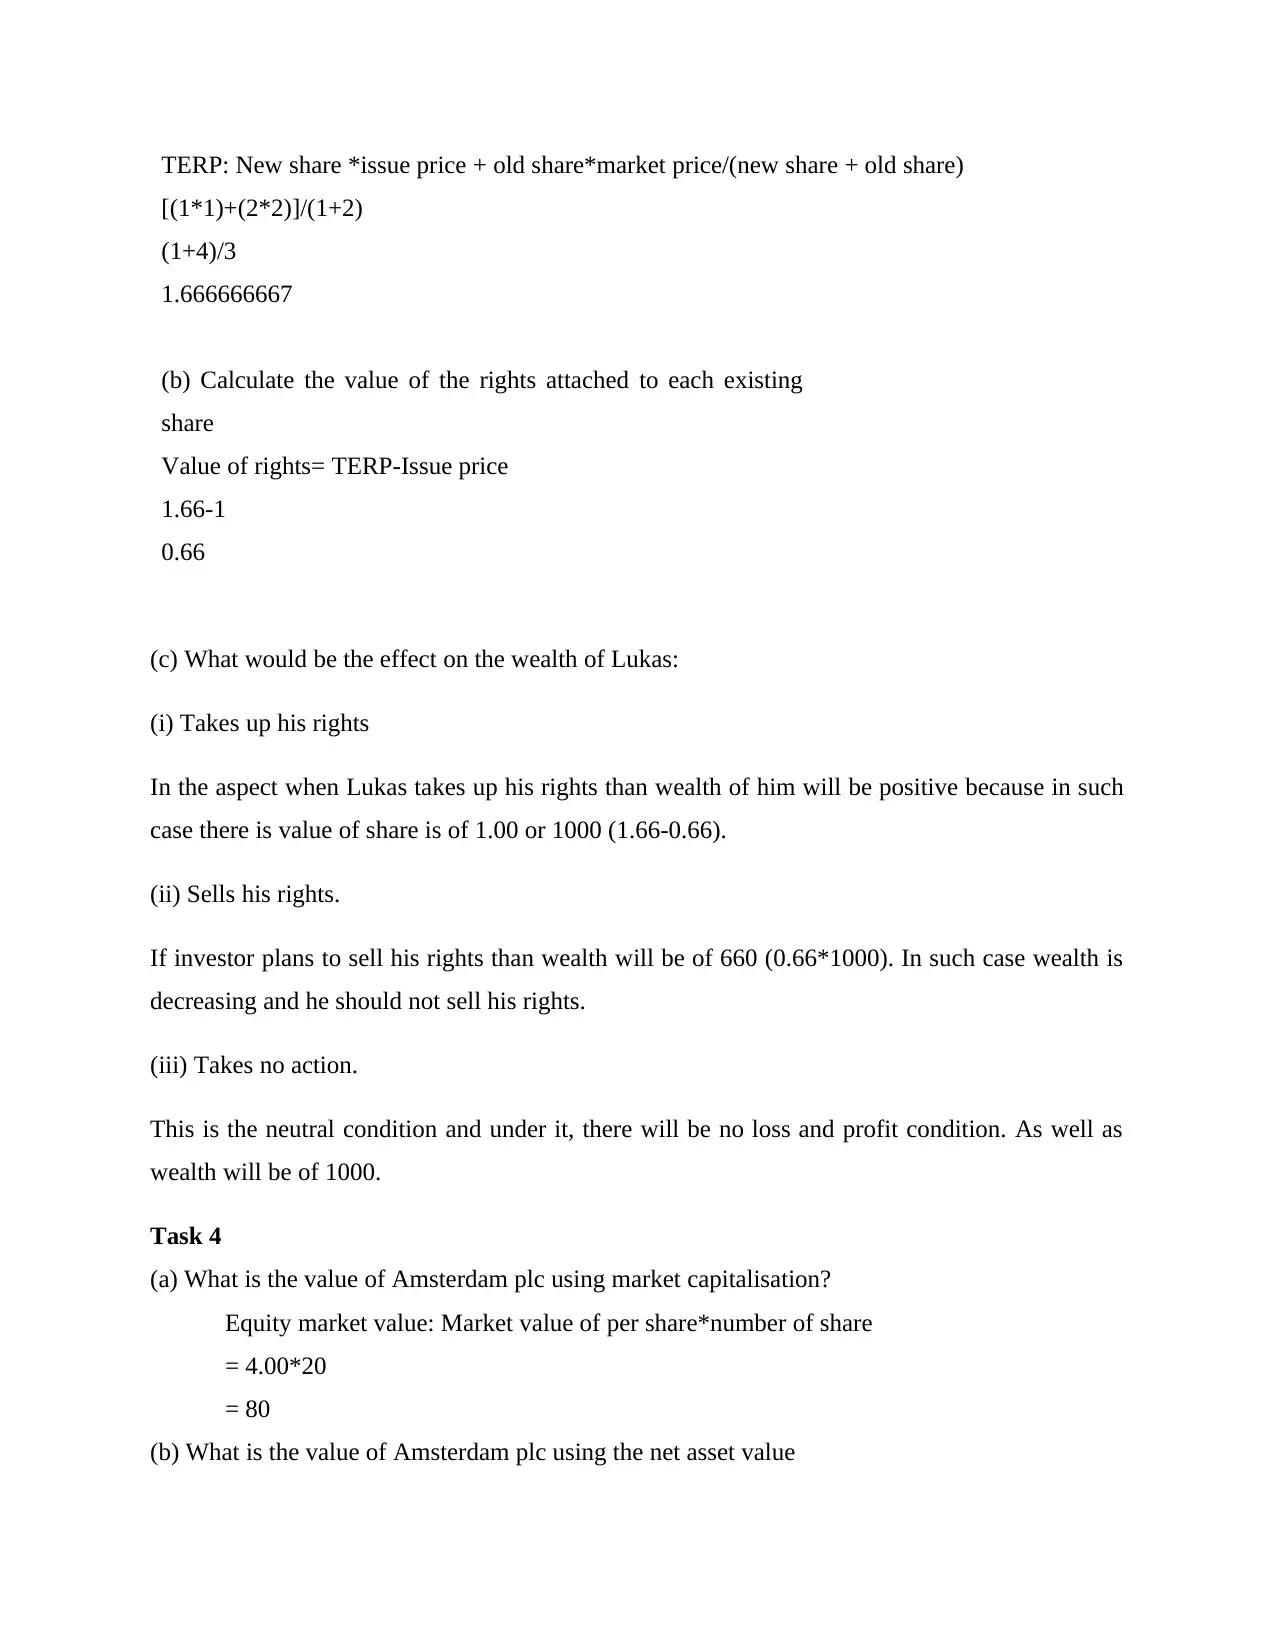
TERP: New share *issue price + old share*market price/(new share + old share)
[(1*1)+(2*2)]/(1+2)
(1+4)/3
1.666666667
(b) Calculate the value of the rights attached to each existing
share
Value of rights= TERP-Issue price
1.66-1
0.66
(c) What would be the effect on the wealth of Lukas:
(i) Takes up his rights
In the aspect when Lukas takes up his rights than wealth of him will be positive because in such
case there is value of share is of 1.00 or 1000 (1.66-0.66).
(ii) Sells his rights.
If investor plans to sell his rights than wealth will be of 660 (0.66*1000). In such case wealth is
decreasing and he should not sell his rights.
(iii) Takes no action.
This is the neutral condition and under it, there will be no loss and profit condition. As well as
wealth will be of 1000.
Task 4
(a) What is the value of Amsterdam plc using market capitalisation?
Equity market value: Market value of per share*number of share
= 4.00*20
= 80
(b) What is the value of Amsterdam plc using the net asset value
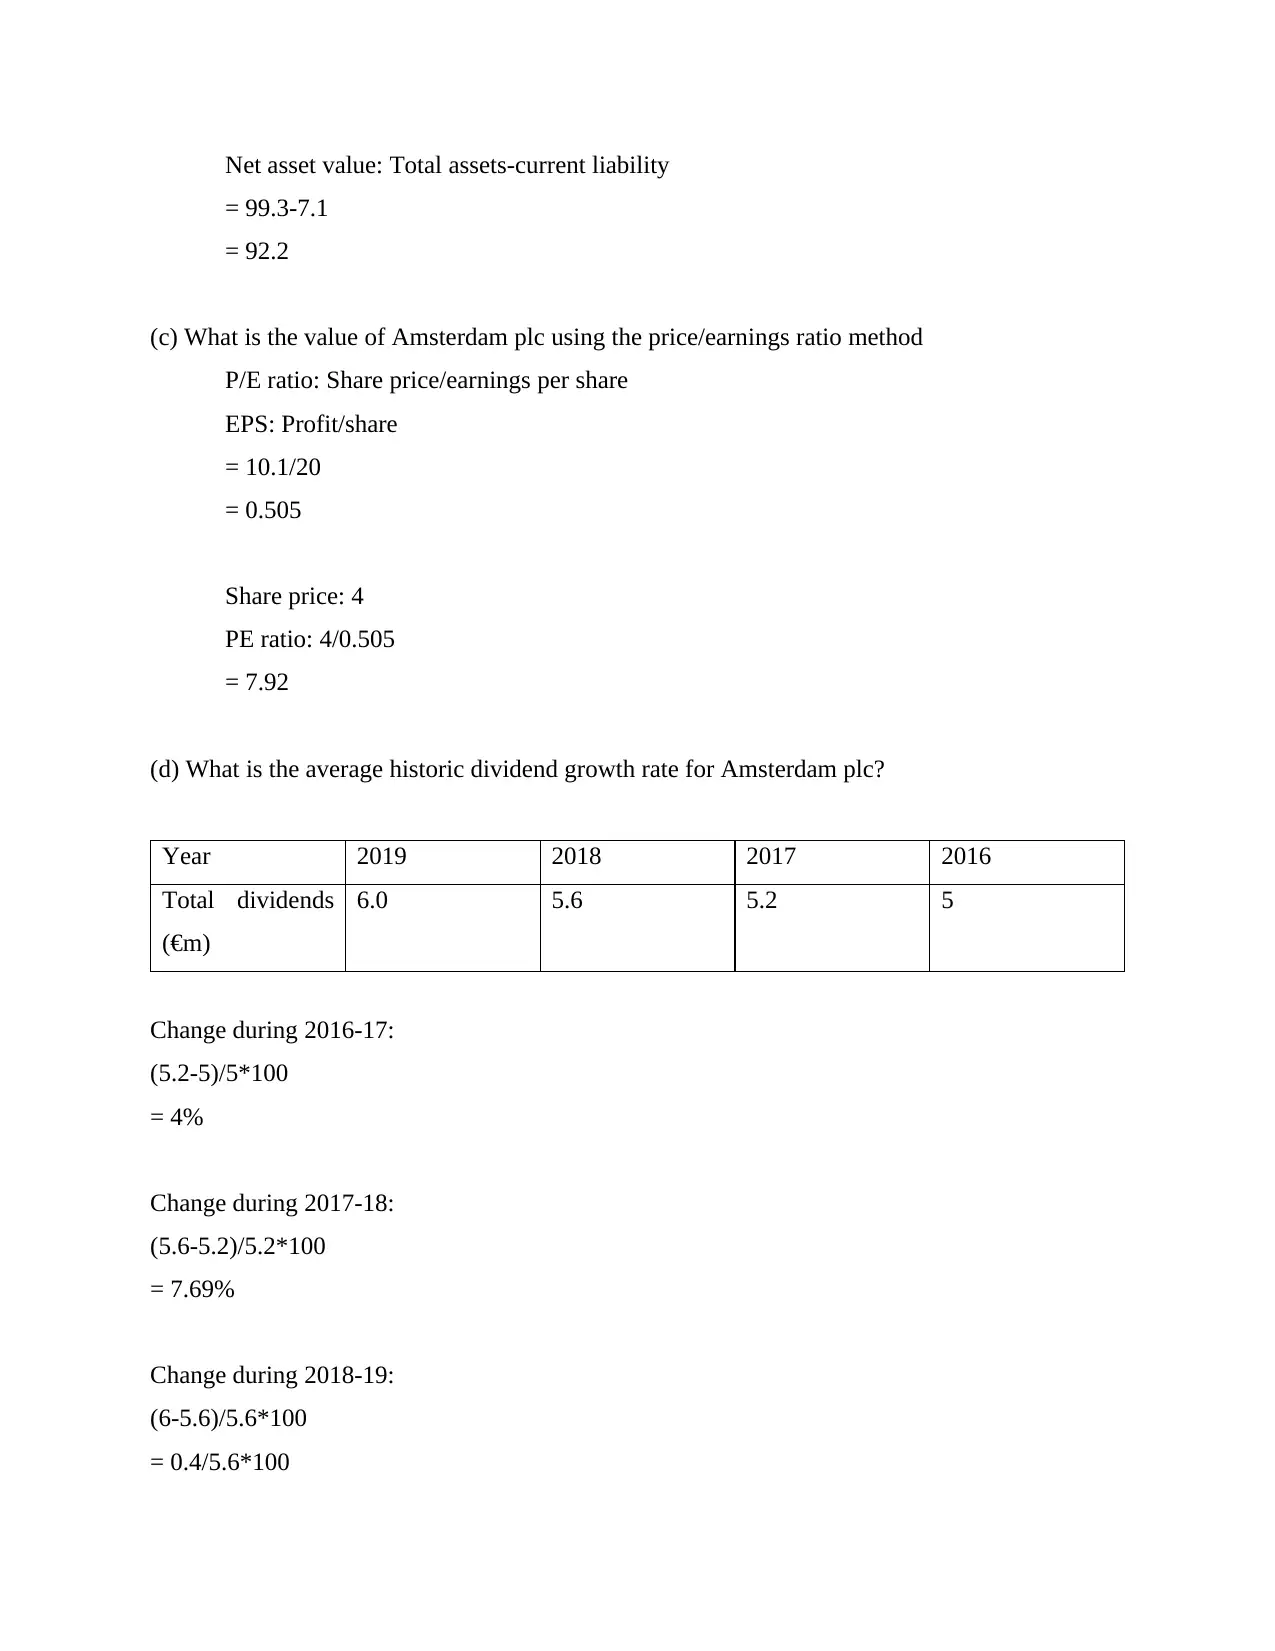
Net asset value: Total assets-current liability
= 99.3-7.1
= 92.2
(c) What is the value of Amsterdam plc using the price/earnings ratio method
P/E ratio: Share price/earnings per share
EPS: Profit/share
= 10.1/20
= 0.505
Share price: 4
PE ratio: 4/0.505
= 7.92
(d) What is the average historic dividend growth rate for Amsterdam plc?
Year 2019 2018 2017 2016
Total dividends
(€m)
6.0 5.6 5.2 5
Change during 2016-17:
(5.2-5)/5*100
= 4%
Change during 2017-18:
(5.6-5.2)/5.2*100
= 7.69%
Change during 2018-19:
(6-5.6)/5.6*100
= 0.4/5.6*100
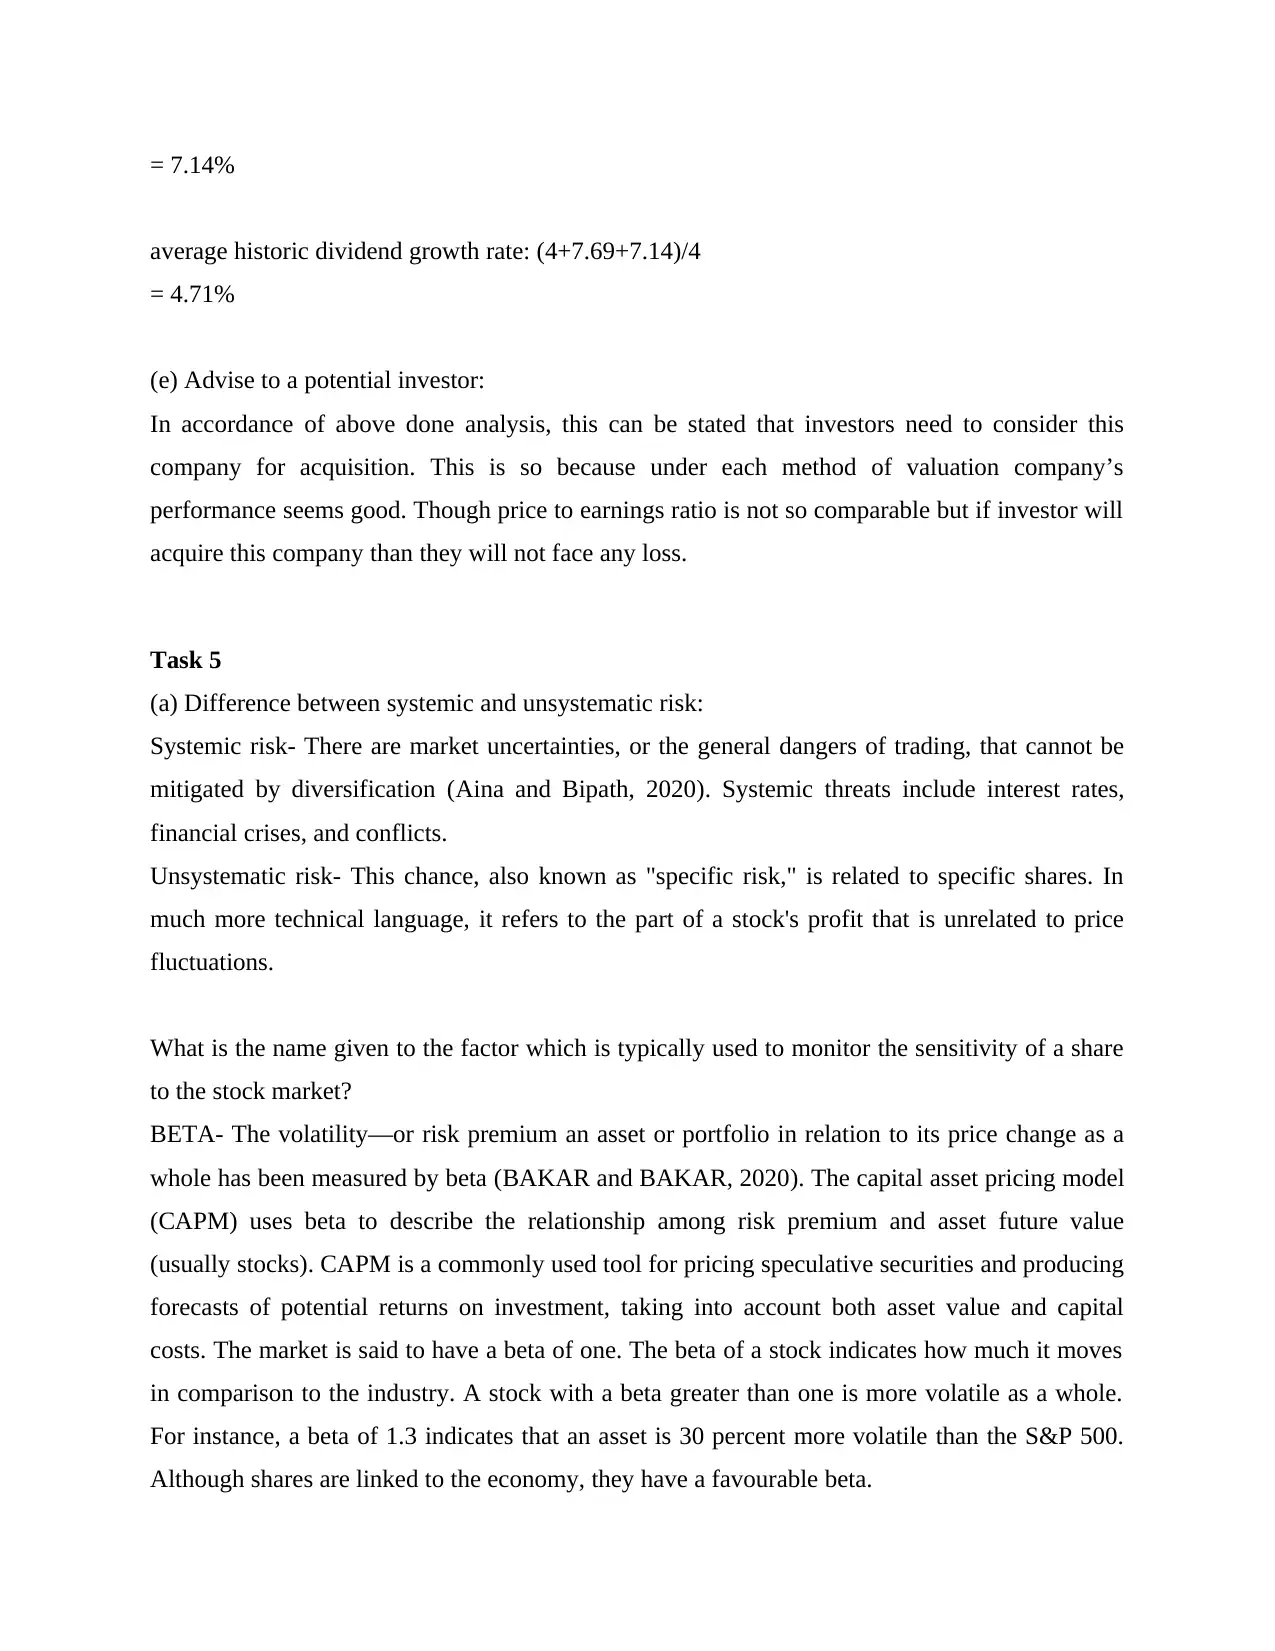
= 7.14%
average historic dividend growth rate: (4+7.69+7.14)/4
= 4.71%
(e) Advise to a potential investor:
In accordance of above done analysis, this can be stated that investors need to consider this
company for acquisition. This is so because under each method of valuation company’s
performance seems good. Though price to earnings ratio is not so comparable but if investor will
acquire this company than they will not face any loss.
Task 5
(a) Difference between systemic and unsystematic risk:
Systemic risk- There are market uncertainties, or the general dangers of trading, that cannot be
mitigated by diversification (Aina and Bipath, 2020). Systemic threats include interest rates,
financial crises, and conflicts.
Unsystematic risk- This chance, also known as "specific risk," is related to specific shares. In
much more technical language, it refers to the part of a stock's profit that is unrelated to price
fluctuations.
What is the name given to the factor which is typically used to monitor the sensitivity of a share
to the stock market?
BETA- The volatility—or risk premium an asset or portfolio in relation to its price change as a
whole has been measured by beta (BAKAR and BAKAR, 2020). The capital asset pricing model
(CAPM) uses beta to describe the relationship among risk premium and asset future value
(usually stocks). CAPM is a commonly used tool for pricing speculative securities and producing
forecasts of potential returns on investment, taking into account both asset value and capital
costs. The market is said to have a beta of one. The beta of a stock indicates how much it moves
in comparison to the industry. A stock with a beta greater than one is more volatile as a whole.
For instance, a beta of 1.3 indicates that an asset is 30 percent more volatile than the S&P 500.
Although shares are linked to the economy, they have a favourable beta.
Paraphrase This Document
Need a fresh take? Get an instant paraphrase of this document with our AI Paraphraser
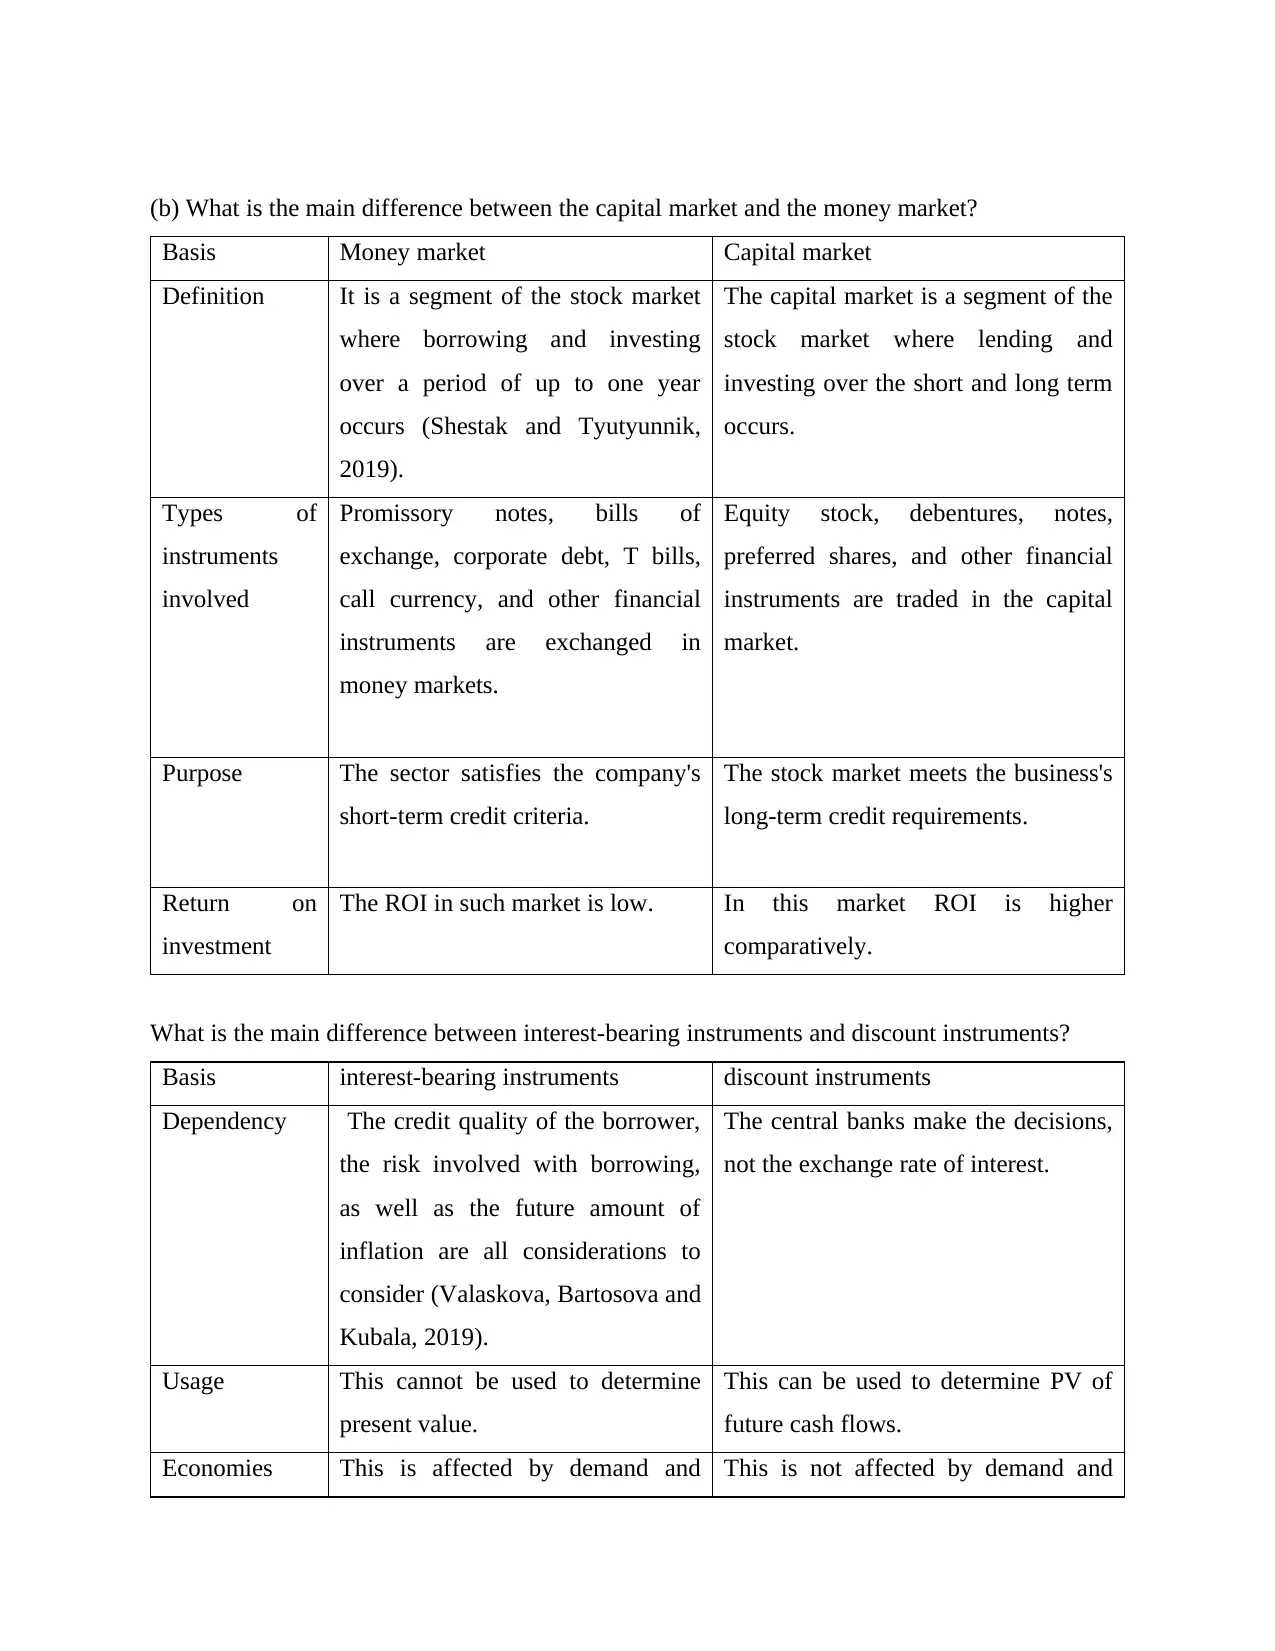
(b) What is the main difference between the capital market and the money market?
Basis Money market Capital market
Definition It is a segment of the stock market
where borrowing and investing
over a period of up to one year
occurs (Shestak and Tyutyunnik,
2019).
The capital market is a segment of the
stock market where lending and
investing over the short and long term
occurs.
Types of
instruments
involved
Promissory notes, bills of
exchange, corporate debt, T bills,
call currency, and other financial
instruments are exchanged in
money markets.
Equity stock, debentures, notes,
preferred shares, and other financial
instruments are traded in the capital
market.
Purpose The sector satisfies the company's
short-term credit criteria.
The stock market meets the business's
long-term credit requirements.
Return on
investment
The ROI in such market is low. In this market ROI is higher
comparatively.
What is the main difference between interest-bearing instruments and discount instruments?
Basis interest-bearing instruments discount instruments
Dependency The credit quality of the borrower,
the risk involved with borrowing,
as well as the future amount of
inflation are all considerations to
consider (Valaskova, Bartosova and
Kubala, 2019).
The central banks make the decisions,
not the exchange rate of interest.
Usage This cannot be used to determine
present value.
This can be used to determine PV of
future cash flows.
Economies This is affected by demand and This is not affected by demand and
supply in economy. supply in economy.
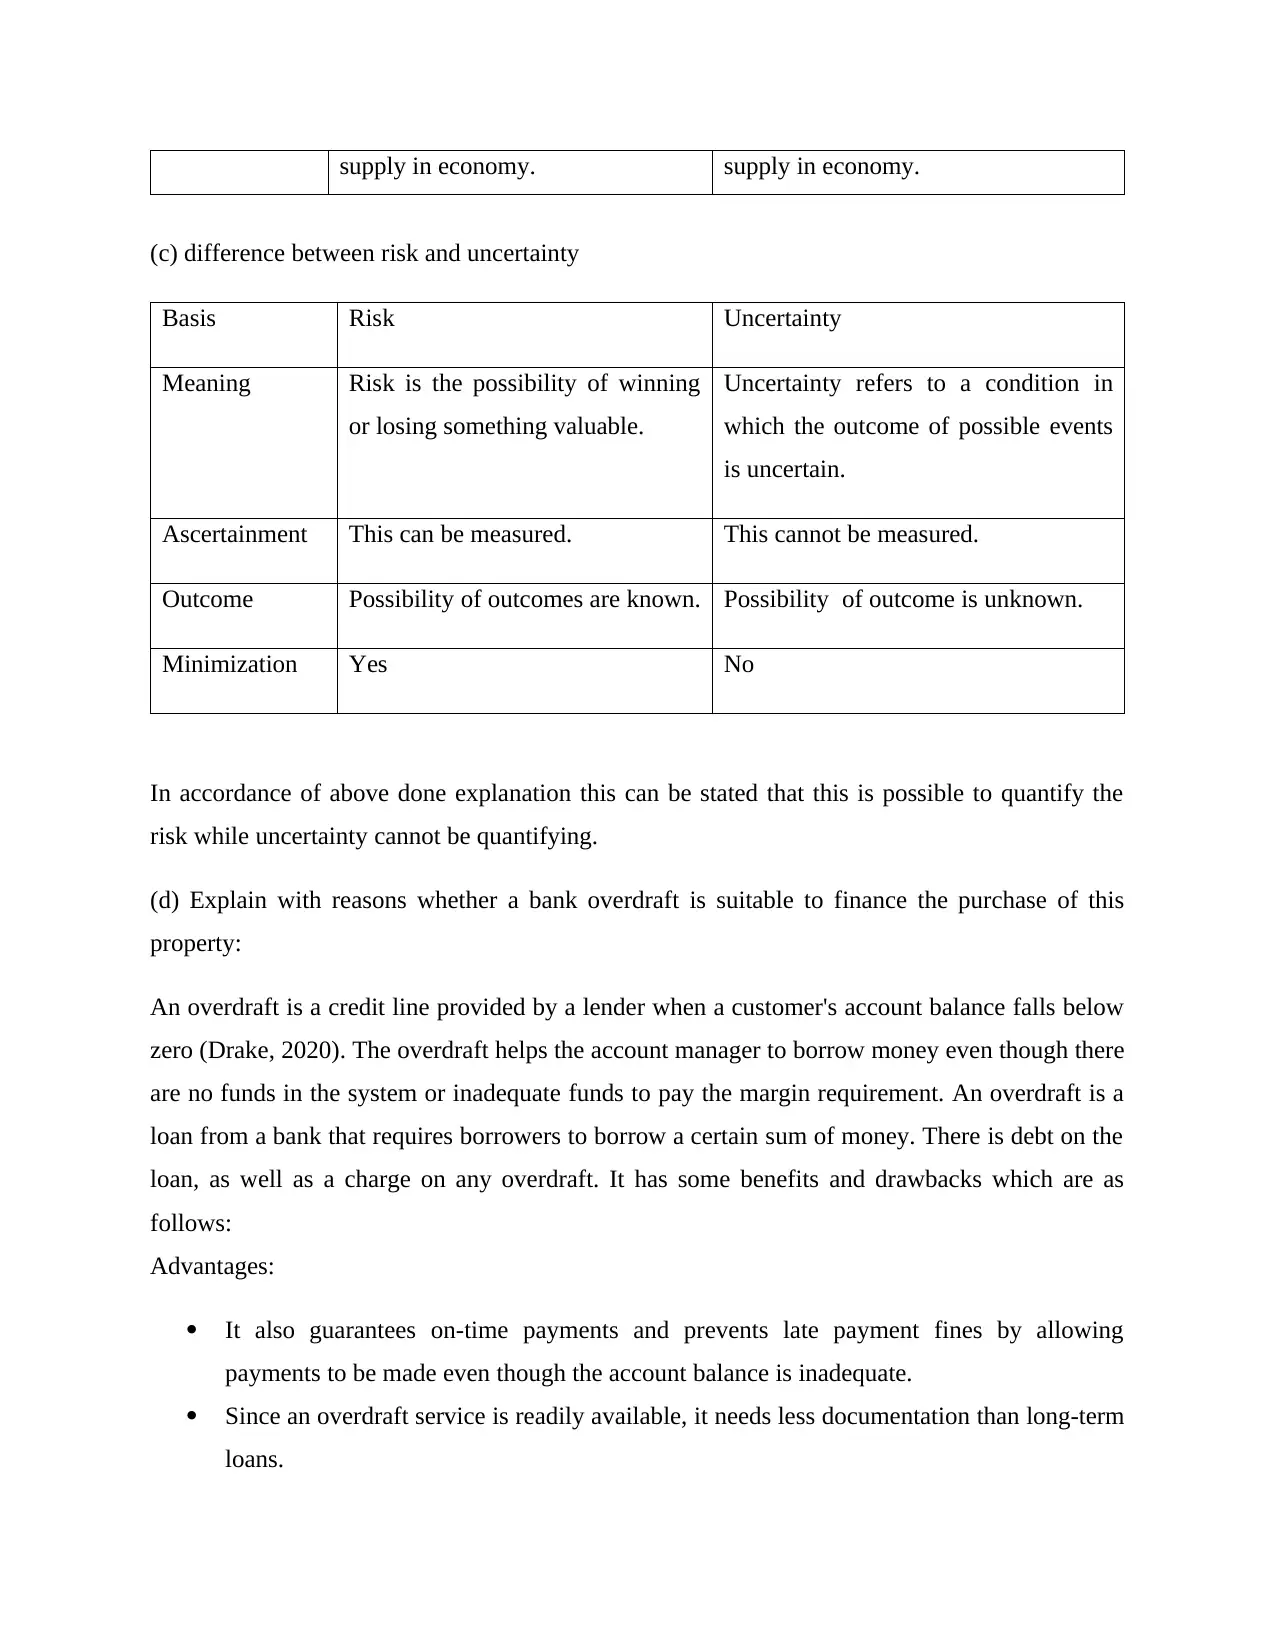
(c) difference between risk and uncertainty
Basis Risk Uncertainty
Meaning Risk is the possibility of winning
or losing something valuable.
Uncertainty refers to a condition in
which the outcome of possible events
is uncertain.
Ascertainment This can be measured. This cannot be measured.
Outcome Possibility of outcomes are known. Possibility of outcome is unknown.
Minimization Yes No
In accordance of above done explanation this can be stated that this is possible to quantify the
risk while uncertainty cannot be quantifying.
(d) Explain with reasons whether a bank overdraft is suitable to finance the purchase of this
property:
An overdraft is a credit line provided by a lender when a customer's account balance falls below
zero (Drake, 2020). The overdraft helps the account manager to borrow money even though there
are no funds in the system or inadequate funds to pay the margin requirement. An overdraft is a
loan from a bank that requires borrowers to borrow a certain sum of money. There is debt on the
loan, as well as a charge on any overdraft. It has some benefits and drawbacks which are as
follows:
Advantages:
It also guarantees on-time payments and prevents late payment fines by allowing
payments to be made even though the account balance is inadequate.
Since an overdraft service is readily available, it needs less documentation than long-term
loans.
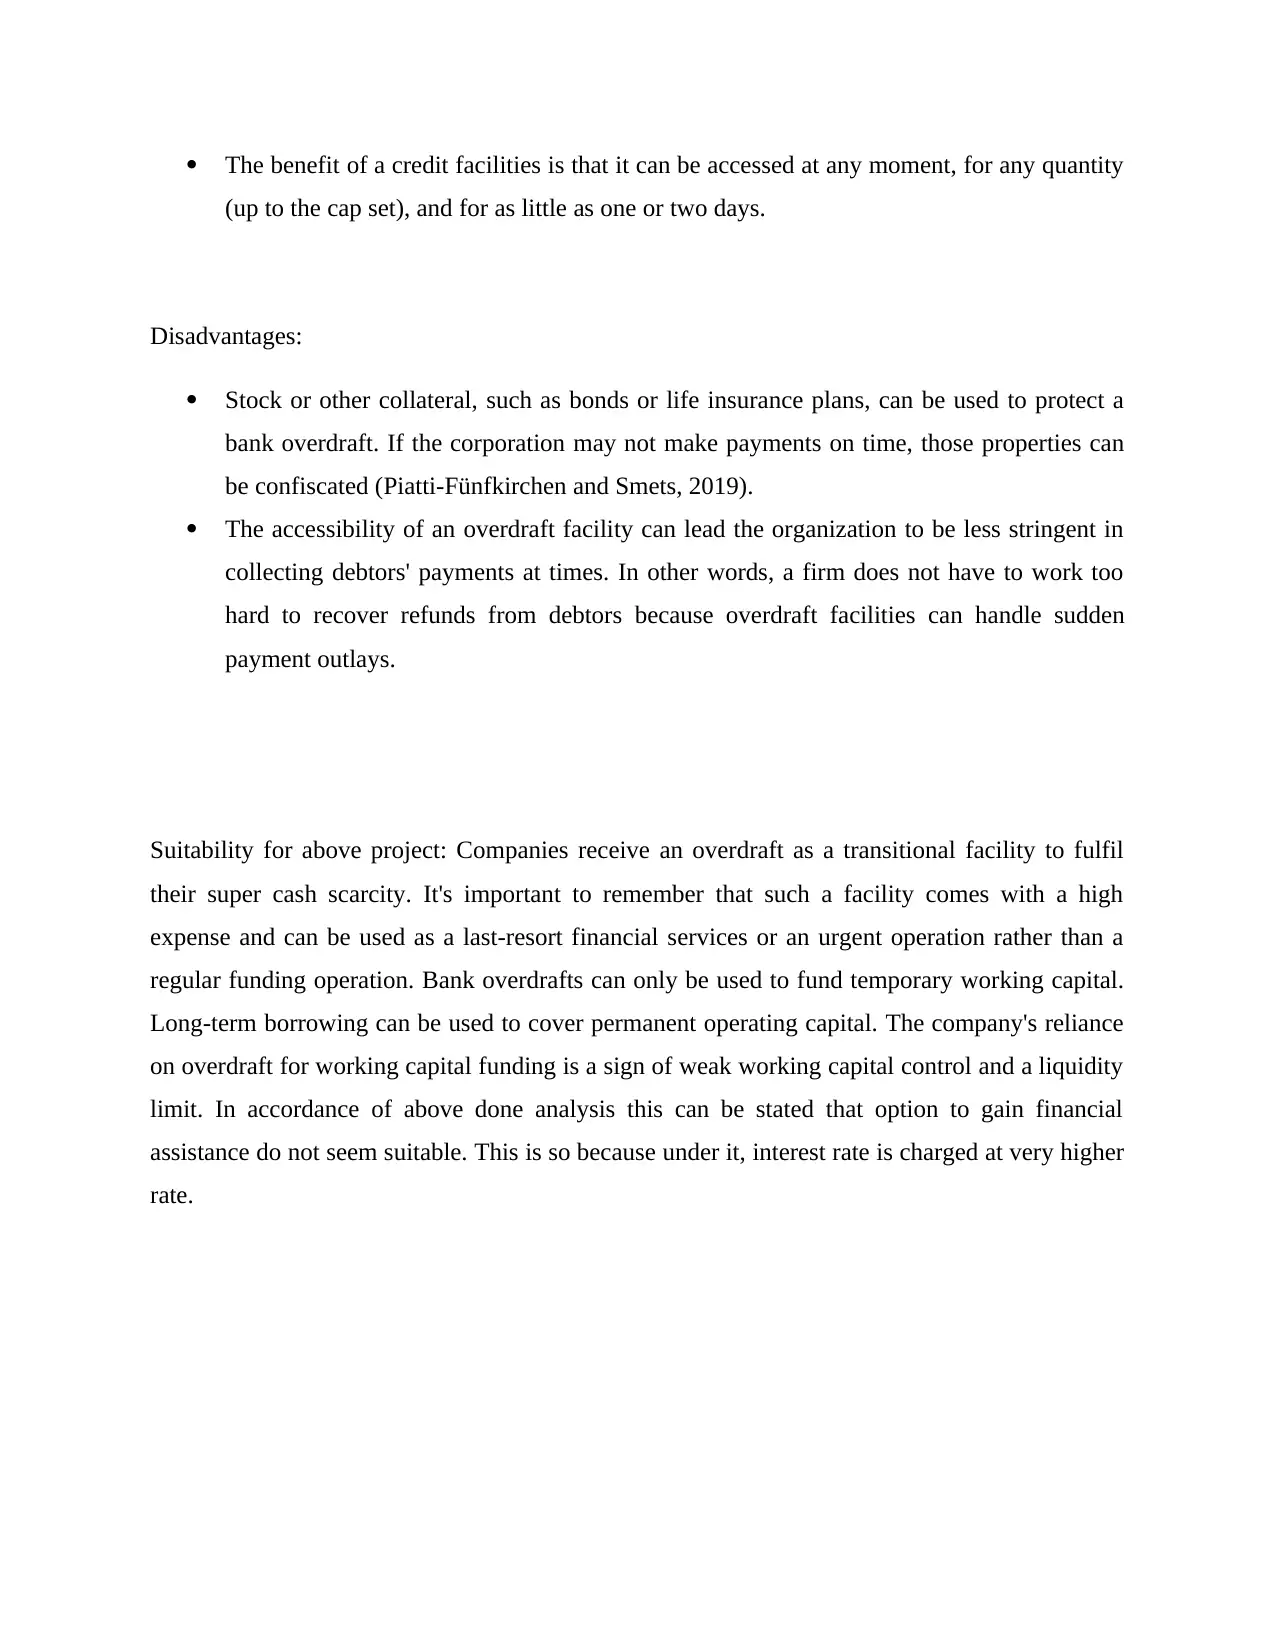
The benefit of a credit facilities is that it can be accessed at any moment, for any quantity
(up to the cap set), and for as little as one or two days.
Disadvantages:
Stock or other collateral, such as bonds or life insurance plans, can be used to protect a
bank overdraft. If the corporation may not make payments on time, those properties can
be confiscated (Piatti-Fünfkirchen and Smets, 2019).
The accessibility of an overdraft facility can lead the organization to be less stringent in
collecting debtors' payments at times. In other words, a firm does not have to work too
hard to recover refunds from debtors because overdraft facilities can handle sudden
payment outlays.
Suitability for above project: Companies receive an overdraft as a transitional facility to fulfil
their super cash scarcity. It's important to remember that such a facility comes with a high
expense and can be used as a last-resort financial services or an urgent operation rather than a
regular funding operation. Bank overdrafts can only be used to fund temporary working capital.
Long-term borrowing can be used to cover permanent operating capital. The company's reliance
on overdraft for working capital funding is a sign of weak working capital control and a liquidity
limit. In accordance of above done analysis this can be stated that option to gain financial
assistance do not seem suitable. This is so because under it, interest rate is charged at very higher
rate.
Secure Best Marks with AI Grader
Need help grading? Try our AI Grader for instant feedback on your assignments.
REFERENCES
Shapiro, A.C. and Hanouna, P., 2019. Multinational financial management. John Wiley & Sons.
Prihartono, M.R.D. and Asandimitra, N., 2018. Analysis factors influencing financial
management behaviour. International Journal of Academic Research in Business and
Social Sciences, 8(8), pp.308-326.
Finkler, S.A., Smith, D.L. and Calabrese, T.D., 2018. Financial management for public, health,
and not-for-profit organizations. CQ Press.
Yuniningsih, Y., Pertiwi, T. and Purwanto, E., 2019. Fundamental factor of financial
management in determining company values. Management Science Letters, 9(2), pp.205-
216.
Aina, A.Y. and Bipath, K., 2020. School financial management: Insights for decision making in
public primary schools. South African Journal of Education, 40(4).
BAKAR, M.Z.A. and BAKAR, S.A., 2020. Prudent financial management practices among
Malaysian youth: The moderating roles of financial education. The Journal of Asian
Finance, Economics, and Business, 7(6), pp.525-535.
Shestak, V.P., El, M. and Tyutyunnik, I.G., 2019. Financial management of innovative
activity. Finansy: teoriya i praktika= Finance: Theory and Practice, 23(6), pp.63-75.
Valaskova, K., Bartosova, V. and Kubala, P., 2019. Behavioural aspects of the financial
decision-making. Organizacija, 52(1).
Drake, P.P., 2020. Capital Markets, Financial Management, and Investment Management.
Piatti-Fünfkirchen, M. and Smets, L., 2019. Public financial management, health financing and
under-five mortality: a comparative empirical analysis (No. IDB-WP-976). IDB
Working Paper Series.
1 out of 17
Related Documents


Your All-in-One AI-Powered Toolkit for Academic Success.
+13062052269
info@desklib.com
Available 24*7 on WhatsApp / Email
![[object Object]](/_next/static/media/star-bottom.7253800d.svg)
Unlock your academic potential
© 2024 | Zucol Services PVT LTD | All rights reserved.