Detailed Financial Ratio Analysis: A Comparative Study of Two Firms
VerifiedAdded on 2024/05/30
|13
|3757
|159
Report
AI Summary
This assignment provides a comprehensive financial analysis of Sports Direct and JD Sports, comparing their performance using various financial ratios from 2015 to 2016. The analysis covers liquidity, efficiency, gearing, profitability, and investment ratios to assess each company's financial health and risk. Sports Direct's liquidity was standard but efficiency declined, while JD Sports showed better efficiency. Both companies had similar gearing positions. Sports Direct's profitability was lower, while JD Sports' was slightly better but with higher indirect costs. The report concludes with recommendations for Sports Direct to improve cost control, inventory management, and employee training. Desklib is the perfect platform for students looking for similar solved assignments and resources.

MANAGERIAL FINANCE
Paraphrase This Document
Need a fresh take? Get an instant paraphrase of this document with our AI Paraphraser
Table of contents
Portfolio 1...................................................................................................................................3
a. Calculating the financial ratios of Sports Direct and JD Sports.............................................3
b. Performance analysis of the companies.................................................................................5
c. Recommendations to the company.........................................................................................8
d. Limitations of financial ratio analysis....................................................................................9
Portfolio 2.................................................................................................................................11
a. Use of investment appraisal techniques...............................................................................11
b. Limitations of investment appraisal techniques in long-term decision making...................11
Reference list............................................................................................................................13
2 | P a g e
Portfolio 1
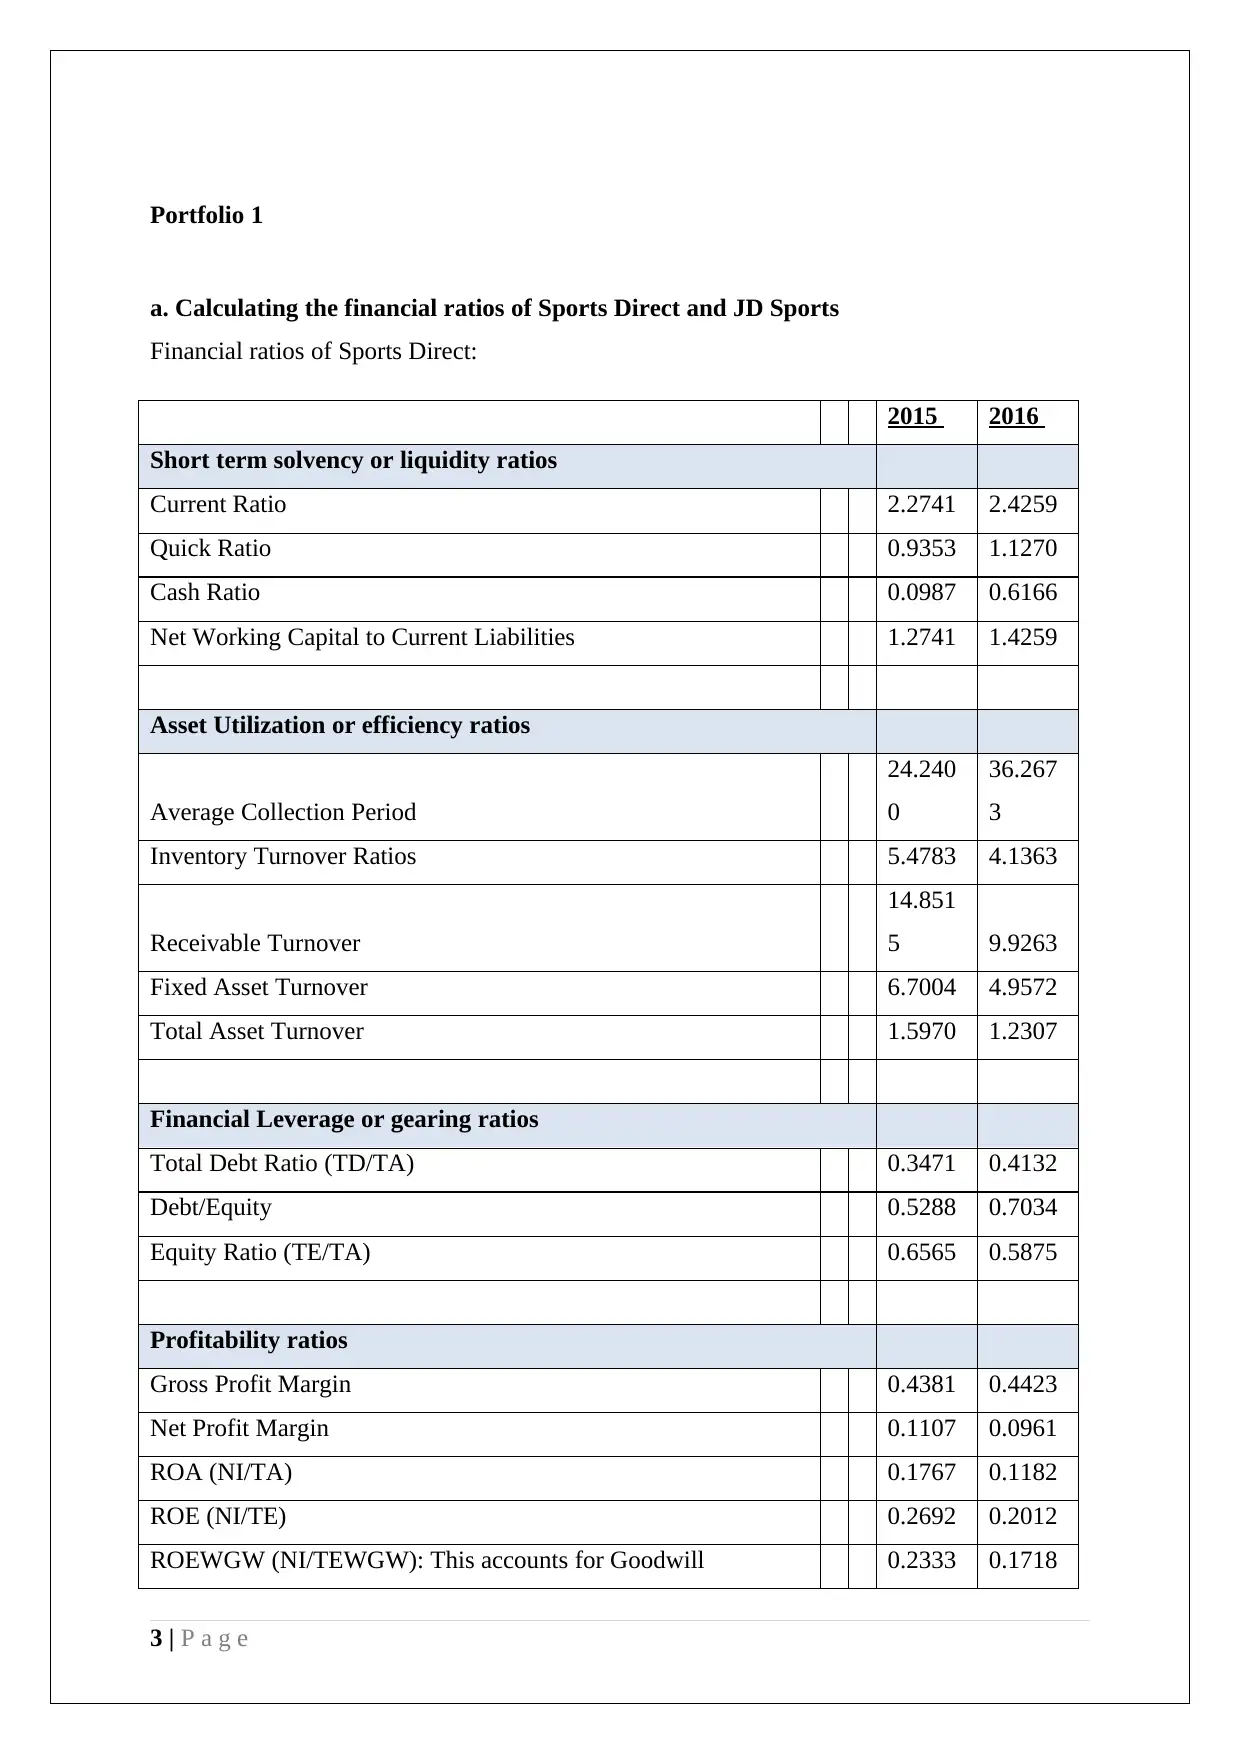
a. Calculating the financial ratios of Sports Direct and JD Sports
Financial ratios of Sports Direct:
2015 2016
Short term solvency or liquidity ratios
Current Ratio 2.2741 2.4259
Quick Ratio 0.9353 1.1270
Cash Ratio 0.0987 0.6166
Net Working Capital to Current Liabilities 1.2741 1.4259
Asset Utilization or efficiency ratios
Average Collection Period
24.240
0
36.267
3
Inventory Turnover Ratios 5.4783 4.1363
Receivable Turnover
14.851
5 9.9263
Fixed Asset Turnover 6.7004 4.9572
Total Asset Turnover 1.5970 1.2307
Financial Leverage or gearing ratios
Total Debt Ratio (TD/TA) 0.3471 0.4132
Debt/Equity 0.5288 0.7034
Equity Ratio (TE/TA) 0.6565 0.5875
Profitability ratios
Gross Profit Margin 0.4381 0.4423
Net Profit Margin 0.1107 0.0961
ROA (NI/TA) 0.1767 0.1182
ROE (NI/TE) 0.2692 0.2012
ROEWGW (NI/TEWGW): This accounts for Goodwill 0.2333 0.1718
3 | P a g e
⊘ This is a preview!⊘
Do you want full access?
Subscribe today to unlock all pages.
Trusted by 1+ million students worldwide
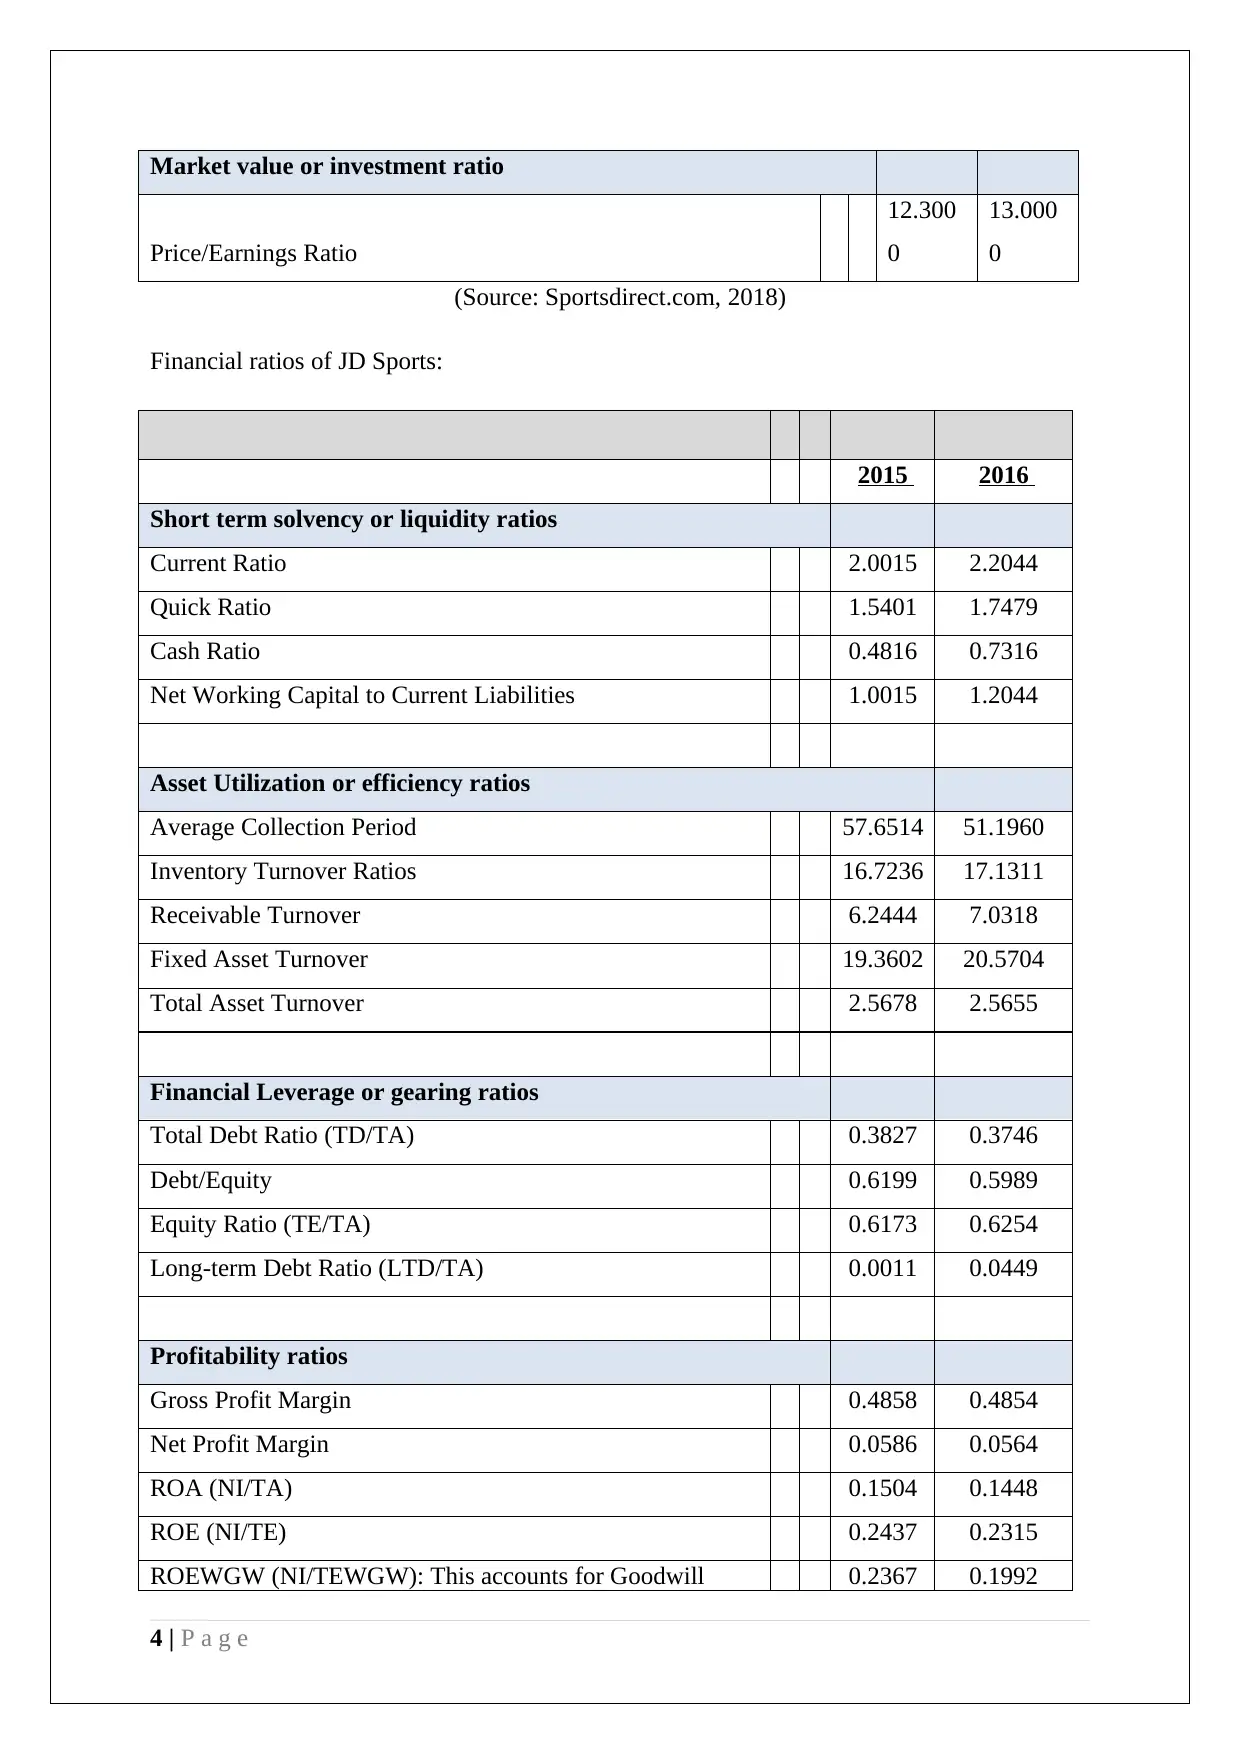
Market value or investment ratio
Price/Earnings Ratio
12.300
0
13.000
0
(Source: Sportsdirect.com, 2018)
Financial ratios of JD Sports:
2015 2016
Short term solvency or liquidity ratios
Current Ratio 2.0015 2.2044
Quick Ratio 1.5401 1.7479
Cash Ratio 0.4816 0.7316
Net Working Capital to Current Liabilities 1.0015 1.2044
Asset Utilization or efficiency ratios
Average Collection Period 57.6514 51.1960
Inventory Turnover Ratios 16.7236 17.1311
Receivable Turnover 6.2444 7.0318
Fixed Asset Turnover 19.3602 20.5704
Total Asset Turnover 2.5678 2.5655
Financial Leverage or gearing ratios
Total Debt Ratio (TD/TA) 0.3827 0.3746
Debt/Equity 0.6199 0.5989
Equity Ratio (TE/TA) 0.6173 0.6254
Long-term Debt Ratio (LTD/TA) 0.0011 0.0449
Profitability ratios
Gross Profit Margin 0.4858 0.4854
Net Profit Margin 0.0586 0.0564
ROA (NI/TA) 0.1504 0.1448
ROE (NI/TE) 0.2437 0.2315
ROEWGW (NI/TEWGW): This accounts for Goodwill 0.2367 0.1992
4 | P a g e
Paraphrase This Document
Need a fresh take? Get an instant paraphrase of this document with our AI Paraphraser
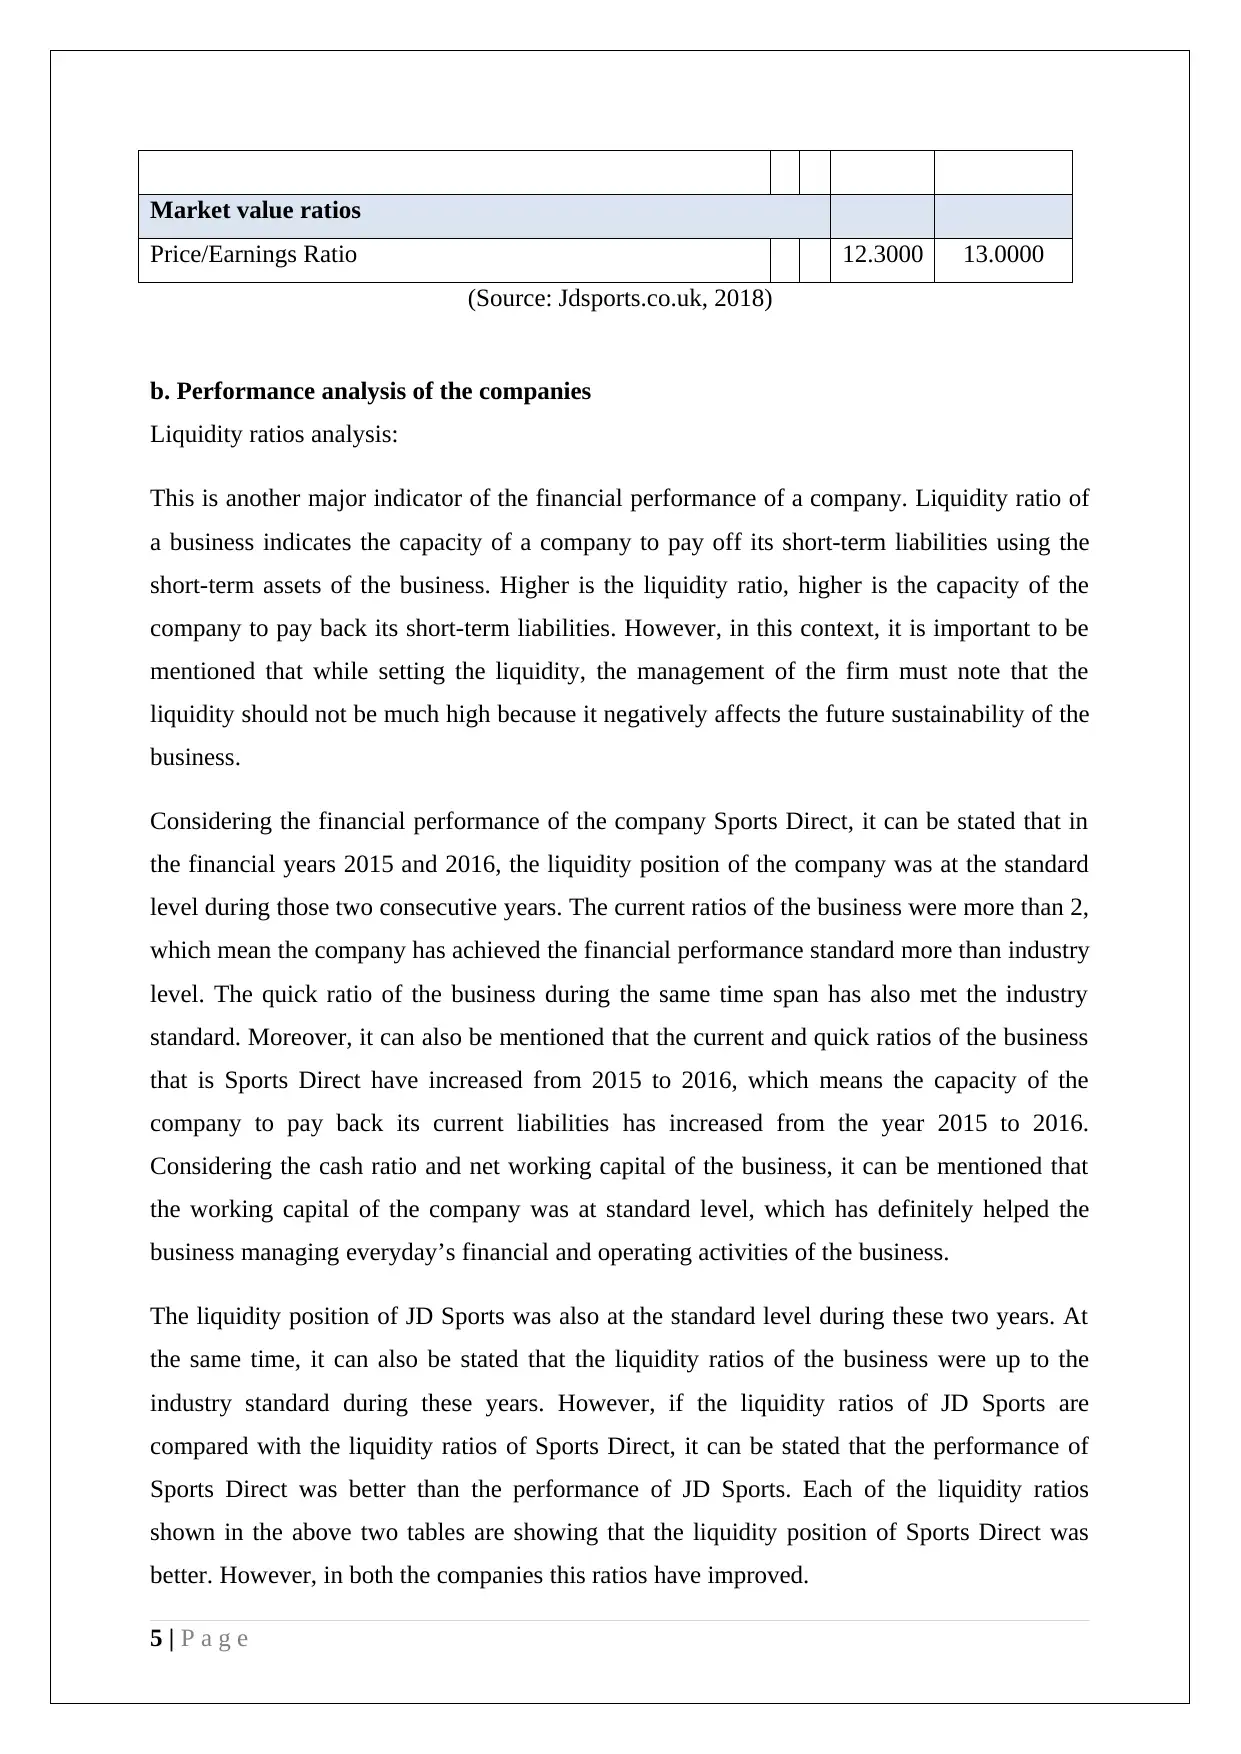
Market value ratios
Price/Earnings Ratio 12.3000 13.0000
(Source: Jdsports.co.uk, 2018)
b. Performance analysis of the companies
Liquidity ratios analysis:
This is another major indicator of the financial performance of a company. Liquidity ratio of
a business indicates the capacity of a company to pay off its short-term liabilities using the
short-term assets of the business. Higher is the liquidity ratio, higher is the capacity of the
company to pay back its short-term liabilities. However, in this context, it is important to be
mentioned that while setting the liquidity, the management of the firm must note that the
liquidity should not be much high because it negatively affects the future sustainability of the
business.
Considering the financial performance of the company Sports Direct, it can be stated that in
the financial years 2015 and 2016, the liquidity position of the company was at the standard
level during those two consecutive years. The current ratios of the business were more than 2,
which mean the company has achieved the financial performance standard more than industry
level. The quick ratio of the business during the same time span has also met the industry
standard. Moreover, it can also be mentioned that the current and quick ratios of the business
that is Sports Direct have increased from 2015 to 2016, which means the capacity of the
company to pay back its current liabilities has increased from the year 2015 to 2016.
Considering the cash ratio and net working capital of the business, it can be mentioned that
the working capital of the company was at standard level, which has definitely helped the
business managing everyday’s financial and operating activities of the business.
The liquidity position of JD Sports was also at the standard level during these two years. At
the same time, it can also be stated that the liquidity ratios of the business were up to the
industry standard during these years. However, if the liquidity ratios of JD Sports are
compared with the liquidity ratios of Sports Direct, it can be stated that the performance of
Sports Direct was better than the performance of JD Sports. Each of the liquidity ratios
shown in the above two tables are showing that the liquidity position of Sports Direct was
better. However, in both the companies this ratios have improved.
5 | P a g e
Efficiency ratio analysis:
Efficiency ratios of a business indicate the level or standard of the company using its assets
and other resources in a particular financial year. At the same time, the efficiency ratios of the
business also indicates the capacity of the management to handle the inventory in a given
time span.
If the efficiency ratio of Sport Direct is considered, it can be stated that during the financial
years 2015 and 2016, the efficiency level of the business has decreased. The inventory
turnover ratios of the company during the two years are indicating that the ability of the
management to handle the inventory has declined, which means the sales flow of the business
has also affected due to the same. On the other hand, the ratios of average collection period
are indicating that from 2015 to 2016, the company has increased the time for collecting
money from the debtors, which is not indicating good performance standard. Receivable
turnover, fixed assets turnover and total assets turnover ratios of the business are also
indicating that the capacity of the company to generate revenue by using its short-term and
long-term assets has declined, which means performance standard of the business has also
declined.
If the efficiency ratios of JD Sports are considered, it can be stated that the efficiency of JD
Sports was higher than the efficiency level of Sports Direct. JD Sports has decreased the
average collection period and at the same time, the inventory turnover ratio of the business
has increased, which means the sales flow of the business has also increased. At the same
time, compared to Sports Direct, the turnover ratios of the business in the context of fixed
assets, receivables and total assets are also better during the financial years 2015 and 2016. It
is clearly indicating that the efficiency level of JD Sports was better than its competitor.
Gearing ratio:
This is also a major financial performance indicating ratio in the current business world. It is
because the gearing ratio indicates the short-term and long-term business risk associated with
the company. This ratio also indicates the capital structure of a business in a particular
financial year. In the other words, it can be stated that considering the gearing ratio, the
stakeholders of a company can understand the proportion of debt capital and equity capital in
the capital structure of the business.
6 | P a g e
⊘ This is a preview!⊘
Do you want full access?
Subscribe today to unlock all pages.
Trusted by 1+ million students worldwide
If the gearing ratios of Sports Direct are considered, it can be stated that the company has
increased the proportion of debt capital in the capital structure of the business. The total debt
ratio, debt to equity ratio and equity ratio are indicating the same. Considering this fact, it can
be stated that the risk level of the business or in the capital structure has enhanced during
these two years.
If the gearing ratios of JD Sports are considered, it can be identified that the company has
also used less proportion of debt capital in its capital structure. It means the risk level
associated with the business or its capital structure was low during the financial years 2015
and 2016. At the same time, it is also noticeable that the company has reduced the proportion
of debt capital during these years. If the comparison is made with Sports Direct, it can be
stated that the both the company have near about same gearing positions during 2015 and
2016. There were bit differences between the two. Hence, it can be stated that the risk level in
the businesses was almost similar.
Profitability ratio analysis:
It is one of the most effective indicators of the financial performance of a company. While
analyzing the financial performance of a company, it is important to indicate and analyze the
profitability of the business. Profitability ratios like, gross profit ratio, net profit ratio and
operating profit ratios indicate the income level of the business at different stages. Using the
profitability ratios, the managers of the business can also understand whether the company is
effective in controlling its cost level and maintaining the revenue at standard level or it needs
improvements.
Considering the profitability position of Sports Direct, it can be mentioned that the company
has earned lower amount of profit during these two years. This financial performance is
indicating that the cost level of the business was much high during the same accounting
period. The ROA, ROE and ROEWGW are indicating that the capacity of the company to
generate more profit using the resources and assets has declined, which is indicating low
performance standard of the business.
If the profitability ratios of JD Sports are considered for the financial years 2015 and 2016, it
can be stated that the financial position of the company was not so good during these years.
The profitability ratios of the business were below the standard and the ROA, ROE and
ROEWGW are clearly indicating that the assets and equity of the company did not perform
7 | P a g e
Paraphrase This Document
Need a fresh take? Get an instant paraphrase of this document with our AI Paraphraser
better for generating revenue and income. Compared to the profitability of Sports Direct, it
can be stated that the performance of JD Sports was bit better than that of Sports Direct.
However, it must be mentioned that the indirect cost level at JD Sports was higher than that
of Sports Direct and due to that the net profit margin of the business has declined.
Investment ratio:
This ratio is the most useful financial ratio to the investors and shareholders of the business.
While making the investment decision, shareholders always consider the investment ratios,
which indicate their potential income level from that particular business. In order to maintain
a good image in the market, the management of the firms must note that the investment ratios
must be at a stable position.
Considering the investment ratio of Sports Direct, it can be stated that the financial
performance of the company has not improved much from 2015 to 2016. The P/E ratio of the
business is indicating that the satisfaction level of the shareholders did not increase much
from 2015 to 2016, which is not good for the future growth of the business.
If the investment ratio or P/E ratio of JD Sports Is considered, it can be identified that the P/E
ratio of the company was similar to that of Sports Direct and it has improved from 2015 to
2016.
Therefore, considering the financial performances of both the companies and their
comparisons, it can be stated that the performance of Sports Direct was poorer than JD
Sports.
c. Recommendations to the company
Considering the ratio analysis in the above portion, it can be stated that Sports Direct needs
some improvements in the business. Considering this fact, the management of Sports Direct
can follow the below mentioned recommendations:
Management of the company needs to focus on the control of cost level of the
business. The profitability of the company has reduced because of the higher level of
direct and indirect costs of the business. This has directly affected the performance
standards of the business in terms of profitability. Therefore, the managers of the
8 | P a g e

company must implement the system like, JIT, which will help in controlling the cost
and waste levels of the business.
The management of the company also needs to enhance the efficiency level by
focusing on the inventory management system. In this context, it can be stated that the
management may adopt better inventory management system and can use advanced
technology in this context.
The management of Sports Direct also needs to provide better training to the
employees, so that they can use the resources of the business in a better way. This will
help the company improving efficiency level and facilitate better use of resources.
d. Limitations of financial ratio analysis
Financial ratios are considered as one of the most popular tools for analyzing the financial
performance of the business houses. However, if the financial ratios of any company are
analyzed critically, it can be identified that there are several limitations of this method or tool
of financial performance analysis. Some of the major limitations of financial ratios are stated
below:
One of the major limitations of financial ratios of an organization is that the tool uses
only the past years’ financial data of the company. However, if logically analyzed, it
can be stated that the past years’ data cannot be used for understanding the present
performance standard of a business (Mitchell, 2017). At the same time, it can also be
stated that the past years data cannot be used for predicting the future performance of
the business. Hence, it can be stated that this is one of the major loopholes of financial
ratio analysis.
Another limitation of financial ratio is that the financial ratio never considers the
internal and external situations or environments of the business. However, in practical
business world, the financial performance of an organization is highly affected by the
internal and external environment of the business (Misund, 2017). For example, if the
economic situation of the country is weak, a company can never improve its financial
position because in the down economic condition, the buying capacity of the business
remains low, which negatively affect the sales level of the business. Therefore, if the
financial ratios do not consider the internal and external situations of the business, it
can never indicate or show the true performance standard of the business.
9 | P a g e
⊘ This is a preview!⊘
Do you want full access?
Subscribe today to unlock all pages.
Trusted by 1+ million students worldwide
The financial ratio analysis also does not consider the changes in the interest rate or
inflation rate. However, if the practical business scenarios or market conditions are
considered, it can be identified that changes in the inflation rate influence the interest
rate in the economy or country either positive or negatively. These changes in the
interest rate directly affect the income level or cost level of the business. If the
changes in the interest rate are positive, the cost of the company increases and income
decreases (Sun et al., 2017). On the other hand, if the interest rate decreases, the cost
of the company decreases and income increases. However, as financial ratios do not
consider these changes, the results of ratio analysis cannot be considered as accurate.
Financial ratios of the business are not calculated and analyzed by considering the
seasonal impact on the business. There are some businesses in the world that depends
on the seasons. For example, the business of woollen cloths, that increases in the
winter season (Mitchell, 2017). Due to this, the performance of the business in the
seasons other than winter remains low. However, the financial ratios fail to identify or
indicate this fact. Hence, the results of financial ratio analysis cannot be considered as
effective.
Financial ratios of a business cannot indicate the reasons behind any changes in the
financial position (Sun et al., 2017). If the financial ratio decreases, financial ratio
analysis cannot indicate the accurate or exact reason behind the same; however, the
analyst can imagine the possible reasons behind that.
Therefore, considering the above discussion, it can be stated that financial ratios are not the
effective tool for analyzing the financial performance of a business. However, it does not
mean that this is completely useless in the current business context.
10 | P a g e
Paraphrase This Document
Need a fresh take? Get an instant paraphrase of this document with our AI Paraphraser
Portfolio 2
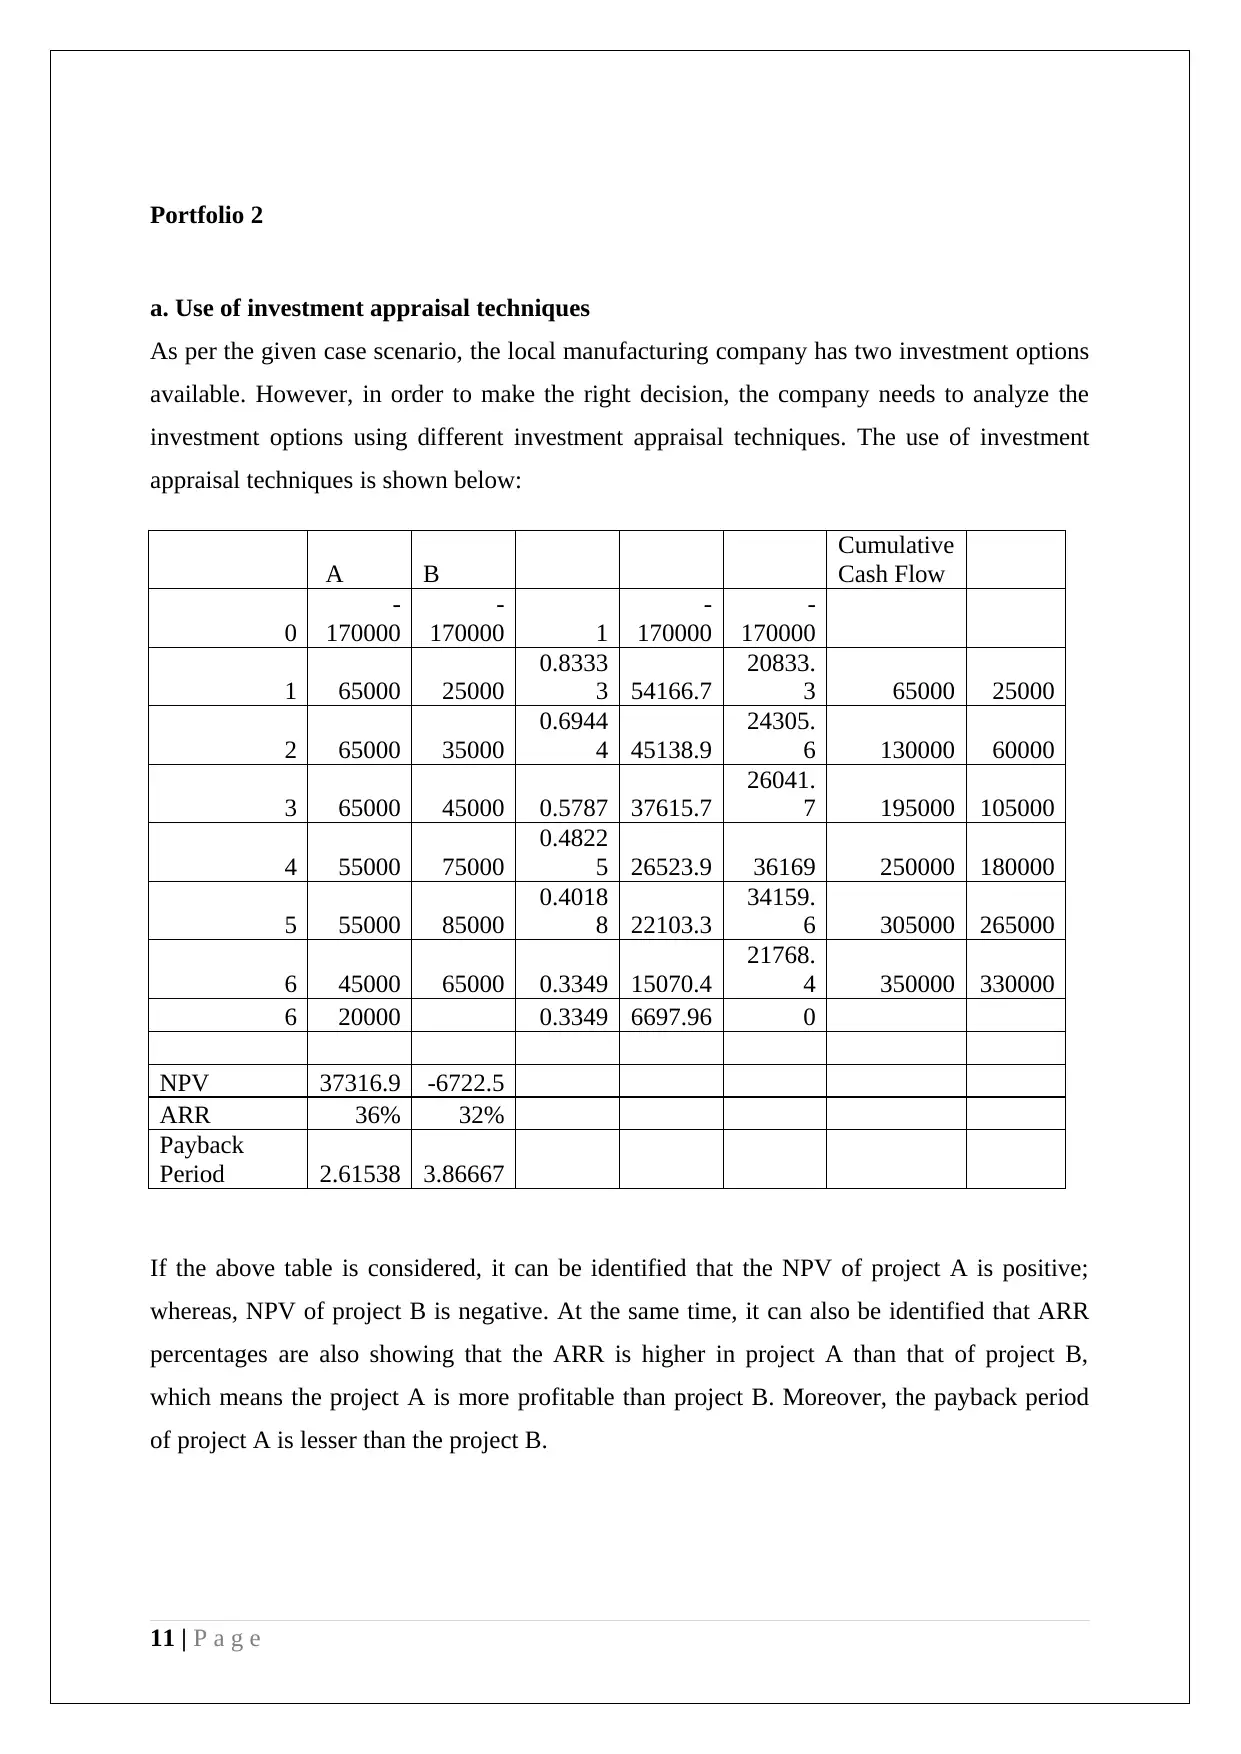
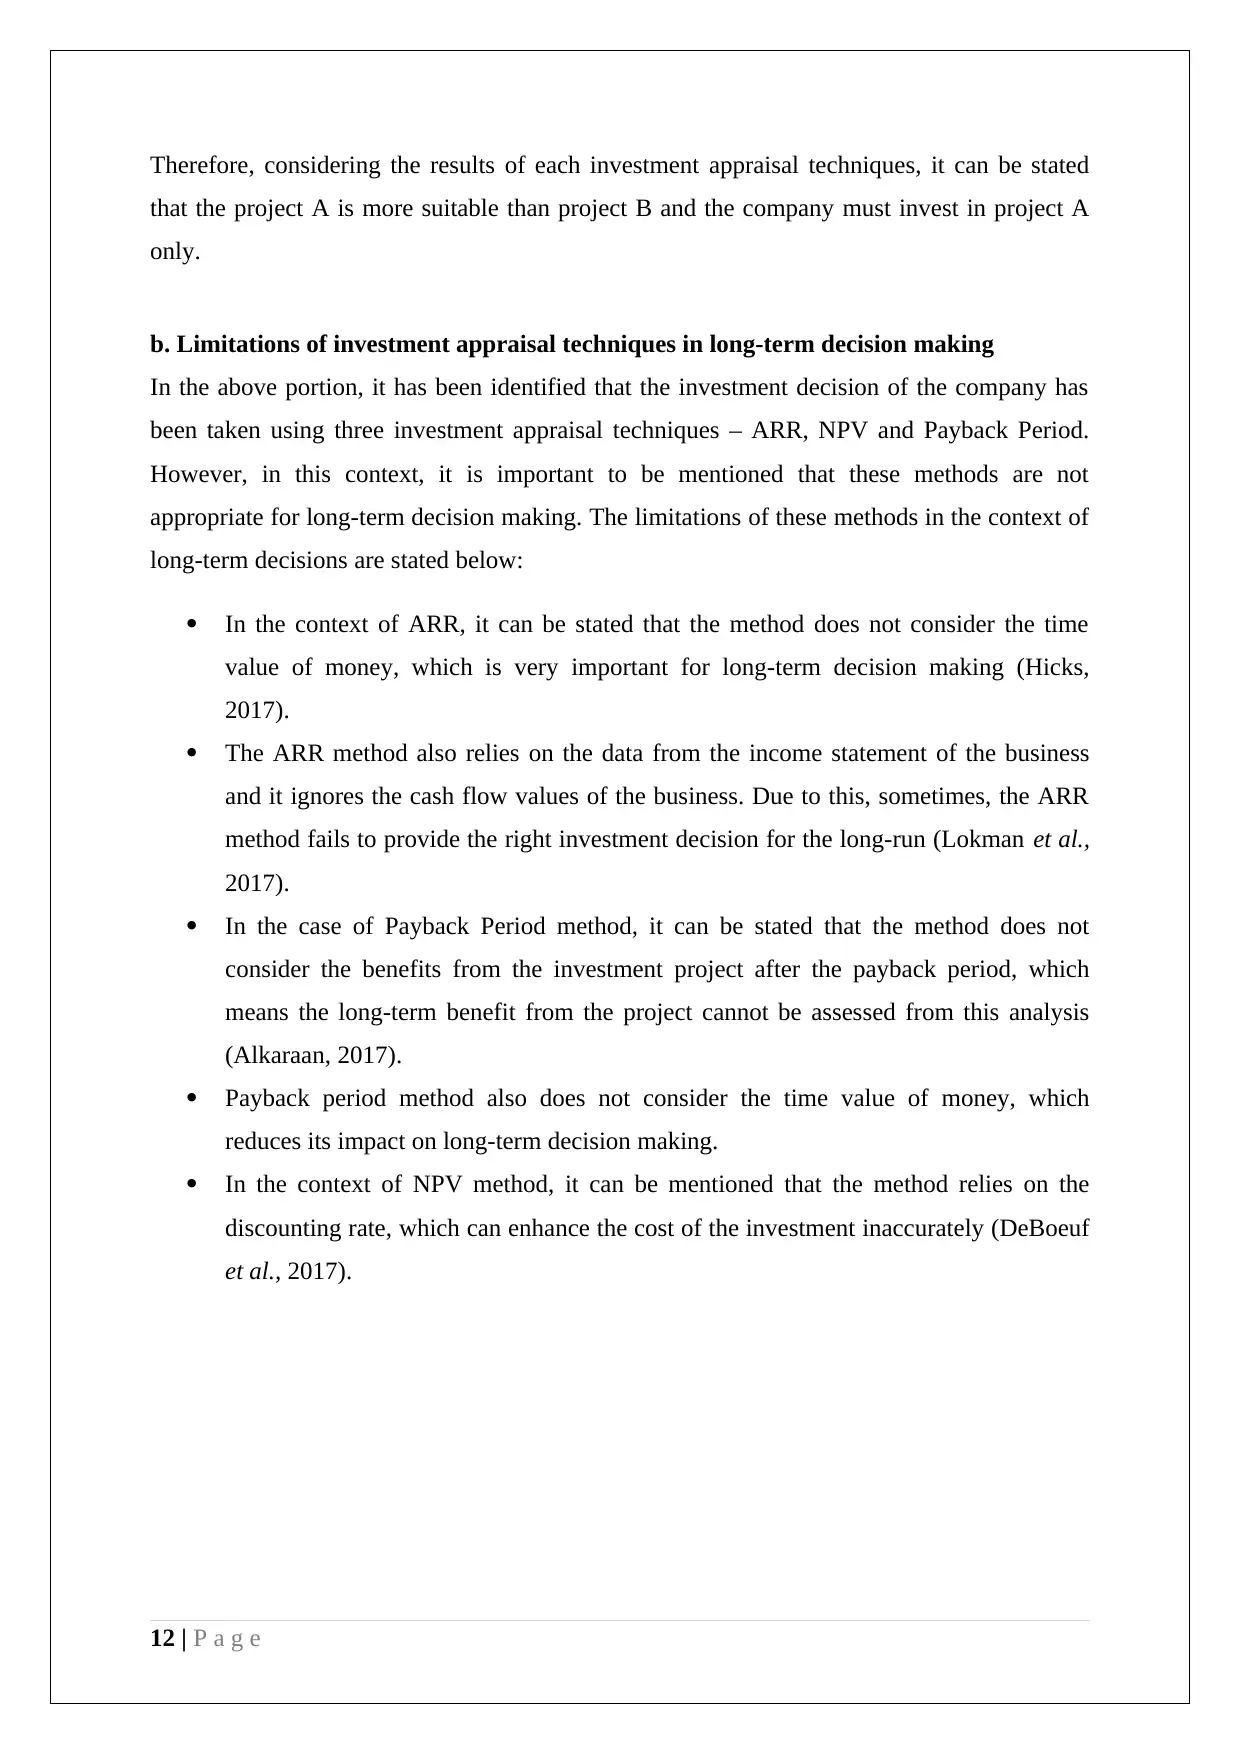
a. Use of investment appraisal techniques
As per the given case scenario, the local manufacturing company has two investment options
available. However, in order to make the right decision, the company needs to analyze the
investment options using different investment appraisal techniques. The use of investment
appraisal techniques is shown below:
A B
Cumulative
Cash Flow
0
-
170000
-
170000 1
-
170000
-
170000
1 65000 25000
0.8333
3 54166.7
20833.
3 65000 25000
2 65000 35000
0.6944
4 45138.9
24305.
6 130000 60000
3 65000 45000 0.5787 37615.7
26041.
7 195000 105000
4 55000 75000
0.4822
5 26523.9 36169 250000 180000
5 55000 85000
0.4018
8 22103.3
34159.
6 305000 265000
6 45000 65000 0.3349 15070.4
21768.
4 350000 330000
6 20000 0.3349 6697.96 0
NPV 37316.9 -6722.5
ARR 36% 32%
Payback
Period 2.61538 3.86667
If the above table is considered, it can be identified that the NPV of project A is positive;
whereas, NPV of project B is negative. At the same time, it can also be identified that ARR
percentages are also showing that the ARR is higher in project A than that of project B,
which means the project A is more profitable than project B. Moreover, the payback period
of project A is lesser than the project B.
11 | P a g e
Therefore, considering the results of each investment appraisal techniques, it can be stated
that the project A is more suitable than project B and the company must invest in project A
only.
b. Limitations of investment appraisal techniques in long-term decision making
In the above portion, it has been identified that the investment decision of the company has
been taken using three investment appraisal techniques – ARR, NPV and Payback Period.
However, in this context, it is important to be mentioned that these methods are not
appropriate for long-term decision making. The limitations of these methods in the context of
long-term decisions are stated below:
In the context of ARR, it can be stated that the method does not consider the time
value of money, which is very important for long-term decision making (Hicks,
2017).
The ARR method also relies on the data from the income statement of the business
and it ignores the cash flow values of the business. Due to this, sometimes, the ARR
method fails to provide the right investment decision for the long-run (Lokman et al.,
2017).
In the case of Payback Period method, it can be stated that the method does not
consider the benefits from the investment project after the payback period, which
means the long-term benefit from the project cannot be assessed from this analysis
(Alkaraan, 2017).
Payback period method also does not consider the time value of money, which
reduces its impact on long-term decision making.
In the context of NPV method, it can be mentioned that the method relies on the
discounting rate, which can enhance the cost of the investment inaccurately (DeBoeuf
et al., 2017).
12 | P a g e
⊘ This is a preview!⊘
Do you want full access?
Subscribe today to unlock all pages.
Trusted by 1+ million students worldwide
1 out of 13
Related Documents


Your All-in-One AI-Powered Toolkit for Academic Success.
+13062052269
info@desklib.com
Available 24*7 on WhatsApp / Email
![[object Object]](/_next/static/media/star-bottom.7253800d.svg)
Unlock your academic potential
Copyright © 2020–2025 A2Z Services. All Rights Reserved. Developed and managed by ZUCOL.