Financial Ratio Analysis for Myer Holdings Ltd
VerifiedAdded on 2023/05/28
|14
|3146
|164
AI Summary
This article provides a financial ratio analysis for Myer Holdings Ltd, including liquidity ratios, capital structure ratios, profitability ratios, and activity ratios. The analysis suggests that while the liquidity position has improved marginally, the profitability position has decreased due to falling revenue and rising costs. The article also provides recommendations for improving the company's financial position.
Contribute Materials
Your contribution can guide someone’s learning journey. Share your
documents today.
Running head: FINANCING ENTERPRISES
Financing Enterprises
Name of the Student:
Name of the University:
Author’s Note:
Financing Enterprises
Name of the Student:
Name of the University:
Author’s Note:
Secure Best Marks with AI Grader
Need help grading? Try our AI Grader for instant feedback on your assignments.
Table of Contents
In Response to Question 1...............................................................................................................5
In Response to Question 2...............................................................................................................6
In Response to Question 3...............................................................................................................7
In Response to Question 4...............................................................................................................8
In Response to Question 5...............................................................................................................9
Reference.......................................................................................................................................10
Appendix........................................................................................................................................12
.......................................................................................................................................................12
In Response to Question 1
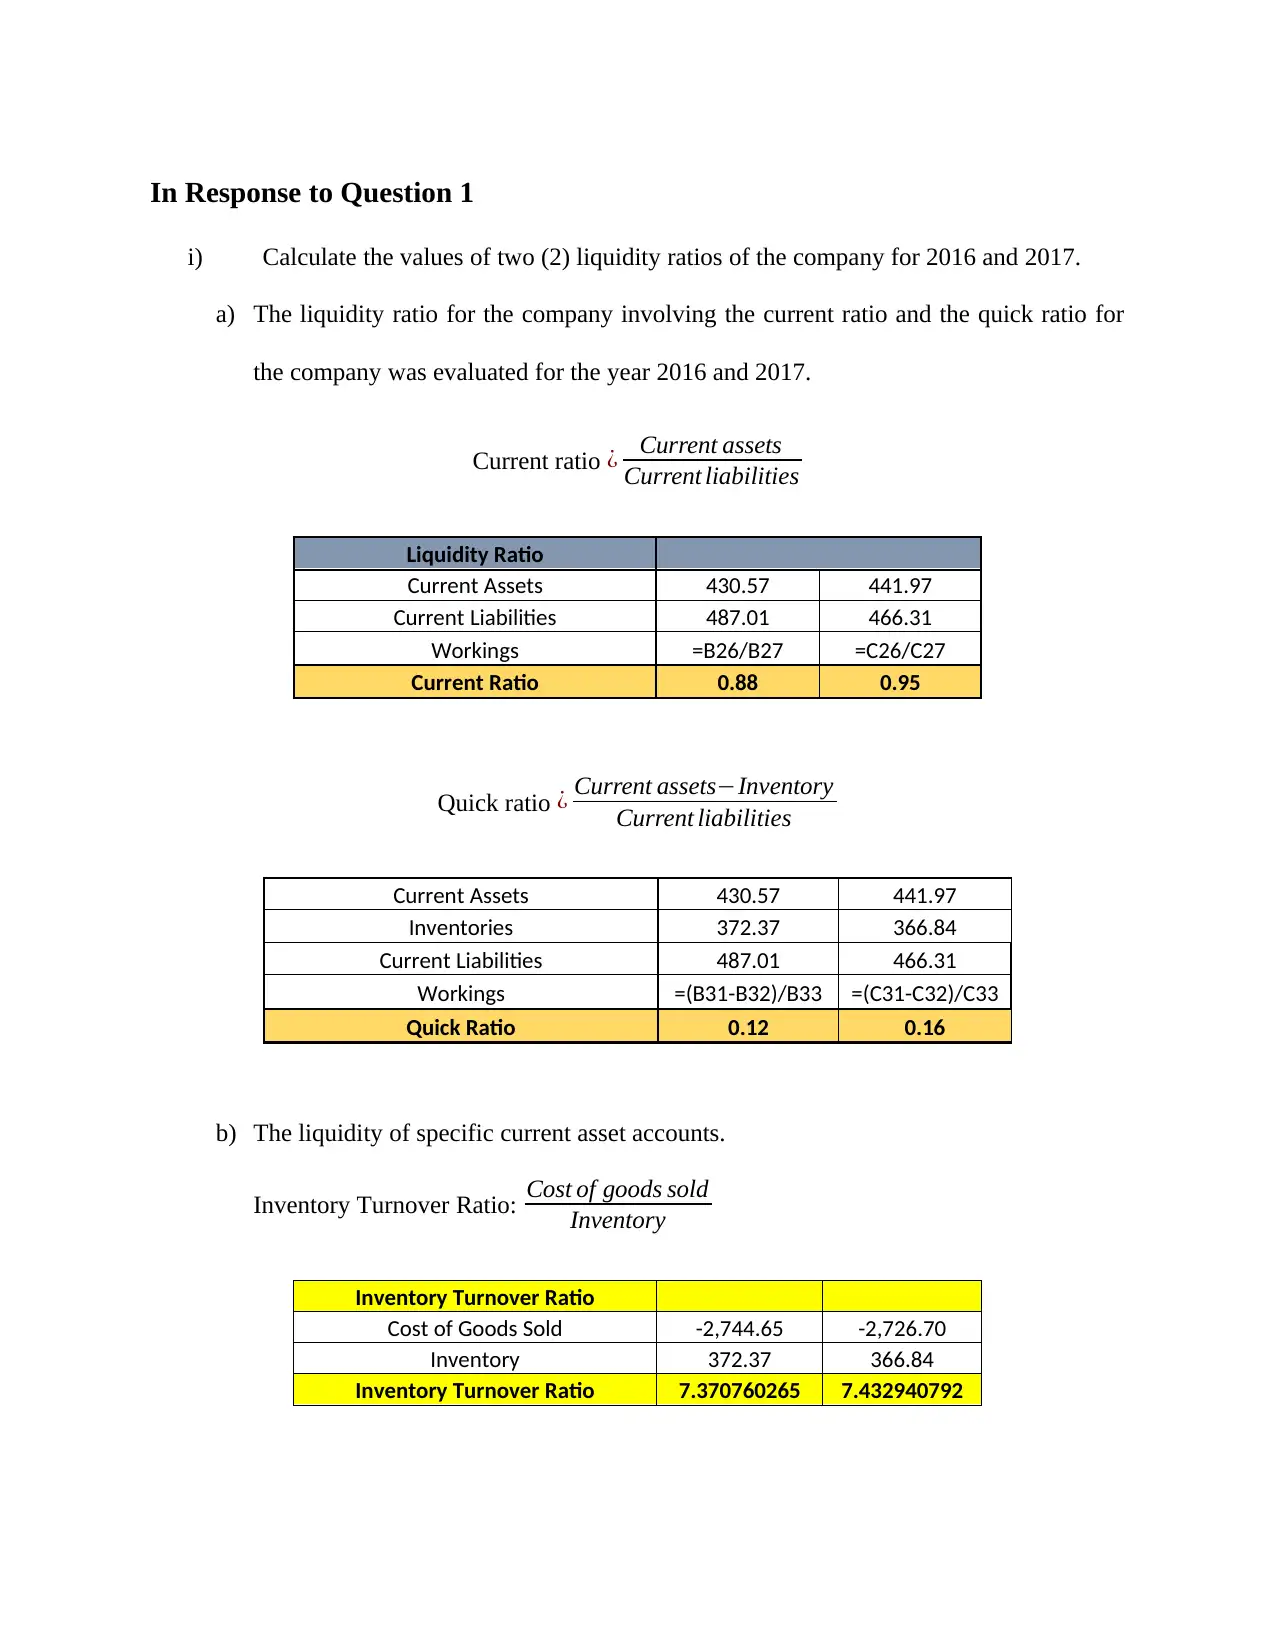
i) Calculate the values of two (2) liquidity ratios of the company for 2016 and 2017.
a) The liquidity ratio for the company involving the current ratio and the quick ratio for
the company was evaluated for the year 2016 and 2017.
Current ratio ¿ Current assets
Current liabilities
Liquidity Ratio
Current Assets 430.57 441.97
Current Liabilities 487.01 466.31
Workings =B26/B27 =C26/C27
Current Ratio 0.88 0.95
Quick ratio ¿ Current assets−Inventory
Current liabilities
Current Assets 430.57 441.97
Inventories 372.37 366.84
Current Liabilities 487.01 466.31
Workings =(B31-B32)/B33 =(C31-C32)/C33
Quick Ratio 0.12 0.16
b) The liquidity of specific current asset accounts.
Inventory Turnover Ratio: Cost of goods sold
Inventory
Inventory Turnover Ratio
Cost of Goods Sold -2,744.65 -2,726.70
Inventory 372.37 366.84
Inventory Turnover Ratio 7.370760265 7.432940792
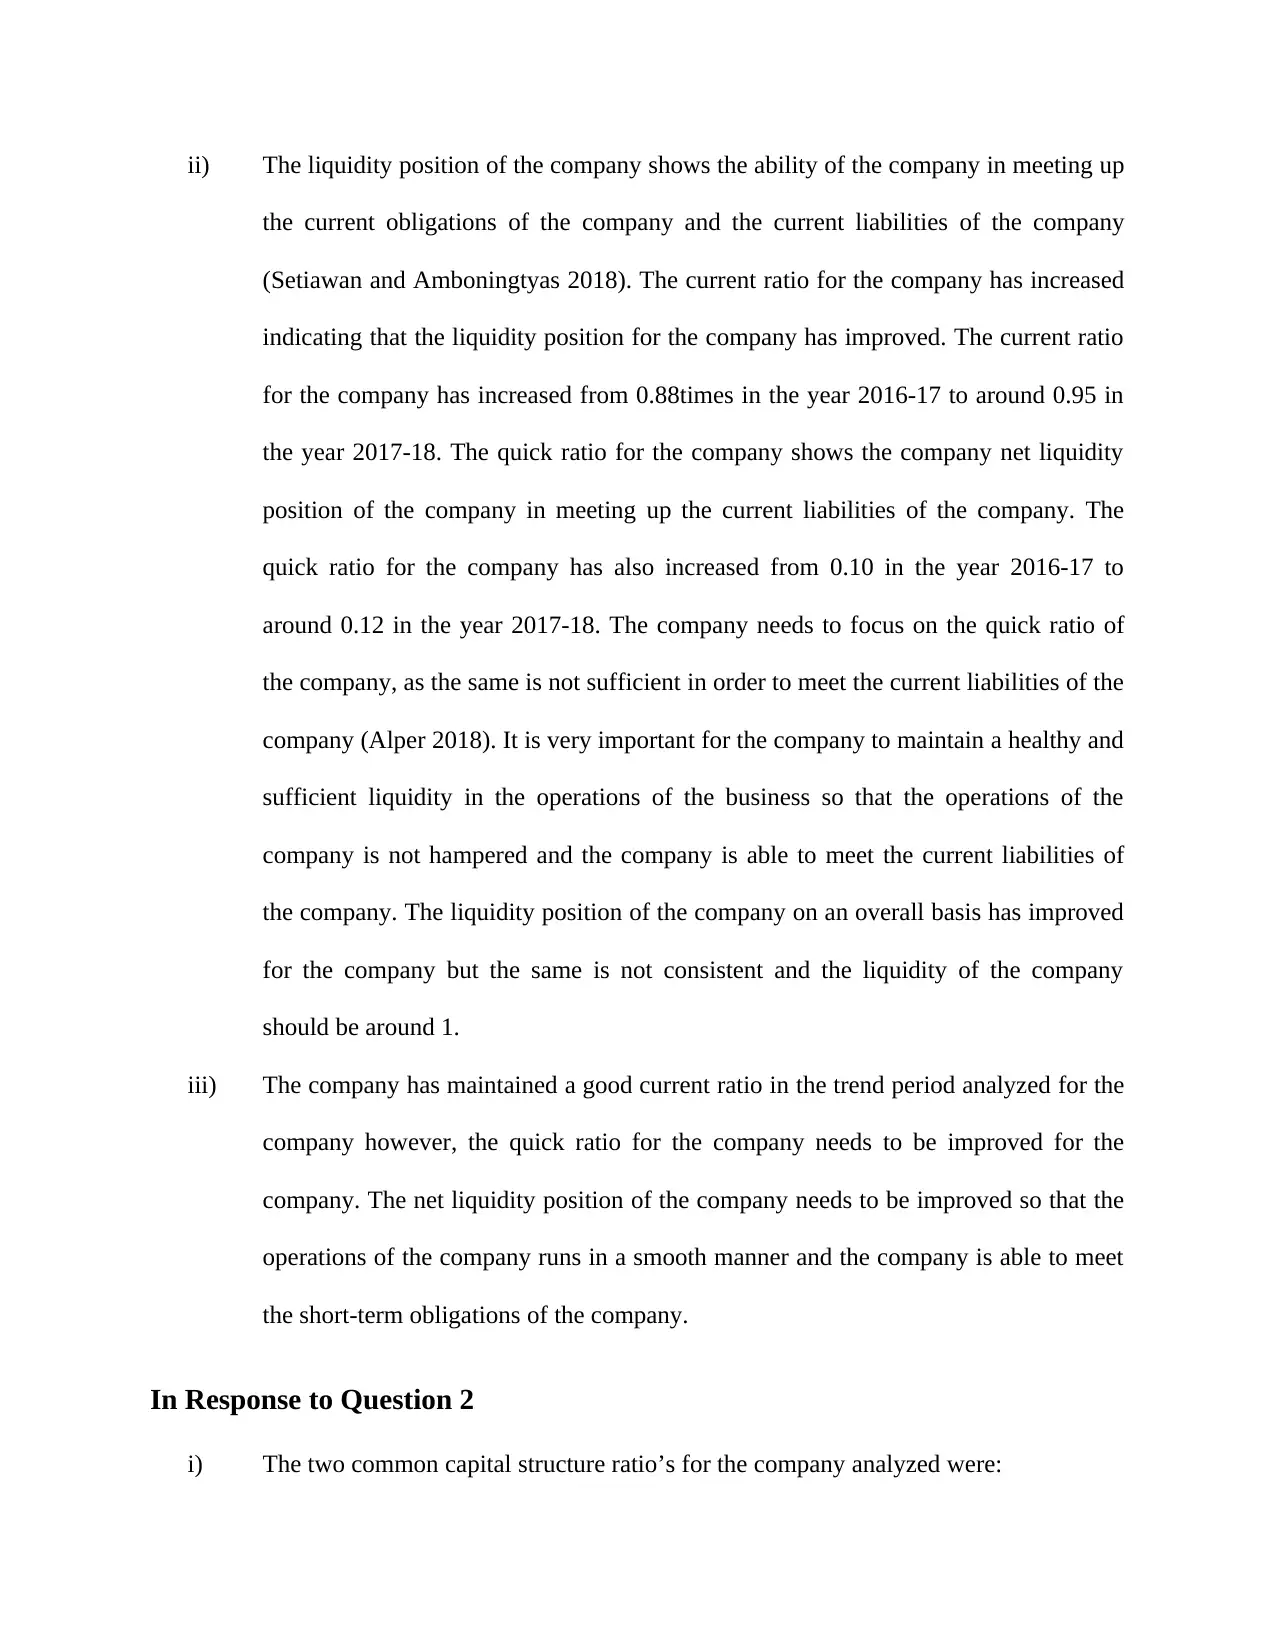
ii) The liquidity position of the company shows the ability of the company in meeting up
the current obligations of the company and the current liabilities of the company
(Setiawan and Amboningtyas 2018). The current ratio for the company has increased
indicating that the liquidity position for the company has improved. The current ratio
for the company has increased from 0.88times in the year 2016-17 to around 0.95 in
the year 2017-18. The quick ratio for the company shows the company net liquidity
position of the company in meeting up the current liabilities of the company. The
quick ratio for the company has also increased from 0.10 in the year 2016-17 to
around 0.12 in the year 2017-18. The company needs to focus on the quick ratio of
the company, as the same is not sufficient in order to meet the current liabilities of the
company (Alper 2018). It is very important for the company to maintain a healthy and
sufficient liquidity in the operations of the business so that the operations of the
company is not hampered and the company is able to meet the current liabilities of
the company. The liquidity position of the company on an overall basis has improved
for the company but the same is not consistent and the liquidity of the company
should be around 1.
iii) The company has maintained a good current ratio in the trend period analyzed for the
company however, the quick ratio for the company needs to be improved for the
company. The net liquidity position of the company needs to be improved so that the
operations of the company runs in a smooth manner and the company is able to meet
the short-term obligations of the company.
In Response to Question 2
i) The two common capital structure ratio’s for the company analyzed were:
Secure Best Marks with AI Grader
Need help grading? Try our AI Grader for instant feedback on your assignments.
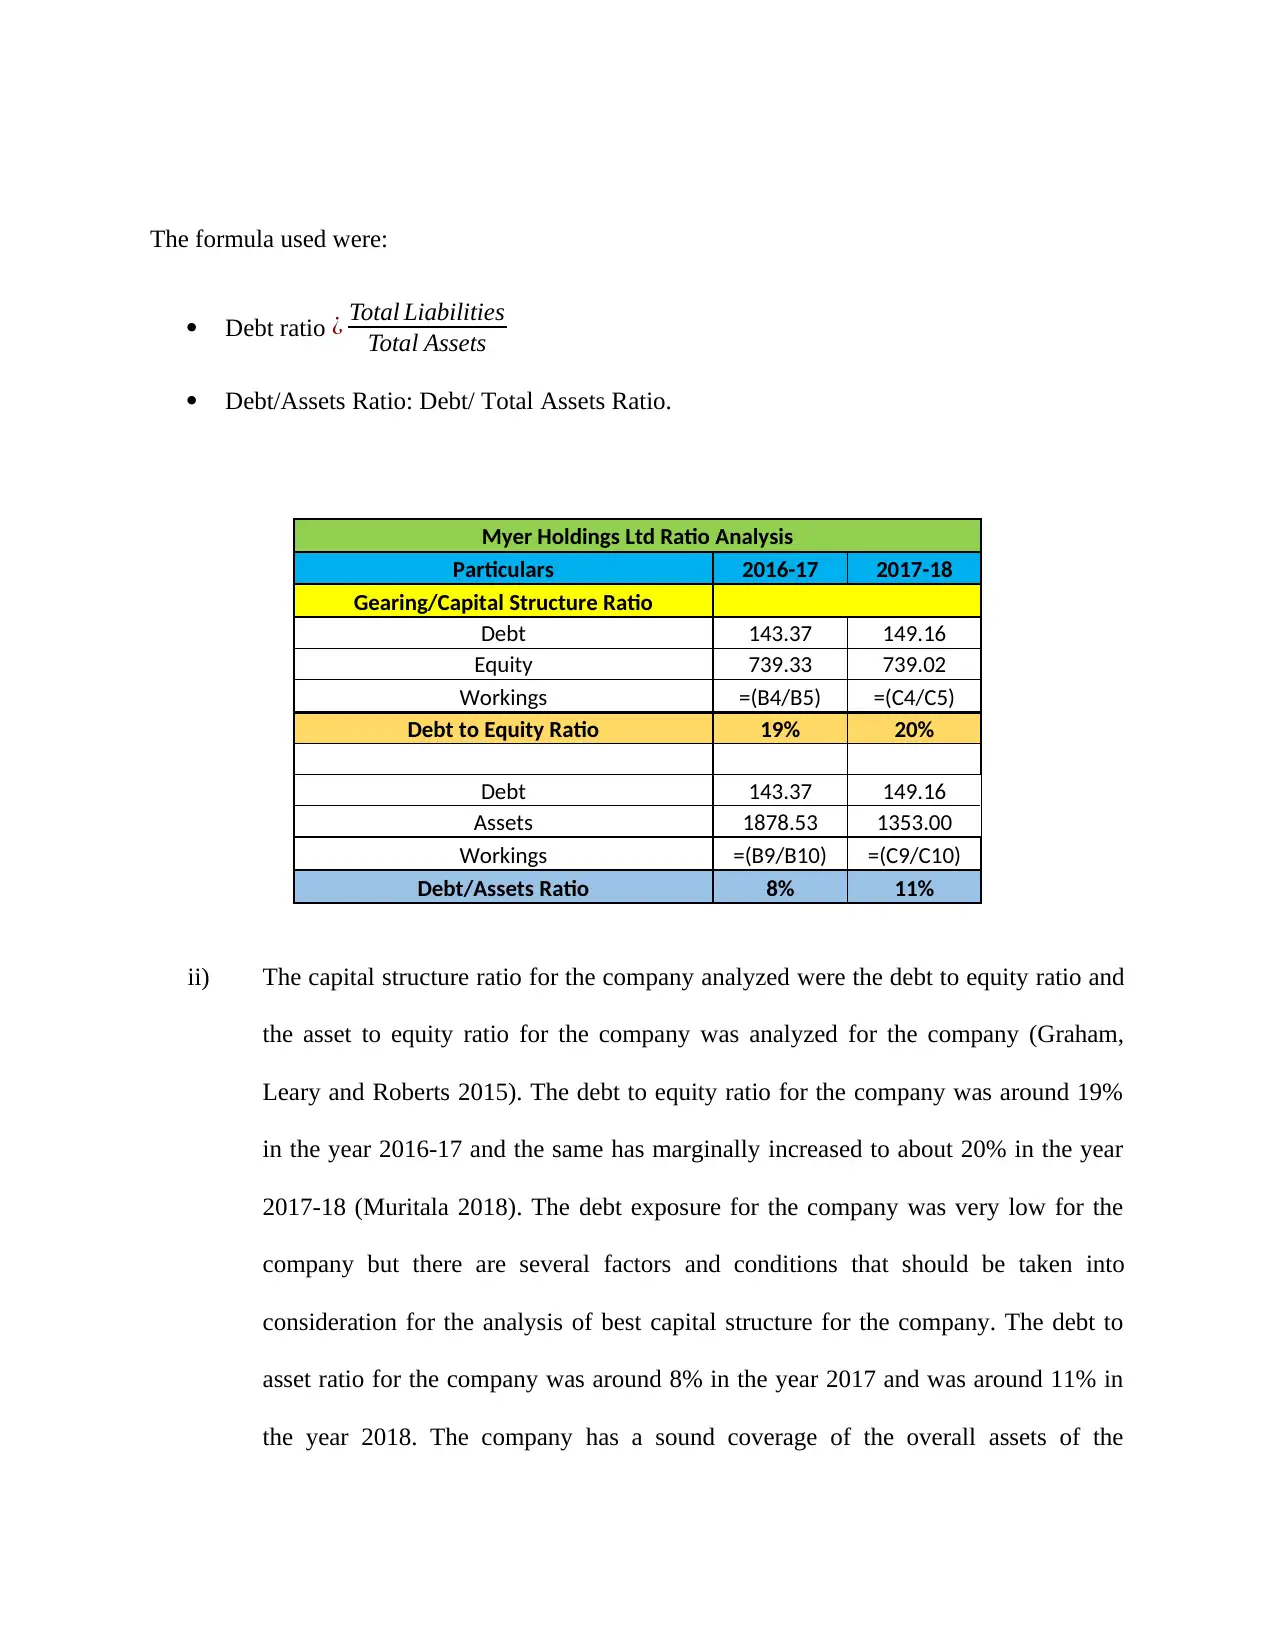
The formula used were:
Debt ratio ¿ Total Liabilities
Total Assets
Debt/Assets Ratio: Debt/ Total Assets Ratio.
Myer Holdings Ltd Ratio Analysis
Particulars 2016-17 2017-18
Gearing/Capital Structure Ratio
Debt 143.37 149.16
Equity 739.33 739.02
Workings =(B4/B5) =(C4/C5)
Debt to Equity Ratio 19% 20%
Debt 143.37 149.16
Assets 1878.53 1353.00
Workings =(B9/B10) =(C9/C10)
Debt/Assets Ratio 8% 11%
ii) The capital structure ratio for the company analyzed were the debt to equity ratio and
the asset to equity ratio for the company was analyzed for the company (Graham,
Leary and Roberts 2015). The debt to equity ratio for the company was around 19%
in the year 2016-17 and the same has marginally increased to about 20% in the year
2017-18 (Muritala 2018). The debt exposure for the company was very low for the
company but there are several factors and conditions that should be taken into
consideration for the analysis of best capital structure for the company. The debt to
asset ratio for the company was around 8% in the year 2017 and was around 11% in
the year 2018. The company has a sound coverage of the overall assets of the
company in comparison to the equity level of the company. The assets of the
company in comparison to the equity of the company has been stable and at sufficient
level. The overall financial risk of the company as assessed was very low with low
level of debt in the financials of the company (Klasa et al. 2018). The company
should analyze various aspect of effect of debt on the company and the benefit the
company is getting by taking exposure in the form of tax savings for the company.
In Response to Question 3
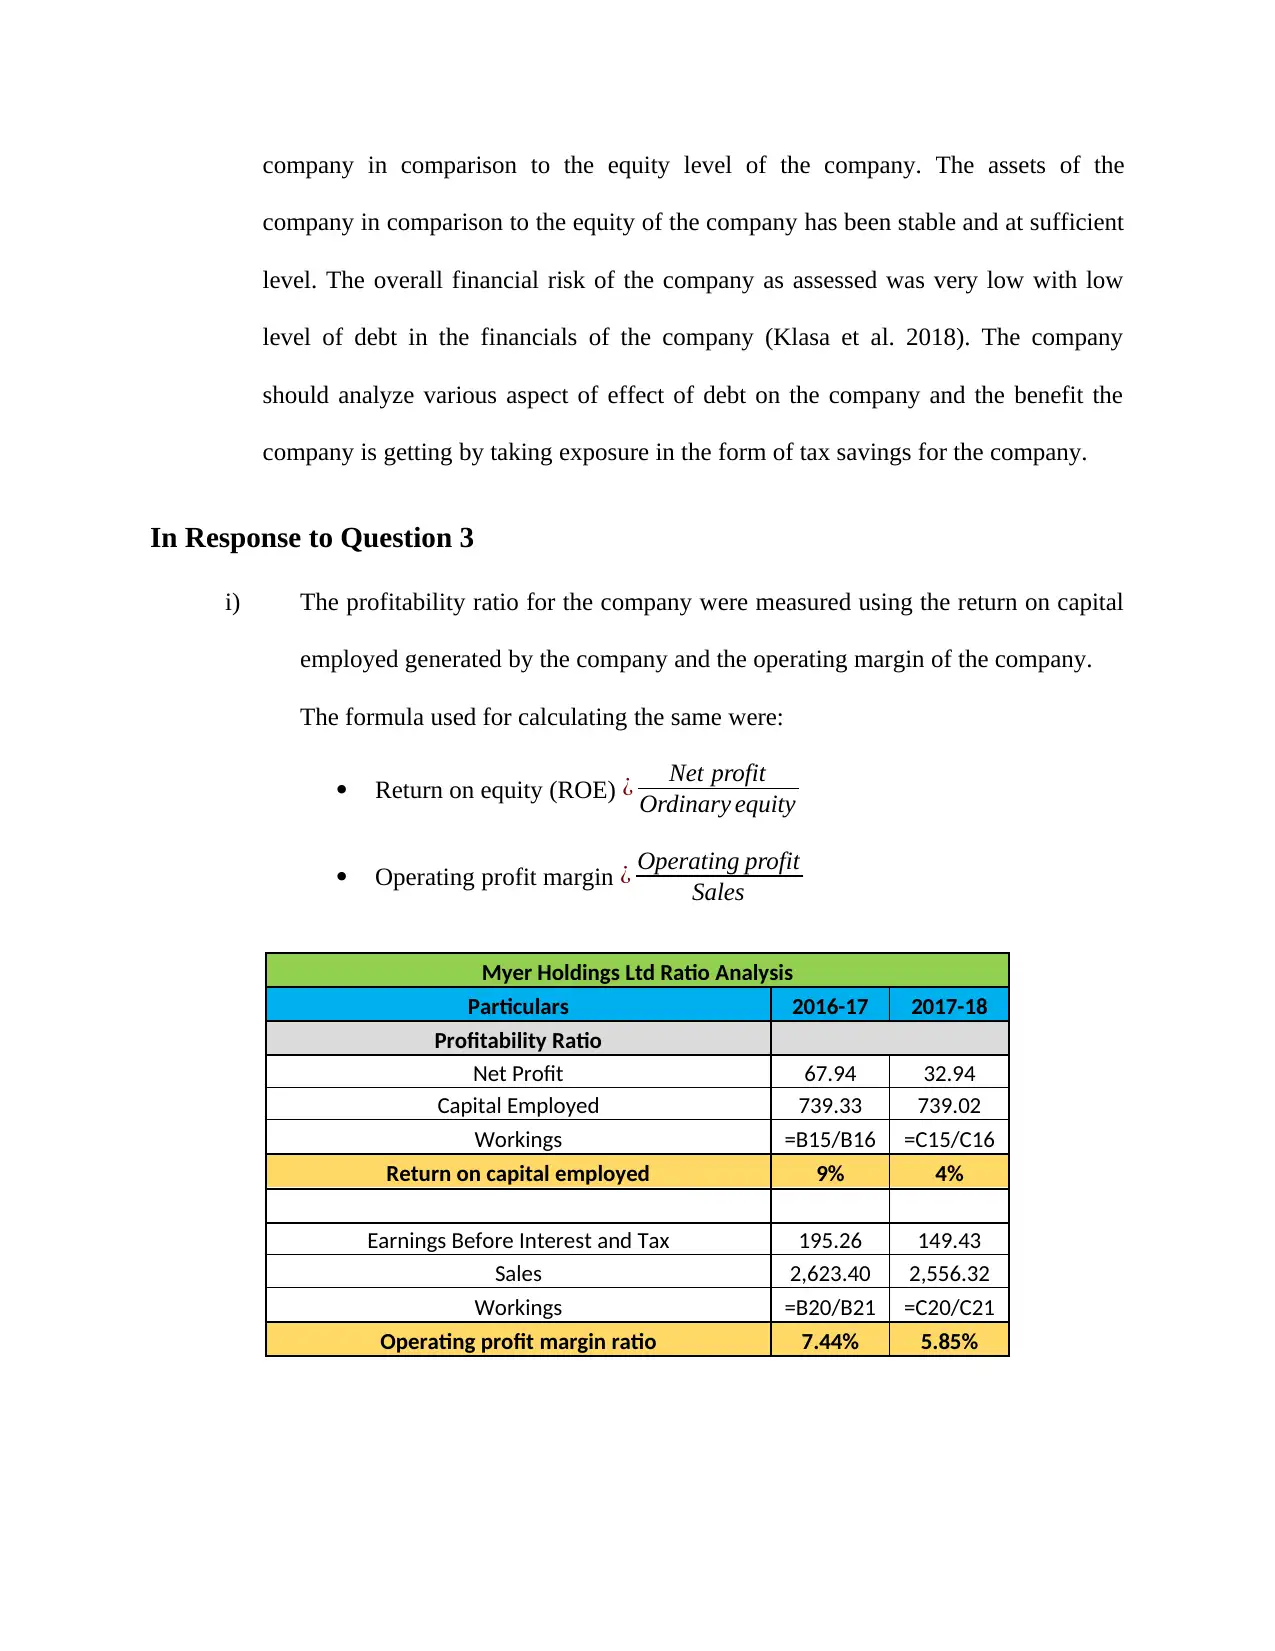
i) The profitability ratio for the company were measured using the return on capital
employed generated by the company and the operating margin of the company.
The formula used for calculating the same were:
Return on equity (ROE) ¿ Net profit
Ordinary equity
Operating profit margin ¿ Operating profit
Sales
Myer Holdings Ltd Ratio Analysis
Particulars 2016-17 2017-18
Profitability Ratio
Net Profit 67.94 32.94
Capital Employed 739.33 739.02
Workings =B15/B16 =C15/C16
Return on capital employed 9% 4%
Earnings Before Interest and Tax 195.26 149.43
Sales 2,623.40 2,556.32
Workings =B20/B21 =C20/C21
Operating profit margin ratio 7.44% 5.85%
company in comparison to the equity of the company has been stable and at sufficient
level. The overall financial risk of the company as assessed was very low with low
level of debt in the financials of the company (Klasa et al. 2018). The company
should analyze various aspect of effect of debt on the company and the benefit the
company is getting by taking exposure in the form of tax savings for the company.
In Response to Question 3
i) The profitability ratio for the company were measured using the return on capital
employed generated by the company and the operating margin of the company.
The formula used for calculating the same were:
Return on equity (ROE) ¿ Net profit
Ordinary equity
Operating profit margin ¿ Operating profit
Sales
Myer Holdings Ltd Ratio Analysis
Particulars 2016-17 2017-18
Profitability Ratio
Net Profit 67.94 32.94
Capital Employed 739.33 739.02
Workings =B15/B16 =C15/C16
Return on capital employed 9% 4%
Earnings Before Interest and Tax 195.26 149.43
Sales 2,623.40 2,556.32
Workings =B20/B21 =C20/C21
Operating profit margin ratio 7.44% 5.85%
ii) The return on capital employed for the company shows the return generated by
the company on the capital employed by the shareholders of the company. The
ROCE for the company has fallen by more than 50% in the trend period analyzed
for the company indicating that the company might not be creating value for the
shareholders of the company. The net profitability for the company has fallen in
the trend period analyzed for the company and the same has been due to the rising
expenses for the company in the form of operating expenses and depreciation
expenses for the company (Parsian and Shams Koloukhi 2014). The return on
capital employed for the company was around 9% in the year 2016-17 and was
around 4% in the year 2017-18. The falling return was because of the rising costs
for the company and the falling revenue of the company. The operating margin
for the company was evaluated by using the Earning before tax, depreciation and
tax and the net sales of the company (Ogiela and Ogiela 2014). The operating
margin of the company was around 7.44% in the year 2016-17 and was around
5.85% in the year 2017-18. The operating margin decreased due to falling revenue
of the company and the rising costs and expenses for the company.
iii) The key recommendation that would be recommended is that the company should
reduce the operating expenses of the company and increasing the revenue of the
company. The reduction in the expenses of the company will help the company
grow its profitability and maintain an overall growth of the company in the long-
term.
Paraphrase This Document
Need a fresh take? Get an instant paraphrase of this document with our AI Paraphraser
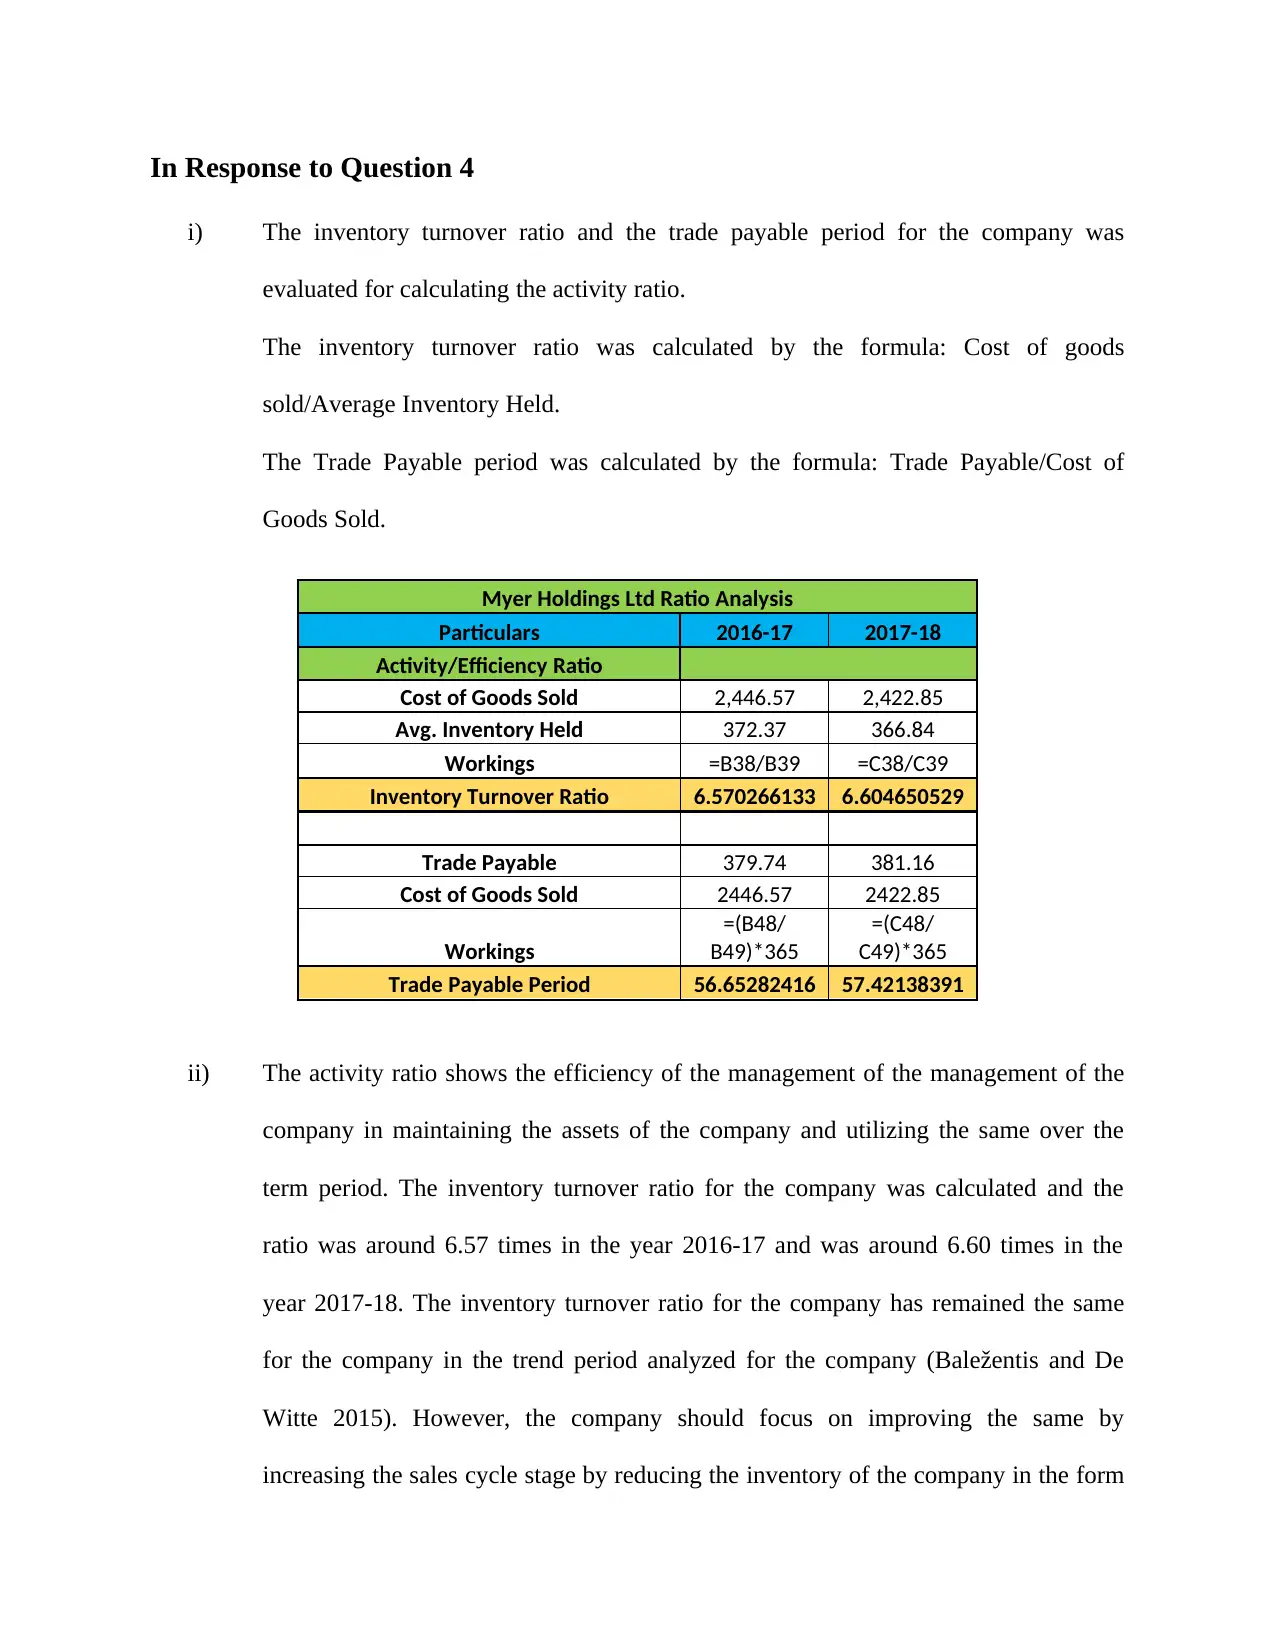
In Response to Question 4
i) The inventory turnover ratio and the trade payable period for the company was
evaluated for calculating the activity ratio.
The inventory turnover ratio was calculated by the formula: Cost of goods
sold/Average Inventory Held.
The Trade Payable period was calculated by the formula: Trade Payable/Cost of
Goods Sold.
Myer Holdings Ltd Ratio Analysis
Particulars 2016-17 2017-18
Activity/Efficiency Ratio
Cost of Goods Sold 2,446.57 2,422.85
Avg. Inventory Held 372.37 366.84
Workings =B38/B39 =C38/C39
Inventory Turnover Ratio 6.570266133 6.604650529
Trade Payable 379.74 381.16
Cost of Goods Sold 2446.57 2422.85
Workings
=(B48/
B49)*365
=(C48/
C49)*365
Trade Payable Period 56.65282416 57.42138391
ii) The activity ratio shows the efficiency of the management of the management of the
company in maintaining the assets of the company and utilizing the same over the
term period. The inventory turnover ratio for the company was calculated and the
ratio was around 6.57 times in the year 2016-17 and was around 6.60 times in the
year 2017-18. The inventory turnover ratio for the company has remained the same
for the company in the trend period analyzed for the company (Baležentis and De
Witte 2015). However, the company should focus on improving the same by
increasing the sales cycle stage by reducing the inventory of the company in the form
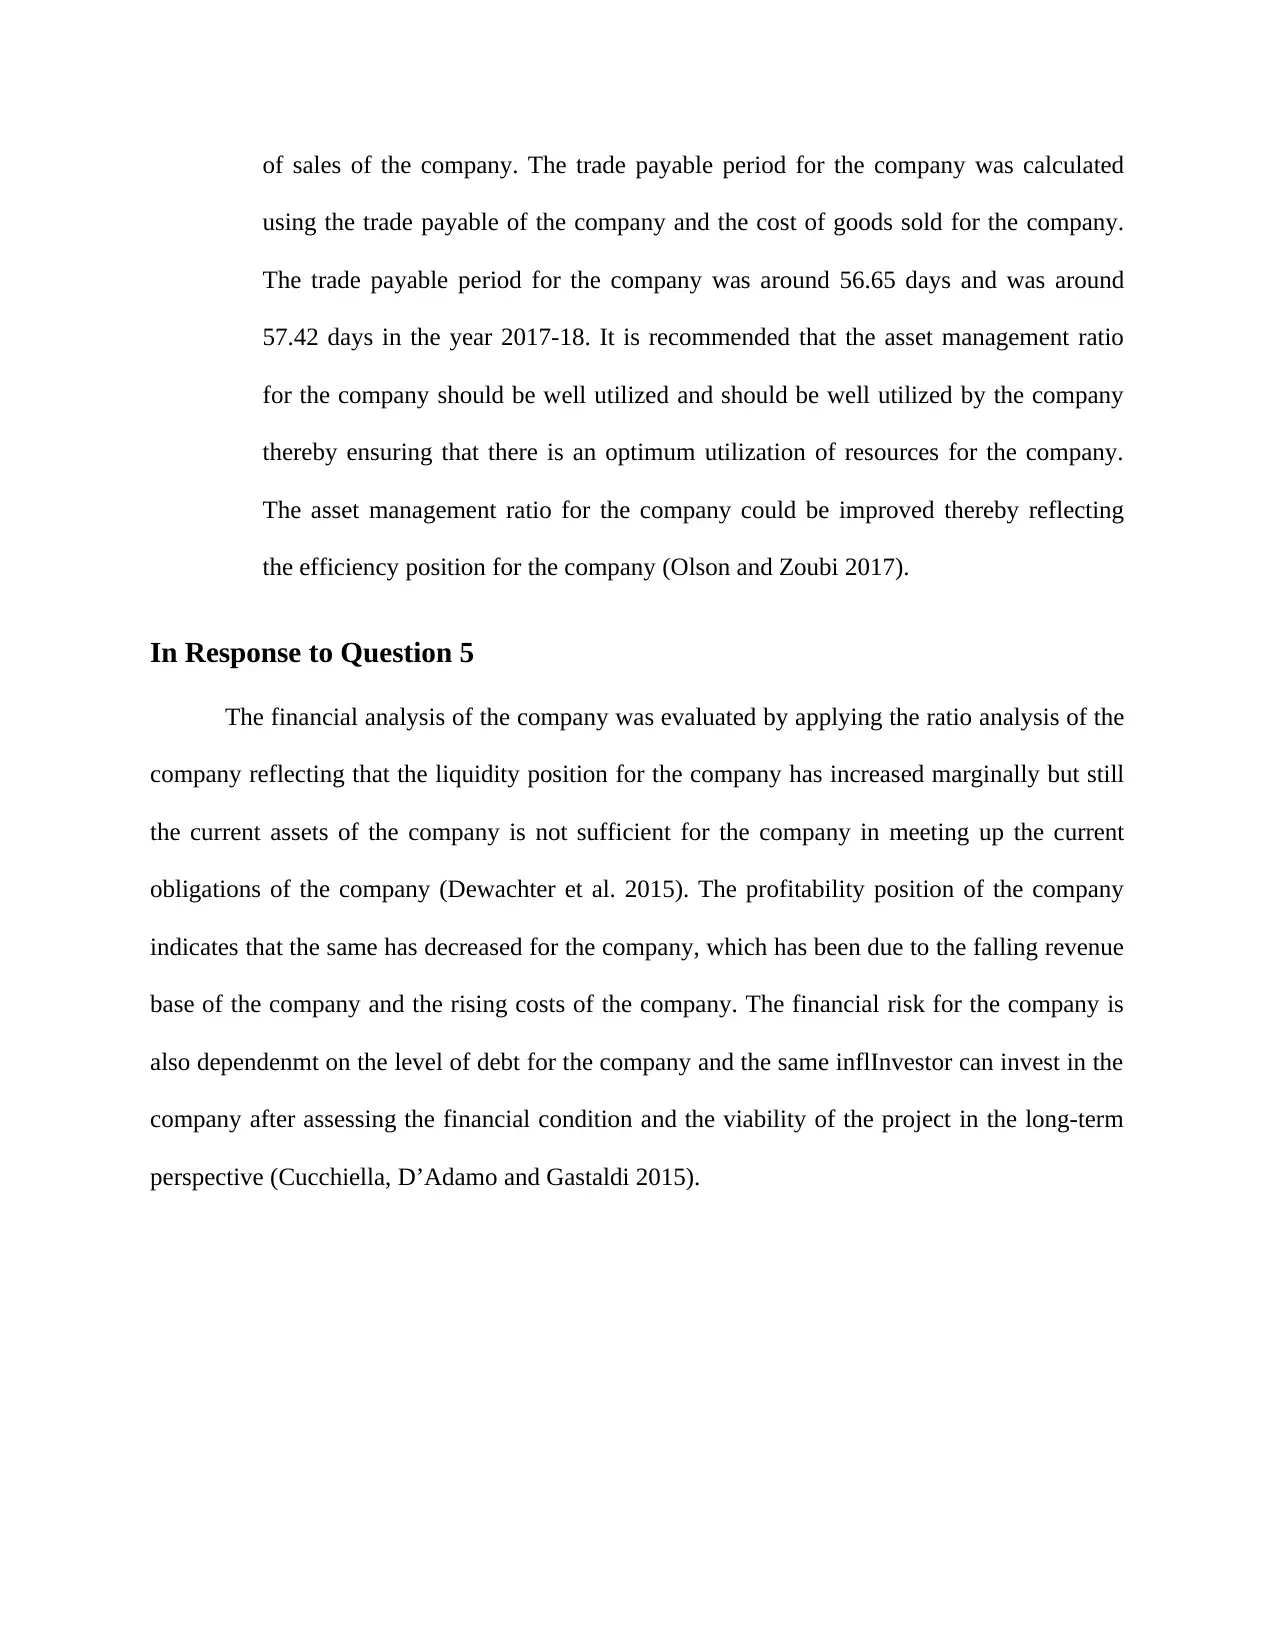
of sales of the company. The trade payable period for the company was calculated
using the trade payable of the company and the cost of goods sold for the company.
The trade payable period for the company was around 56.65 days and was around
57.42 days in the year 2017-18. It is recommended that the asset management ratio
for the company should be well utilized and should be well utilized by the company
thereby ensuring that there is an optimum utilization of resources for the company.
The asset management ratio for the company could be improved thereby reflecting
the efficiency position for the company (Olson and Zoubi 2017).
In Response to Question 5
The financial analysis of the company was evaluated by applying the ratio analysis of the
company reflecting that the liquidity position for the company has increased marginally but still
the current assets of the company is not sufficient for the company in meeting up the current
obligations of the company (Dewachter et al. 2015). The profitability position of the company
indicates that the same has decreased for the company, which has been due to the falling revenue
base of the company and the rising costs of the company. The financial risk for the company is
also dependenmt on the level of debt for the company and the same inflInvestor can invest in the
company after assessing the financial condition and the viability of the project in the long-term
perspective (Cucchiella, D’Adamo and Gastaldi 2015).
Reference
Alper, K., Binici, M., Demiralp, S., Kara, H. and ÖZLÜ, P., 2018. Reserve requirements,
liquidity risk, and bank lending behavior. Journal of Money, Credit and Banking, vol.50 no.(4),
pp.817-827
Baležentis, T. and De Witte, K., 2015. One-and multi-directional conditional efficiency
measurement–Efficiency in Lithuanian family farms. European Journal of Operational
Research, vol.245 no.(2), pp.612-622.
Cucchiella, F., D’Adamo, I. and Gastaldi, M., 2015. Financial analysis for investment and policy
decisions in the renewable energy sector. Clean Technologies and Environmental Policy, vol.17
no.(4), pp.887-904.
Dewachter, H., Iania, L., Lyrio, M. and de Sola Perea, M., 2015. A macro-financial analysis of
the euro area sovereign bond market. Journal of Banking & Finance, vol.50, pp.308-325.
Graham, J.R., Leary, M.T. and Roberts, M.R., 2015. A century of capital structure: The
leveraging of corporate America. Journal of Financial Economics, vol.118 no.(3), pp.658-683.
Klasa, S., Ortiz-Molina, H., Serfling, M. and Srinivasan, S., 2018. Protection of trade secrets and
capital structure decisions. Journal of Financial Economics, vol.128 no.(2), pp.266-286.
Olson, D. and Zoubi, T., 2017. Convergence in bank performance for commercial and Islamic
banks during and after the Global Financial Crisis. The Quarterly Review of Economics and
Finance, vol.65, pp.71-87.
Parsian, H. and Shams Koloukhi, A., 2014. A study on the effect of free cash flow and
profitability current ratio on dividend payout ratio: Evidence from Tehran Stock Exchange.
Management Science Letters, vol. 4, pp.63-70.
Setiawan, H. and Amboningtyas, D., 2018. FINANCIAL RATIO ANALYSIS FOR
PREDICTING FINANCIAL DISTRESS CONDITIONS (Study on Telecommunication
Companies Listed In Indonesia Stock Exchange Period 2010-2016). Journal of Management,
vol.4 no.(4).
Secure Best Marks with AI Grader
Need help grading? Try our AI Grader for instant feedback on your assignments.
Appendix
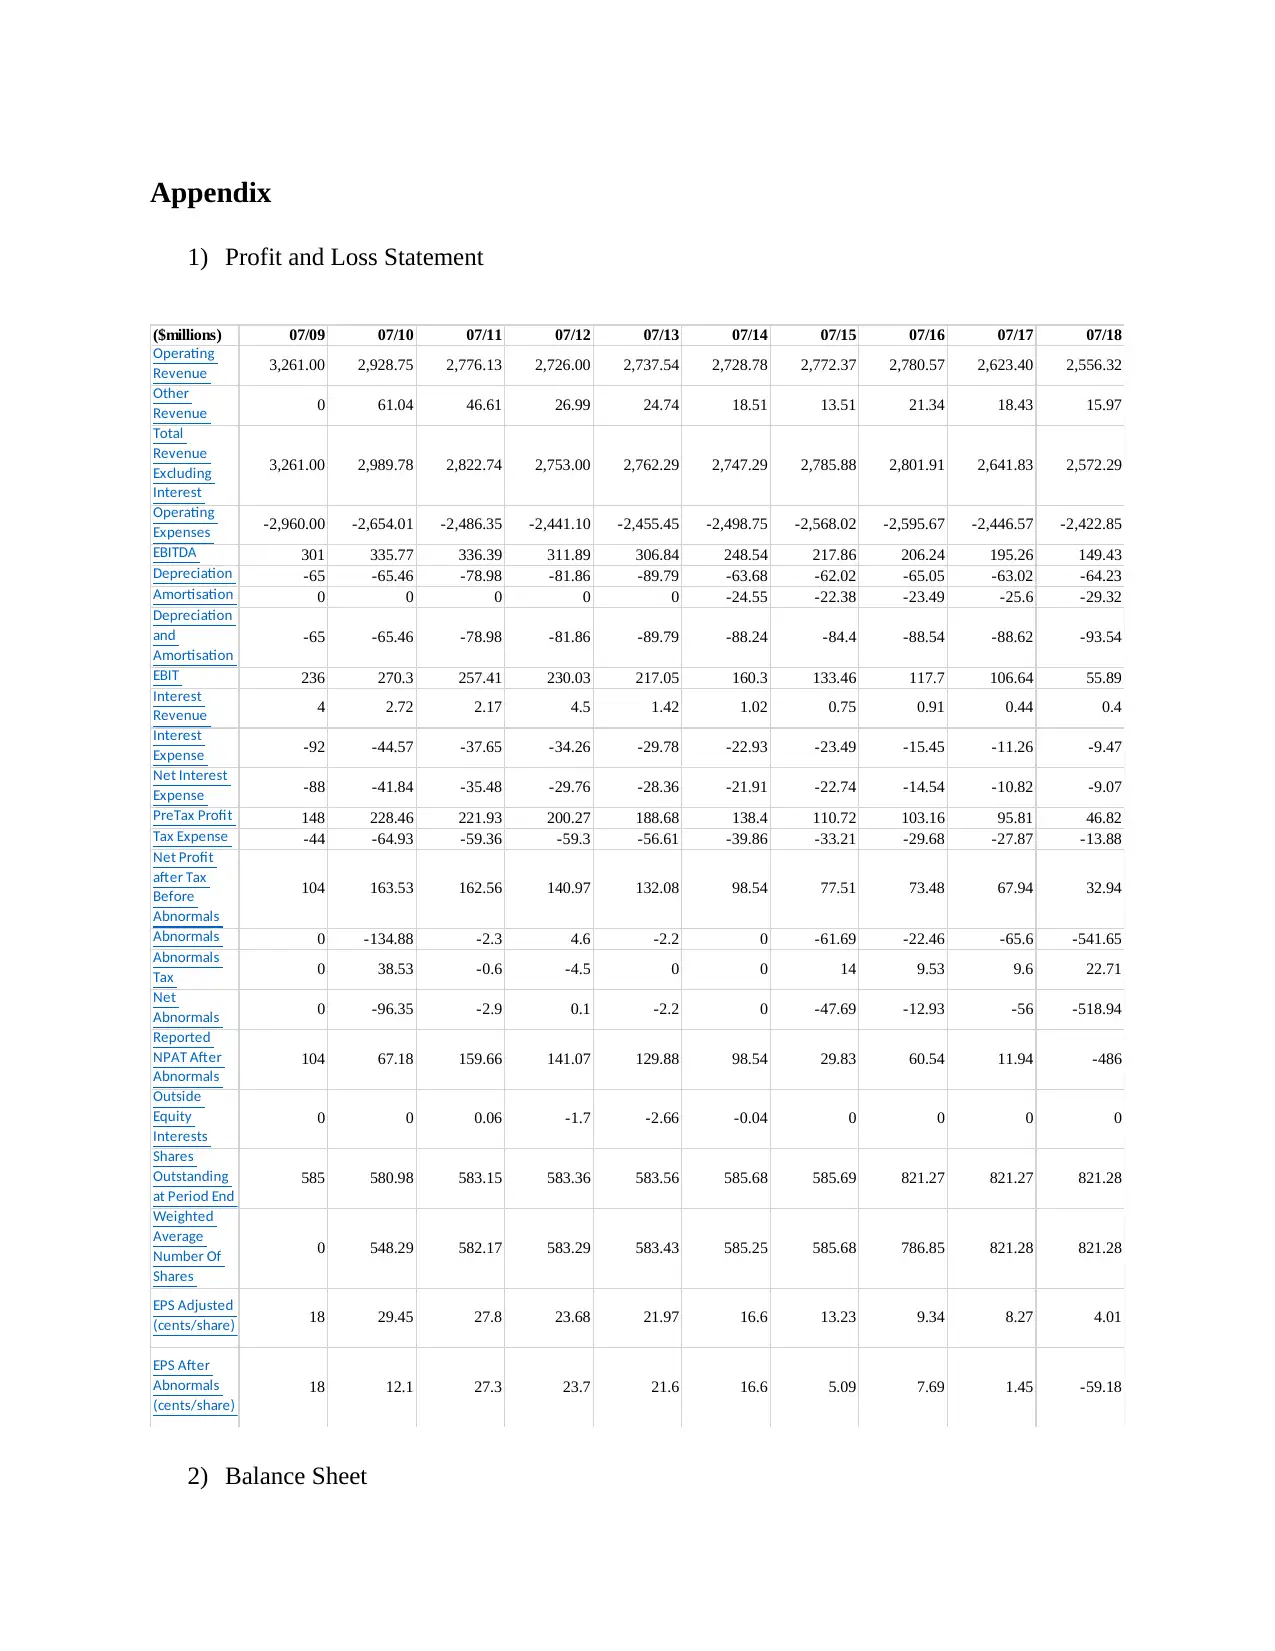
1) Profit and Loss Statement
($millions) 07/09 07/10 07/11 07/12 07/13 07/14 07/15 07/16 07/17 07/18
Operating
Revenue 3,261.00 2,928.75 2,776.13 2,726.00 2,737.54 2,728.78 2,772.37 2,780.57 2,623.40 2,556.32
Other
Revenue 0 61.04 46.61 26.99 24.74 18.51 13.51 21.34 18.43 15.97
Total
Revenue
Excluding
Interest
3,261.00 2,989.78 2,822.74 2,753.00 2,762.29 2,747.29 2,785.88 2,801.91 2,641.83 2,572.29
Operating
Expenses -2,960.00 -2,654.01 -2,486.35 -2,441.10 -2,455.45 -2,498.75 -2,568.02 -2,595.67 -2,446.57 -2,422.85
EBITDA 301 335.77 336.39 311.89 306.84 248.54 217.86 206.24 195.26 149.43
Depreciation -65 -65.46 -78.98 -81.86 -89.79 -63.68 -62.02 -65.05 -63.02 -64.23
Amortisation 0 0 0 0 0 -24.55 -22.38 -23.49 -25.6 -29.32
Depreciation
and
Amortisation
-65 -65.46 -78.98 -81.86 -89.79 -88.24 -84.4 -88.54 -88.62 -93.54
EBIT 236 270.3 257.41 230.03 217.05 160.3 133.46 117.7 106.64 55.89
Interest
Revenue 4 2.72 2.17 4.5 1.42 1.02 0.75 0.91 0.44 0.4
Interest
Expense -92 -44.57 -37.65 -34.26 -29.78 -22.93 -23.49 -15.45 -11.26 -9.47
Net Interest
Expense -88 -41.84 -35.48 -29.76 -28.36 -21.91 -22.74 -14.54 -10.82 -9.07
PreTax Profit 148 228.46 221.93 200.27 188.68 138.4 110.72 103.16 95.81 46.82
Tax Expense -44 -64.93 -59.36 -59.3 -56.61 -39.86 -33.21 -29.68 -27.87 -13.88
Net Profit
after Tax
Before
Abnormals
104 163.53 162.56 140.97 132.08 98.54 77.51 73.48 67.94 32.94
Abnormals 0 -134.88 -2.3 4.6 -2.2 0 -61.69 -22.46 -65.6 -541.65
Abnormals
Tax 0 38.53 -0.6 -4.5 0 0 14 9.53 9.6 22.71
Net
Abnormals 0 -96.35 -2.9 0.1 -2.2 0 -47.69 -12.93 -56 -518.94
Reported
NPAT After
Abnormals
104 67.18 159.66 141.07 129.88 98.54 29.83 60.54 11.94 -486
Outside
Equity
Interests
0 0 0.06 -1.7 -2.66 -0.04 0 0 0 0
Shares
Outstanding
at Period End
585 580.98 583.15 583.36 583.56 585.68 585.69 821.27 821.27 821.28
Weighted
Average
Number Of
Shares
0 548.29 582.17 583.29 583.43 585.25 585.68 786.85 821.28 821.28
EPS Adjusted
(cents/share) 18 29.45 27.8 23.68 21.97 16.6 13.23 9.34 8.27 4.01
EPS After
Abnormals
(cents/share)
18 12.1 27.3 23.7 21.6 16.6 5.09 7.69 1.45 -59.18
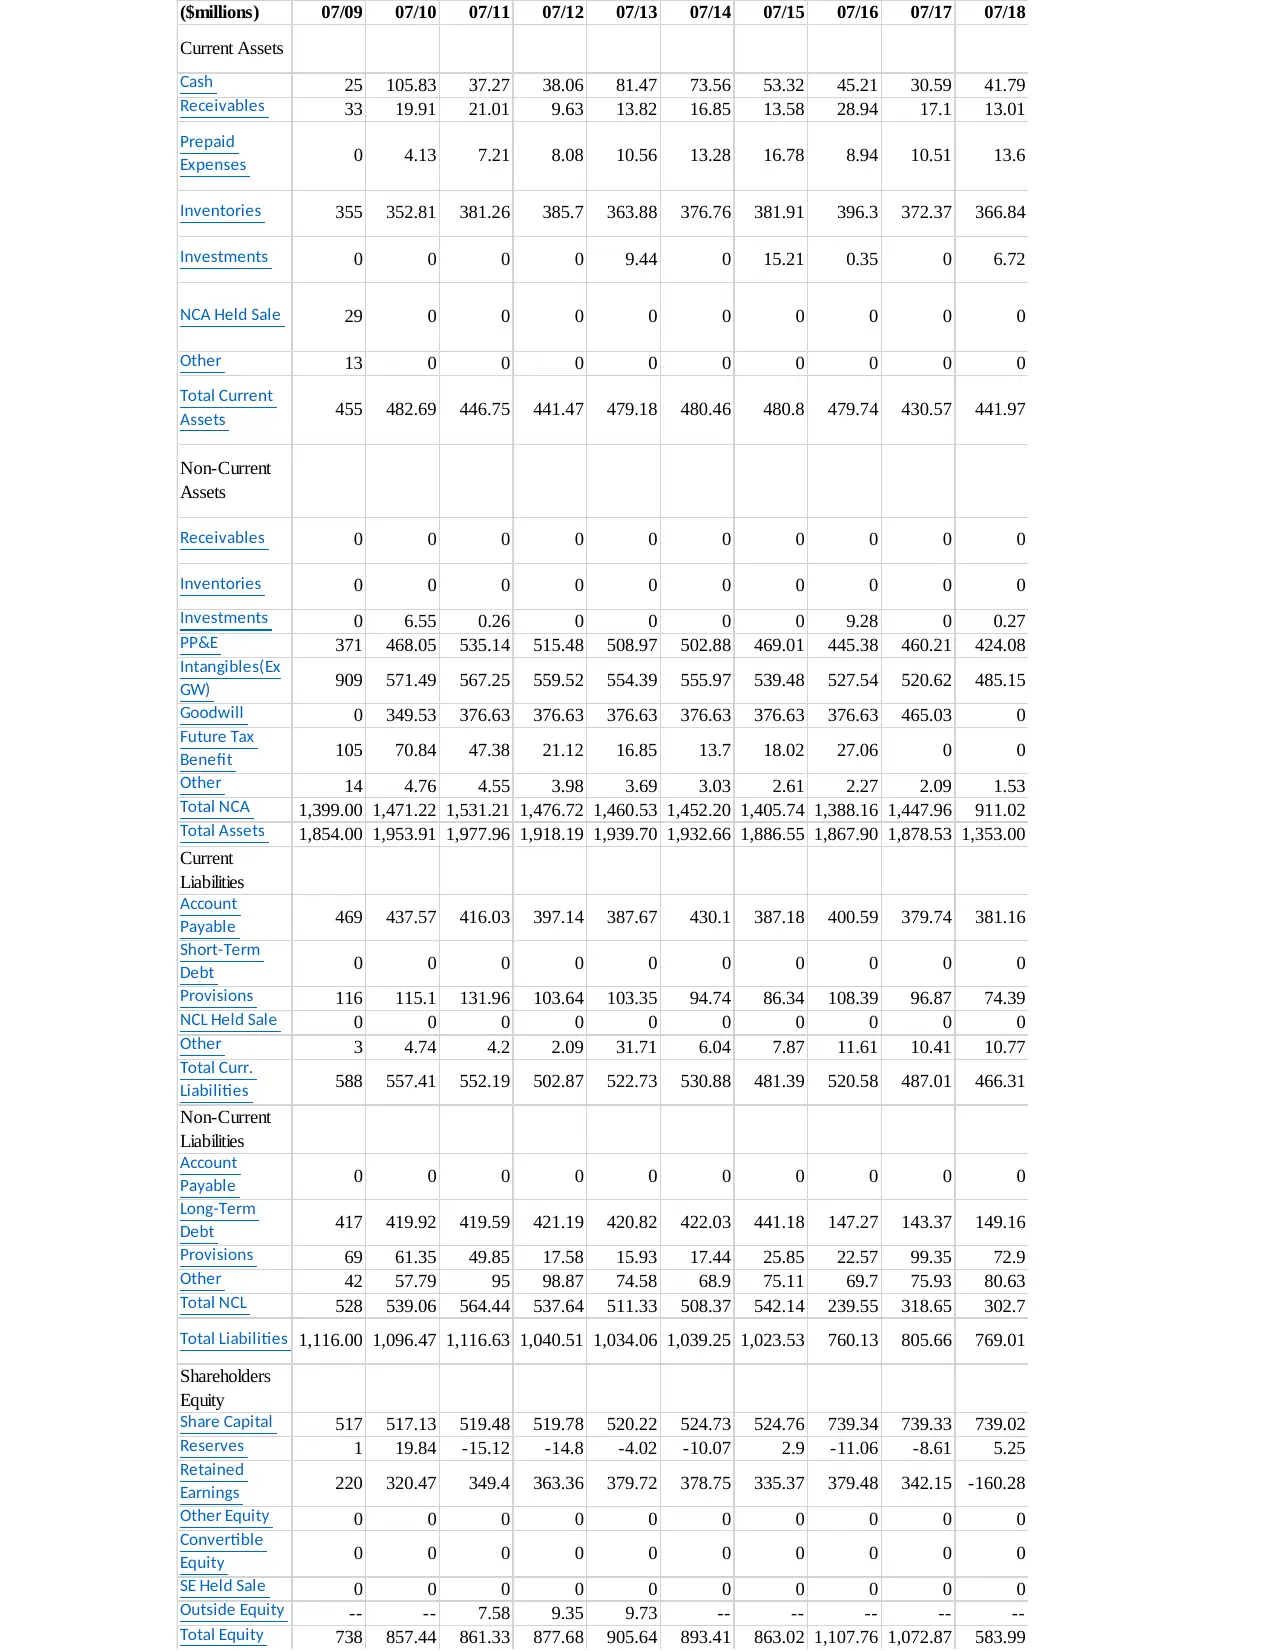
2) Balance Sheet
1) Profit and Loss Statement
($millions) 07/09 07/10 07/11 07/12 07/13 07/14 07/15 07/16 07/17 07/18
Operating
Revenue 3,261.00 2,928.75 2,776.13 2,726.00 2,737.54 2,728.78 2,772.37 2,780.57 2,623.40 2,556.32
Other
Revenue 0 61.04 46.61 26.99 24.74 18.51 13.51 21.34 18.43 15.97
Total
Revenue
Excluding
Interest
3,261.00 2,989.78 2,822.74 2,753.00 2,762.29 2,747.29 2,785.88 2,801.91 2,641.83 2,572.29
Operating
Expenses -2,960.00 -2,654.01 -2,486.35 -2,441.10 -2,455.45 -2,498.75 -2,568.02 -2,595.67 -2,446.57 -2,422.85
EBITDA 301 335.77 336.39 311.89 306.84 248.54 217.86 206.24 195.26 149.43
Depreciation -65 -65.46 -78.98 -81.86 -89.79 -63.68 -62.02 -65.05 -63.02 -64.23
Amortisation 0 0 0 0 0 -24.55 -22.38 -23.49 -25.6 -29.32
Depreciation
and
Amortisation
-65 -65.46 -78.98 -81.86 -89.79 -88.24 -84.4 -88.54 -88.62 -93.54
EBIT 236 270.3 257.41 230.03 217.05 160.3 133.46 117.7 106.64 55.89
Interest
Revenue 4 2.72 2.17 4.5 1.42 1.02 0.75 0.91 0.44 0.4
Interest
Expense -92 -44.57 -37.65 -34.26 -29.78 -22.93 -23.49 -15.45 -11.26 -9.47
Net Interest
Expense -88 -41.84 -35.48 -29.76 -28.36 -21.91 -22.74 -14.54 -10.82 -9.07
PreTax Profit 148 228.46 221.93 200.27 188.68 138.4 110.72 103.16 95.81 46.82
Tax Expense -44 -64.93 -59.36 -59.3 -56.61 -39.86 -33.21 -29.68 -27.87 -13.88
Net Profit
after Tax
Before
Abnormals
104 163.53 162.56 140.97 132.08 98.54 77.51 73.48 67.94 32.94
Abnormals 0 -134.88 -2.3 4.6 -2.2 0 -61.69 -22.46 -65.6 -541.65
Abnormals
Tax 0 38.53 -0.6 -4.5 0 0 14 9.53 9.6 22.71
Net
Abnormals 0 -96.35 -2.9 0.1 -2.2 0 -47.69 -12.93 -56 -518.94
Reported
NPAT After
Abnormals
104 67.18 159.66 141.07 129.88 98.54 29.83 60.54 11.94 -486
Outside
Equity
Interests
0 0 0.06 -1.7 -2.66 -0.04 0 0 0 0
Shares
Outstanding
at Period End
585 580.98 583.15 583.36 583.56 585.68 585.69 821.27 821.27 821.28
Weighted
Average
Number Of
Shares
0 548.29 582.17 583.29 583.43 585.25 585.68 786.85 821.28 821.28
EPS Adjusted
(cents/share) 18 29.45 27.8 23.68 21.97 16.6 13.23 9.34 8.27 4.01
EPS After
Abnormals
(cents/share)
18 12.1 27.3 23.7 21.6 16.6 5.09 7.69 1.45 -59.18
2) Balance Sheet
($millions) 07/09 07/10 07/11 07/12 07/13 07/14 07/15 07/16 07/17 07/18
Current Assets
Cash 25 105.83 37.27 38.06 81.47 73.56 53.32 45.21 30.59 41.79
Receivables 33 19.91 21.01 9.63 13.82 16.85 13.58 28.94 17.1 13.01
Prepaid
Expenses 0 4.13 7.21 8.08 10.56 13.28 16.78 8.94 10.51 13.6
Inventories 355 352.81 381.26 385.7 363.88 376.76 381.91 396.3 372.37 366.84
Investments 0 0 0 0 9.44 0 15.21 0.35 0 6.72
NCA Held Sale 29 0 0 0 0 0 0 0 0 0
Other 13 0 0 0 0 0 0 0 0 0
Total Current
Assets 455 482.69 446.75 441.47 479.18 480.46 480.8 479.74 430.57 441.97
Non-Current
Assets
Receivables 0 0 0 0 0 0 0 0 0 0
Inventories 0 0 0 0 0 0 0 0 0 0
Investments 0 6.55 0.26 0 0 0 0 9.28 0 0.27
PP&E 371 468.05 535.14 515.48 508.97 502.88 469.01 445.38 460.21 424.08
Intangibles(Ex
GW) 909 571.49 567.25 559.52 554.39 555.97 539.48 527.54 520.62 485.15
Goodwill 0 349.53 376.63 376.63 376.63 376.63 376.63 376.63 465.03 0
Future Tax
Benefit 105 70.84 47.38 21.12 16.85 13.7 18.02 27.06 0 0
Other 14 4.76 4.55 3.98 3.69 3.03 2.61 2.27 2.09 1.53
Total NCA 1,399.00 1,471.22 1,531.21 1,476.72 1,460.53 1,452.20 1,405.74 1,388.16 1,447.96 911.02
Total Assets 1,854.00 1,953.91 1,977.96 1,918.19 1,939.70 1,932.66 1,886.55 1,867.90 1,878.53 1,353.00
Current
Liabilities
Account
Payable 469 437.57 416.03 397.14 387.67 430.1 387.18 400.59 379.74 381.16
Short-Term
Debt 0 0 0 0 0 0 0 0 0 0
Provisions 116 115.1 131.96 103.64 103.35 94.74 86.34 108.39 96.87 74.39
NCL Held Sale 0 0 0 0 0 0 0 0 0 0
Other 3 4.74 4.2 2.09 31.71 6.04 7.87 11.61 10.41 10.77
Total Curr.
Liabilities 588 557.41 552.19 502.87 522.73 530.88 481.39 520.58 487.01 466.31
Non-Current
Liabilities
Account
Payable 0 0 0 0 0 0 0 0 0 0
Long-Term
Debt 417 419.92 419.59 421.19 420.82 422.03 441.18 147.27 143.37 149.16
Provisions 69 61.35 49.85 17.58 15.93 17.44 25.85 22.57 99.35 72.9
Other 42 57.79 95 98.87 74.58 68.9 75.11 69.7 75.93 80.63
Total NCL 528 539.06 564.44 537.64 511.33 508.37 542.14 239.55 318.65 302.7
Total Liabilities 1,116.00 1,096.47 1,116.63 1,040.51 1,034.06 1,039.25 1,023.53 760.13 805.66 769.01
Shareholders
Equity
Share Capital 517 517.13 519.48 519.78 520.22 524.73 524.76 739.34 739.33 739.02
Reserves 1 19.84 -15.12 -14.8 -4.02 -10.07 2.9 -11.06 -8.61 5.25
Retained
Earnings 220 320.47 349.4 363.36 379.72 378.75 335.37 379.48 342.15 -160.28
Other Equity 0 0 0 0 0 0 0 0 0 0
Convertible
Equity 0 0 0 0 0 0 0 0 0 0
SE Held Sale 0 0 0 0 0 0 0 0 0 0
Outside Equity -- -- 7.58 9.35 9.73 -- -- -- -- --
Total Equity 738 857.44 861.33 877.68 905.64 893.41 863.02 1,107.76 1,072.87 583.99
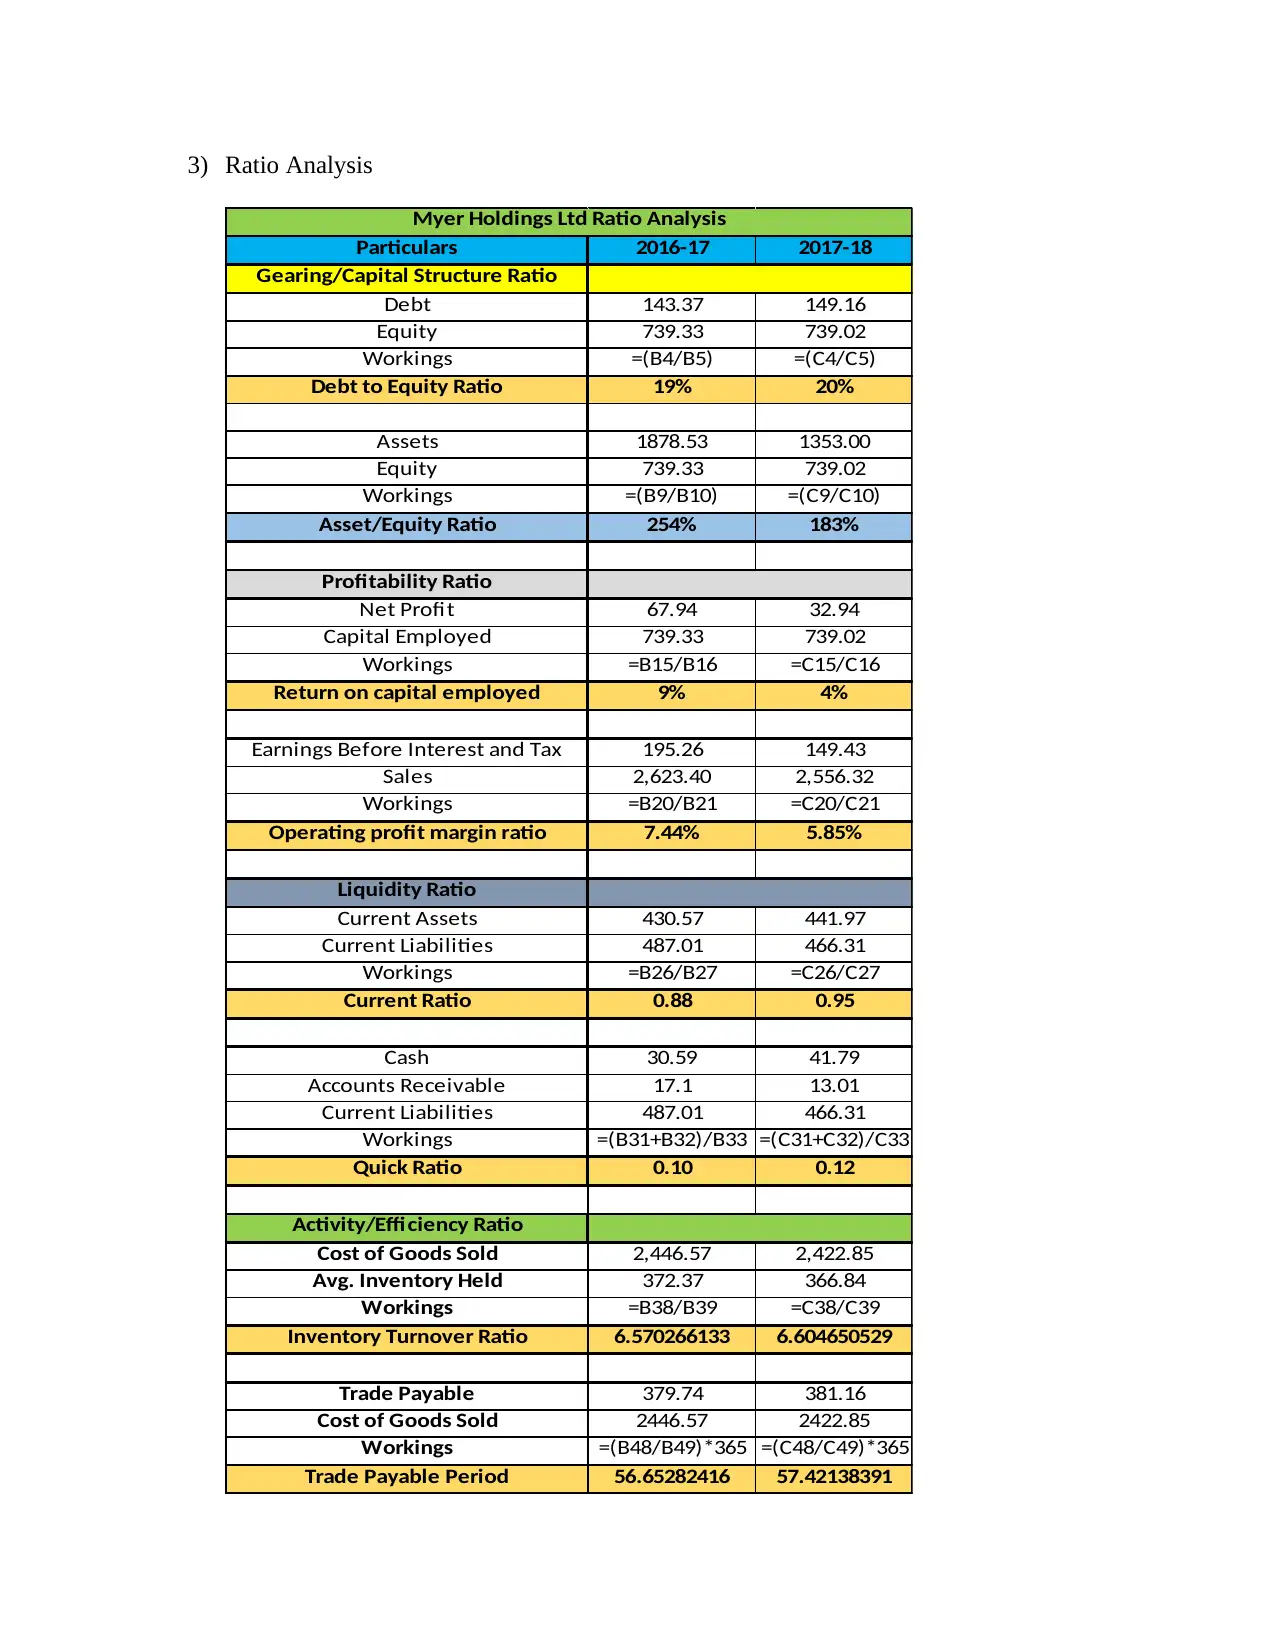
3) Ratio Analysis
Particulars 2016-17 2017-18
Gearing/Capital Structure Ratio
Debt 143.37 149.16
Equity 739.33 739.02
Workings =(B4/B5) =(C4/C5)
Debt to Equity Ratio 19% 20%
Assets 1878.53 1353.00
Equity 739.33 739.02
Workings =(B9/B10) =(C9/C10)
Asset/Equity Ratio 254% 183%
Profitability Ratio
Net Profit 67.94 32.94
Capital Employed 739.33 739.02
Workings =B15/B16 =C15/C16
Return on capital employed 9% 4%
Earnings Before Interest and Tax 195.26 149.43
Sales 2,623.40 2,556.32
Workings =B20/B21 =C20/C21
Operating profit margin ratio 7.44% 5.85%
Liquidity Ratio
Current Assets 430.57 441.97
Current Liabilities 487.01 466.31
Workings =B26/B27 =C26/C27
Current Ratio 0.88 0.95
Cash 30.59 41.79
Accounts Receivable 17.1 13.01
Current Liabilities 487.01 466.31
Workings =(B31+B32)/B33 =(C31+C32)/C33
Quick Ratio 0.10 0.12
Activity/Efficiency Ratio
Cost of Goods Sold 2,446.57 2,422.85
Avg. Inventory Held 372.37 366.84
Workings =B38/B39 =C38/C39
Inventory Turnover Ratio 6.570266133 6.604650529
Trade Payable 379.74 381.16
Cost of Goods Sold 2446.57 2422.85
Workings =(B48/B49)*365 =(C48/C49)*365
Trade Payable Period 56.65282416 57.42138391
Myer Holdings Ltd Ratio Analysis
Particulars 2016-17 2017-18
Gearing/Capital Structure Ratio
Debt 143.37 149.16
Equity 739.33 739.02
Workings =(B4/B5) =(C4/C5)
Debt to Equity Ratio 19% 20%
Assets 1878.53 1353.00
Equity 739.33 739.02
Workings =(B9/B10) =(C9/C10)
Asset/Equity Ratio 254% 183%
Profitability Ratio
Net Profit 67.94 32.94
Capital Employed 739.33 739.02
Workings =B15/B16 =C15/C16
Return on capital employed 9% 4%
Earnings Before Interest and Tax 195.26 149.43
Sales 2,623.40 2,556.32
Workings =B20/B21 =C20/C21
Operating profit margin ratio 7.44% 5.85%
Liquidity Ratio
Current Assets 430.57 441.97
Current Liabilities 487.01 466.31
Workings =B26/B27 =C26/C27
Current Ratio 0.88 0.95
Cash 30.59 41.79
Accounts Receivable 17.1 13.01
Current Liabilities 487.01 466.31
Workings =(B31+B32)/B33 =(C31+C32)/C33
Quick Ratio 0.10 0.12
Activity/Efficiency Ratio
Cost of Goods Sold 2,446.57 2,422.85
Avg. Inventory Held 372.37 366.84
Workings =B38/B39 =C38/C39
Inventory Turnover Ratio 6.570266133 6.604650529
Trade Payable 379.74 381.16
Cost of Goods Sold 2446.57 2422.85
Workings =(B48/B49)*365 =(C48/C49)*365
Trade Payable Period 56.65282416 57.42138391
Myer Holdings Ltd Ratio Analysis
Paraphrase This Document
Need a fresh take? Get an instant paraphrase of this document with our AI Paraphraser

1 out of 14
Related Documents


Your All-in-One AI-Powered Toolkit for Academic Success.
+13062052269
info@desklib.com
Available 24*7 on WhatsApp / Email
![[object Object]](/_next/static/media/star-bottom.7253800d.svg)
Unlock your academic potential
© 2024 | Zucol Services PVT LTD | All rights reserved.