Financial Ratio and BEP Analysis for Gulf Hotels (Oman) Company
VerifiedAdded on 2022/08/22
|40
|9840
|17
Report
AI Summary
This report provides a comprehensive financial analysis of Gulf Hotels (Oman) Company Limited. It begins with an overview of the company and then delves into detailed calculations and analysis of various financial ratios, including liquidity, profitability, efficiency, gearing, and market ratios. The analysis covers a five-year period and discusses the company's performance in relation to these ratios, with recommendations for improvement. The report also includes an evaluation of three projects undertaken by the company, calculating their net present value and profitability index. Furthermore, it considers non-financial factors relevant to project appraisal. Lastly, the report calculates the P/V ratio for Muscat Lightings LLC and discusses the importance of the Break-Even Point (BEP) with relevant literature review. The report also includes reflection on a guest lecture and provides references and appendices to support the analysis. The report fulfills the requirements of an assignment for a Financial Analysis for Managers module.
Running Head: Financial Ratio and BEP Analysis
Financial Ratio and BEP Analysis
Name of the Student
Name of the University
Author Note
Financial Ratio and BEP Analysis
Name of the Student
Name of the University
Author Note
Paraphrase This Document
Need a fresh take? Get an instant paraphrase of this document with our AI Paraphraser
1
Financial Ratio and BEP Analysis
Abstract
The main aim of this paper is to evaluate the financial performance of Gulf Oman after
calculating the following ratios- liquidity, profitability, efficiency, gearing and market ratios.
Based on the computed calculations and relevant literature review recommendation is
provided about the techniques of the ratios and also about the shares of the company and
whether it is feasible to invest in this company or not. These paper also talks about three
projects at Ibra, Sur and Nizwa. The net present value and profitability index has been
calculated for checking the feasibility of the projects. Also, it discusses about the non-
financial factors which are equally important for the purpose of conducting project appraisal.
Lastly, it calculates the P/V ratio of Muscat Lightings LLC along with its sales and profit.
The paper also discusses about the importance of Break Even Point with the help of
appropriate literature review.
2
Financial Ratio and BEP Analysis
Table of Contents
Proposal......................................................................................................................................2
Response to question 1A-...........................................................................................................2
Response to question 1B-...........................................................................................................4
Response to question 1C-.........................................................................................................20
Response to question 1D-.........................................................................................................21
Response to question 2A-.........................................................................................................24
Response to question 2B-.........................................................................................................24
Response to question 2C-.........................................................................................................25
Response to question 3-...........................................................................................................28
Response to question 3E-.........................................................................................................28
Reflection report on the guest lecture......................................................................................31
References and Bibliography...................................................................................................32
Appendices-..............................................................................................................................35
⊘ This is a preview!⊘
Do you want full access?
Subscribe today to unlock all pages.
Trusted by 1+ million students worldwide
3
Financial Ratio and BEP Analysis
Proposal
This paper has been prepared by computing the liquidity, profitability and efficiency
ratios of Gulf Oman with a discussion about the computed ratios with the help of literature
reviews. It also discussed about the recommendations for buying the shares of these
companies. It also contains a reflective portion which describes the learning experience in
this course. The next part deals with the evaluation of the projects after computing NPV and
profitability index along with the non-financial factors which help in project appraisal. The
last part contains the calculation of P/V ratio and fixed cost along with the importance of
break-even point based on literature review.
Response to question 1A-
In this part a brief analysis of the financial statement of the gulf hotel (Oman)
company limited is made and for that analysis different financial ratios like the liquidity ratio,
profitability ratio, efficiency ratio, market ratio, capital structure ratio has been assessed from
which it can be possible to detect the current financial condition of the company and also to
recommend suggestion in which areas the company should give more emphasis to attain
sustainable growth in the future.
Paraphrase This Document
Need a fresh take? Get an instant paraphrase of this document with our AI Paraphraser
4
Financial Ratio and BEP Analysis
Financial Ratio and BEP Analysis
5
Financial Ratio and BEP Analysis
Brief introduction of the gulf hotel (Oman) company limited-
Gulf hotels (Oman) company limited is a company that is located in the Al Qurum
RUWI region of Muscat in Oman. It is a public limited joint stock company that deals in the
business of hospitality and tourism. Incorporated in the year 1977 this organisation has
earned huge reputation in the tourism industry. In the Muscat region the organisation own
and operate the crown plaza hotel which is licensed and managed by a subsidiary company of
the international hotel groups which is a part of the gulf hotels (Oman) company. The
company has also made investments in various subsidiary companies like the Arabian hotel
management LLC, which looks after the services related with hotel management. The major
shareholders of the company are the golden sands hotel company LLC and Salim and
partners LLC & associates.
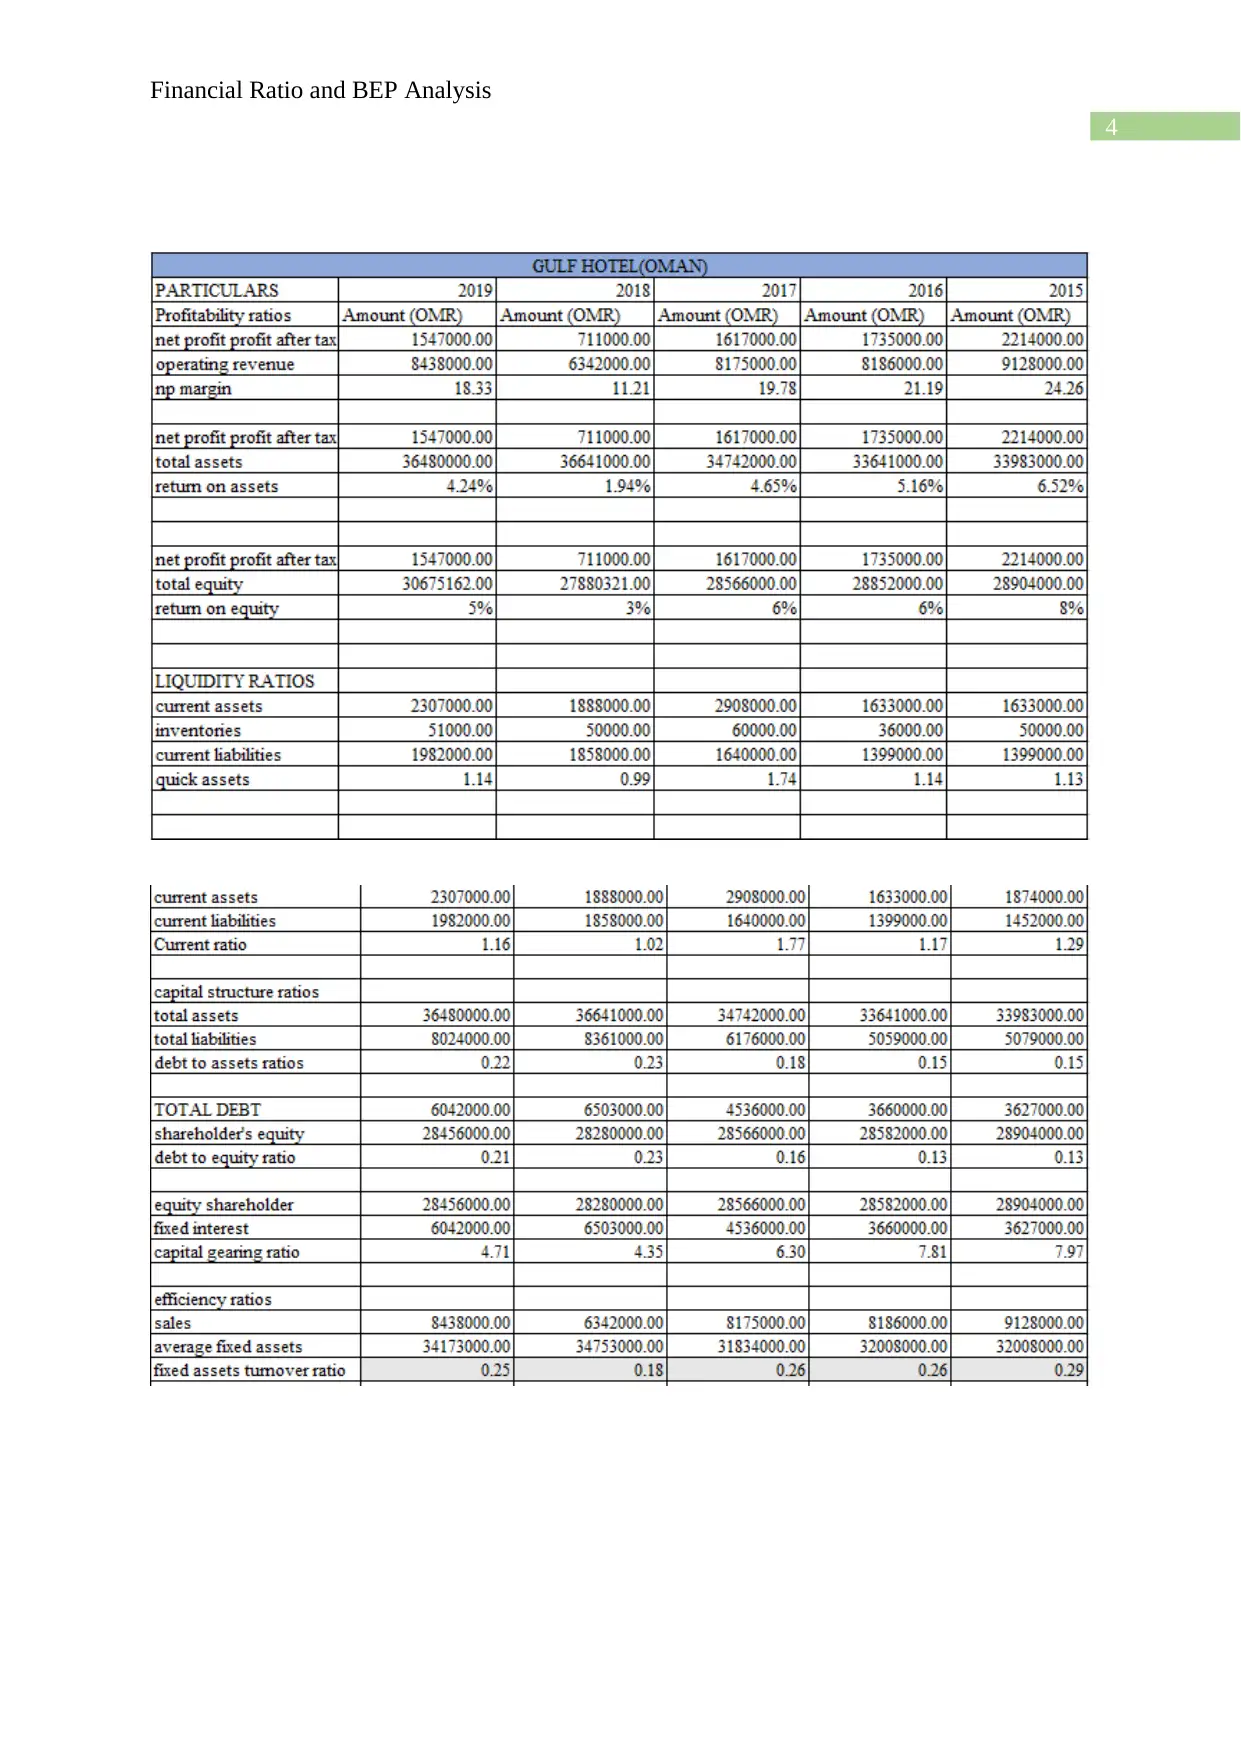
Response to question 1B-
Analysis of the various ratios of the Gulf Hotels (Oman)
Liquidity ratios
The liquidity ratios are used to measure the liquidity condition of the company, to
evaluate the efficiency of the organisation to settle its short term debt obligations by utilising
its liquid assets. A low liquidity ratio indicates that the company does not have enough liquid
Financial Ratio and BEP Analysis
Brief introduction of the gulf hotel (Oman) company limited-
Gulf hotels (Oman) company limited is a company that is located in the Al Qurum
RUWI region of Muscat in Oman. It is a public limited joint stock company that deals in the
business of hospitality and tourism. Incorporated in the year 1977 this organisation has
earned huge reputation in the tourism industry. In the Muscat region the organisation own
and operate the crown plaza hotel which is licensed and managed by a subsidiary company of
the international hotel groups which is a part of the gulf hotels (Oman) company. The
company has also made investments in various subsidiary companies like the Arabian hotel
management LLC, which looks after the services related with hotel management. The major
shareholders of the company are the golden sands hotel company LLC and Salim and
partners LLC & associates.
Response to question 1B-
Analysis of the various ratios of the Gulf Hotels (Oman)
Liquidity ratios
The liquidity ratios are used to measure the liquidity condition of the company, to
evaluate the efficiency of the organisation to settle its short term debt obligations by utilising
its liquid assets. A low liquidity ratio indicates that the company does not have enough liquid
⊘ This is a preview!⊘
Do you want full access?
Subscribe today to unlock all pages.
Trusted by 1+ million students worldwide
6
Financial Ratio and BEP Analysis
assets to settle its short term obligations. On the contrary it can be said that if the company
has a high liquidity ratio then in such cases it reflects that the liquidity condition is strong and
the company will be able to settle its short term obligation from its liquid assets. Although a
high liquid ratio is also occurs if the organisation’s inventory turnover ratio is low. A low
inventory turnover indicates that the company fails to sales it products frequently its
inventory value will increase and for that reason the liquidity ratio will also increases so in
that context it can be said that abnormal increase in the liquidity ratio is always not a good
indicator for the organisation. The liquidity ratio is classified into two types the current ratio
and the quick ratio (Oukil Channouf and Al-Zaidi 2016).
Current ratio
The current ratio is calculated by dividing the current assets by the current liabilities.
This ratio is used to measure the position of the current assets in relation to the current
liabilities. The current assets in this respect includes the cash and bank balances, inventory,
bill receivables and trade receivables, and the current liabilities include trade payables, bills
payables and bank overdrafts. By analysing the trend of the last five years of the gulf hotels
Oman it can be observed that the current ratio is declining after the year 2015. In the year the
current ratio of the organisation is 1.29 and it started to fall since then. In the year 2016 the
ratio fall down to 1.17 and again it raised up to 1.77 in the year 2017, but after that in the year
2018 it fall sharply and the current ratio in the year 2018 comes down to 1.02. This shows
that the company’s current assets is declining in contrast to the current liabilities. In 2019 the
current ratio again increased to 1.15. the gulf hotel’s current ratio in the years 2015 ,2016,
2017, 2018 and 2019 is more than 1 which is greater than the standard limit, which means
that the organisation have enough current assets over the current liabilities and it will be
Paraphrase This Document
Need a fresh take? Get an instant paraphrase of this document with our AI Paraphraser
7
Financial Ratio and BEP Analysis
possible for the company to settle the short term obligations from the current assets. However
from 2018 the situation become worse and this happens because the company started to take
more credit from the suppliers in the year 2018and 2019 and also their current assets falls
from $2908000 in the year 2017 to 1888000 in the year 2018 only in this year the company
has to suffer due to the fall in the value of then current assets and increase of the current
liabilities (Khoja Chipulu and Jayasekera 2016).
Except 2018 the overall trend in the last 5 years is satisfactory and from the analysis
of the current ratio it can be said that the management of the company has played an effective
role in maintaining a strong base of liquid assets from which it can be possible for the
organisation to settle the dues of the suppliers.
From this analysis it can be said that the suppliers will always provide necessary raw
materials to the company on credit as they are ensured that the company has enough
resources to settle their dues and they will not suffer any loss by giving credit to gulf hotels.
In this regard the only recommendation that can be given to the management that they should
try to maintain this balance in the current assets and current liabilities and should not hold too
much inventory to manipulate the liquidity position in order to attract the creditors (Hilkevics
and Semakina 2019).
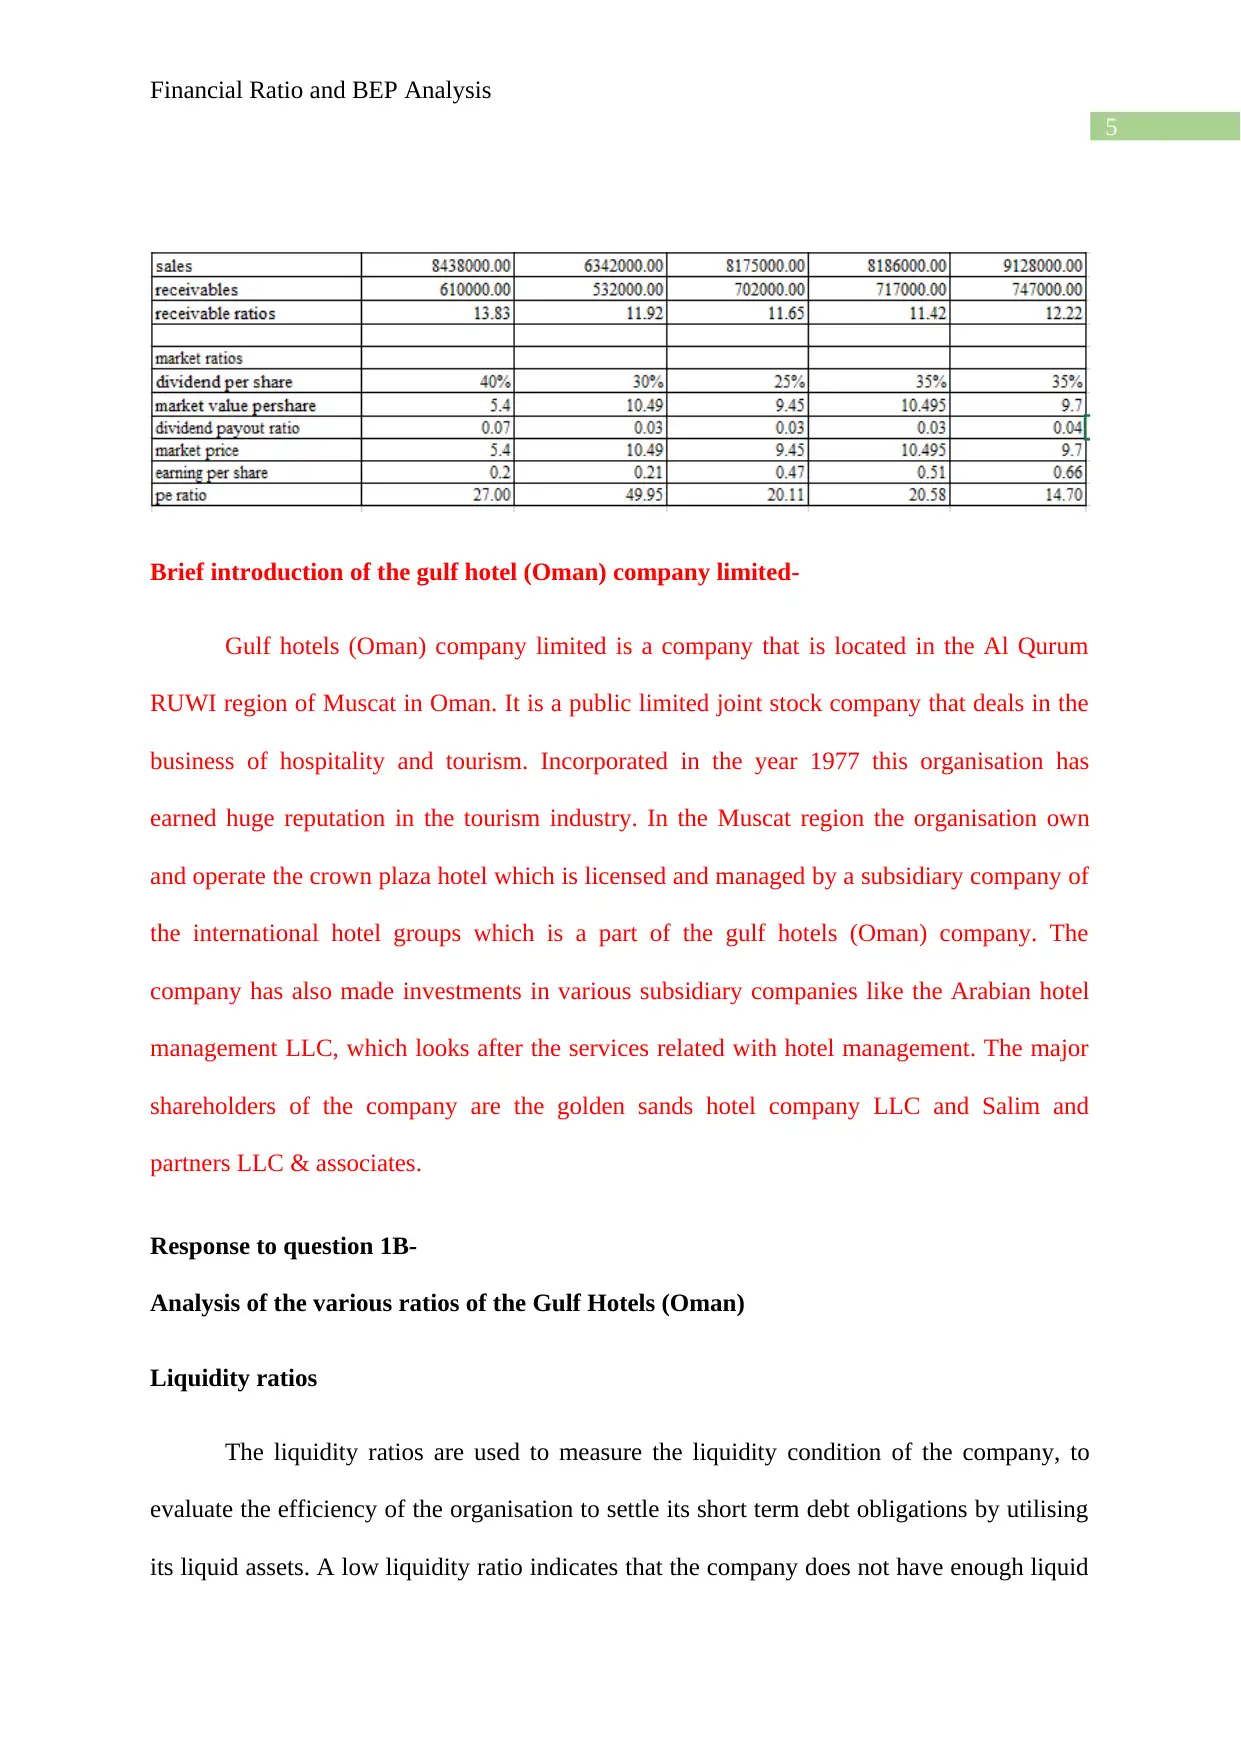
Quick ratio
The quick ratio is more effective than the current ratio to evaluate the condition of the
liquid assets of the company as in this ratio the inventory is deducted from the current assets
and the ratio is calculated by dividing current assets minus inventory by the current liabilities.
As the companies used to overvalue the liquidity position by including inventory in their
Financial Ratio and BEP Analysis
possible for the company to settle the short term obligations from the current assets. However
from 2018 the situation become worse and this happens because the company started to take
more credit from the suppliers in the year 2018and 2019 and also their current assets falls
from $2908000 in the year 2017 to 1888000 in the year 2018 only in this year the company
has to suffer due to the fall in the value of then current assets and increase of the current
liabilities (Khoja Chipulu and Jayasekera 2016).
Except 2018 the overall trend in the last 5 years is satisfactory and from the analysis
of the current ratio it can be said that the management of the company has played an effective
role in maintaining a strong base of liquid assets from which it can be possible for the
organisation to settle the dues of the suppliers.
From this analysis it can be said that the suppliers will always provide necessary raw
materials to the company on credit as they are ensured that the company has enough
resources to settle their dues and they will not suffer any loss by giving credit to gulf hotels.
In this regard the only recommendation that can be given to the management that they should
try to maintain this balance in the current assets and current liabilities and should not hold too
much inventory to manipulate the liquidity position in order to attract the creditors (Hilkevics
and Semakina 2019).
Quick ratio
The quick ratio is more effective than the current ratio to evaluate the condition of the
liquid assets of the company as in this ratio the inventory is deducted from the current assets
and the ratio is calculated by dividing current assets minus inventory by the current liabilities.
As the companies used to overvalue the liquidity position by including inventory in their
8
Financial Ratio and BEP Analysis
current assets it will be effective to consider the quick asset ratio as in this ratio the inventory
is deducted from the current assets and after that the current assets is divided by the current
liabilities to assess the actual capacity of the current assets of the company to settle the short
term obligations. As inventory valuation is often manipulated by the organisations so it will
be better not to consider it to evaluate the liquidity position of the organisation. It is generally
accepted that a quick ratio of more than 1 indicates that the liquidity condition of the
company is strong and there is enough quick assets available with the company to settle the
obligation of the short term debts that includes the dues of the vendors (Samour and Hassan
2016).
From the analysis of the last 5 years trend of the gulf hotels Oman it can be observed
that in the year 2015 the quick ratio is 1.13 and it raised to 1.14 in the year 2016 and in 2017
it raised further to 1.77 which indicates that in these 3 years the organisation has managed its
current assets adequately and create a strong liquid assets base which will assist in setting off
the dues of the vendors and other short term obligations. However in the year 2018 the ratio
certainly drop down to below the standard level of 1 and reached the level of 0.99. This
indicates that the liquidity condition of the company in this year suddenly decreases, however
in the year 2019 the company again improve its quick asset ratio and raise it to 1.14.
From this analysis it can be recommended to the management that they should try to
increase the value of their inventory and should try to increase the value of the current assets
which will increase the quick ratio and will improve the liquidity condition of the company in
the future also (Wen and Zhu 2019).
Profitability ratios
⊘ This is a preview!⊘
Do you want full access?
Subscribe today to unlock all pages.
Trusted by 1+ million students worldwide
9
Financial Ratio and BEP Analysis
The profitability ratios are used to measure the profit earning capacity of the
organisations. The main objective of every company is to increase its profit earning capacity
in order to sustain in the competitive market the higher the profit earning ration the better it is
for the organisation. If the profitability ratio shows a declining trend then the management
should take immediate action to solve the problem for which the profitability of the company
is declining. A high profitability ratio on the other hand indicates that the company is
operating efficiently and that it should try to maintain this trend in the future also. The
profitability ratio is measured using the following ratios like the net profit margin ratio, the
return on assets ratio, and the return on equity (Gamal 2016).
Net profit margin
The net profit margin is calculated by dividing the net profit or loss after tax by the
operating revenue generated by the company during the financial year. The net profit margin
is calculated to measure the margin of profit earned by the company from its revenue. The net
profit is calculated by deducting the cost of goods sold and the expenses. By analysing the net
profit margin of gulf hotel it is observed that the company’s earning capacity has fallen over
the last 5 years since 2015. In the year 2015 the net profit margin is 24.26 which indicates
that the company has beat the market standard of 20% in this year. In the year 2015 the
company generated huge revenue and also been able to impose control over its operating
expenses for which the profit percentage increased significantly (Keyghobadi Seif and Fathi
2019).
In the year 2016 the net profit margin fall down to 21.19 but in spite of that the
company able to keep its net profit margin more than the average market rate. The net profit
margin of the company fall down below 20 in the year 2017, the net profit margin in this year
Paraphrase This Document
Need a fresh take? Get an instant paraphrase of this document with our AI Paraphraser
10
Financial Ratio and BEP Analysis
is 19.78. This indicates that the company’s operating expenses increase in this year and for
that reason the net profit also decreases which influenced the net profit margin. In the year
2018 the net profit fall significantly to 11.21. in this year the organisation suffer heavy loss in
its revenue generating capacity from 8175000 in the year the revenue sharply fall down to
6342000 this indicates that the management fail to generate revenue and at the same time the
expenses also increases which negatively impact the earning capacity of the gulf hotel. In the
year 2019 the management take some effective actions by controlling the expenses and also
increase the revenue for which the company has been able to increase its net profit margin
from 11.21 in the year 2018 to 18.33 in the year 2019. From this analysis it can be said that
the management of the company is competent enough to rectify the errors that they have
made in the year 2018 and from that they have turn around and make a 7 % increase in the
net profit margin within a period of one year (Mahdaleta 2016).
It has been recommended that the management of the company has to take initiative
to increase their net profit earning capacity in the future since last five years the company’s
net profit margin falls, this happened due to the lack of integrity of the management to
improve the revenue generation capacity and also to bring control in the expenses so that the
profit percentage can be increased (Mwambuli 2016).
Return on assets
The return on assets is used to measure how much efficient the organisation’s assets
are in generating profit. The return on assets is calculated by dividing the net profit by the
total value of assets. The higher the return on assets the better it is for the organisation as it
indicates that the company is more efficient to generate more revenue by utilising its limited
resources. The total assets in this matter includes the total liabilities and the shareholder’s
11
Financial Ratio and BEP Analysis
equity. The return on assets of the gulf hotel in the year 2015 is 6.52 which started to fall in
the consecutive four years until 2019. In the year 2016 the return on assets fall down to 5.16
and it further fall down to 4.65% in the year 2017 this fall continues as the net profit of the
company fall on a continuous basis due to the increase of the expenses and the failure of the
company to increase its turnover (Chandra 2017).
The condition further worsen in the year 2018 as in this year the return on assets
further decreases to 1.94%. The organisation continuously fail to increase the revenue from
its assets for a continuous 4 years which is not a good indicator for the growth of the business
activities. It is recommended that the company should try to make full utilisation of the
unused assets either by letting out more spaces or the company have to detect the idle and
utilised assets and should try to liquidate such assets which will help the company to improve
the liquidity position (Al Habsi 2018).
Return on equity
The return on equity is essential to interpret the capacity of the company to give
return to its equity shareholders this an essential tool to evaluate the potential of the company
to maximise the wealth of the investors. The return on equity is calculated by dividing the net
profit by the value of the equity shares. A company that provides high return on equity is
always desired by the investors and a company that provide a low return on equity is not
considered by the investors. In case of gulf hotels Oman the return on equity shows that the
company is only giving a moderate rate of return to its equity shareholders. In the year 2015
the rate of return is 8% which again decreases to 2016 to 6% and it fail to improve the figures
in the year 2017 and the rate of return remains to 6% in this year also (Hussain et al 2017).
⊘ This is a preview!⊘
Do you want full access?
Subscribe today to unlock all pages.
Trusted by 1+ million students worldwide
1 out of 40
Related Documents


Your All-in-One AI-Powered Toolkit for Academic Success.
+13062052269
info@desklib.com
Available 24*7 on WhatsApp / Email
![[object Object]](/_next/static/media/star-bottom.7253800d.svg)
Unlock your academic potential
Copyright © 2020–2026 A2Z Services. All Rights Reserved. Developed and managed by ZUCOL.