Statistics: Understanding and Doing Statistical Analysis for Flight Data
Added on 2023-06-11
9 Pages1355 Words412 Views
Statistics
Name:
Institution:
28th May 2018
Name:
Institution:
28th May 2018

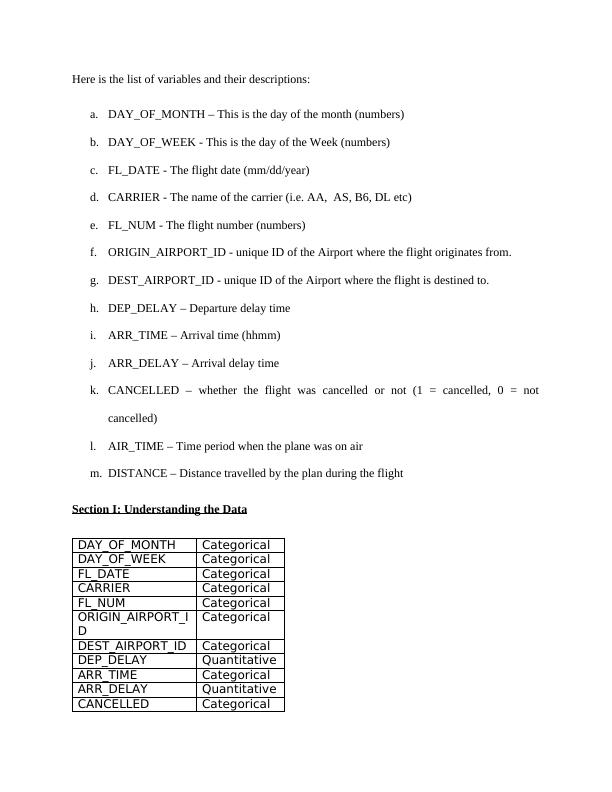
Here is the list of variables and their descriptions:
a. DAY_OF_MONTH – This is the day of the month (numbers)
b. DAY_OF_WEEK - This is the day of the Week (numbers)
c. FL_DATE - The flight date (mm/dd/year)
d. CARRIER - The name of the carrier (i.e. AA, AS, B6, DL etc)
e. FL_NUM - The flight number (numbers)
f. ORIGIN_AIRPORT_ID - unique ID of the Airport where the flight originates from.
g. DEST_AIRPORT_ID - unique ID of the Airport where the flight is destined to.
h. DEP_DELAY – Departure delay time
i. ARR_TIME – Arrival time (hhmm)
j. ARR_DELAY – Arrival delay time
k. CANCELLED – whether the flight was cancelled or not (1 = cancelled, 0 = not
cancelled)
l. AIR_TIME – Time period when the plane was on air
m. DISTANCE – Distance travelled by the plan during the flight
Section I: Understanding the Data
DAY_OF_MONTH Categorical
DAY_OF_WEEK Categorical
FL_DATE Categorical
CARRIER Categorical
FL_NUM Categorical
ORIGIN_AIRPORT_I
D
Categorical
DEST_AIRPORT_ID Categorical
DEP_DELAY Quantitative
ARR_TIME Categorical
ARR_DELAY Quantitative
CANCELLED Categorical
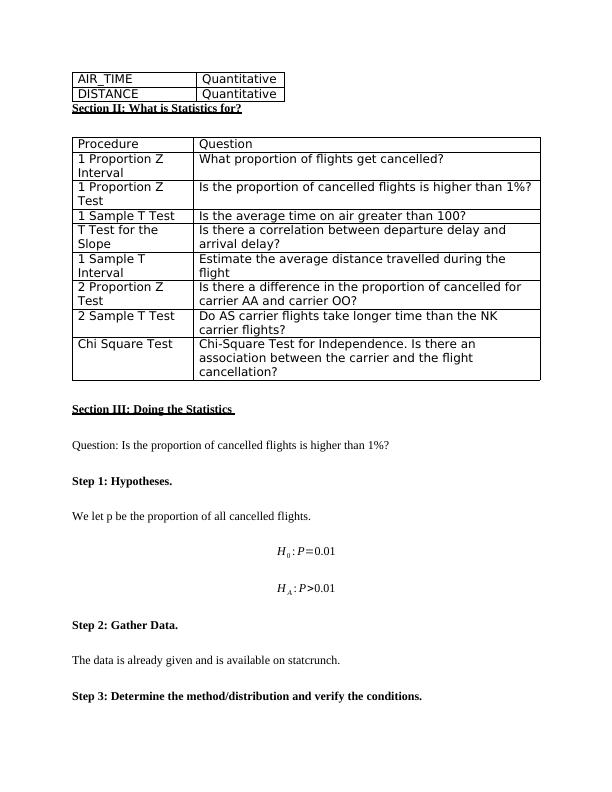
AIR_TIME Quantitative
DISTANCE Quantitative
Section II: What is Statistics for?
Procedure Question
1 Proportion Z
Interval
What proportion of flights get cancelled?
1 Proportion Z
Test
Is the proportion of cancelled flights is higher than 1%?
1 Sample T Test Is the average time on air greater than 100?
T Test for the
Slope
Is there a correlation between departure delay and
arrival delay?
1 Sample T
Interval
Estimate the average distance travelled during the
flight
2 Proportion Z
Test
Is there a difference in the proportion of cancelled for
carrier AA and carrier OO?
2 Sample T Test Do AS carrier flights take longer time than the NK
carrier flights?
Chi Square Test Chi-Square Test for Independence. Is there an
association between the carrier and the flight
cancellation?
Section III: Doing the Statistics
Question: Is the proportion of cancelled flights is higher than 1%?
Step 1: Hypotheses.
We let p be the proportion of all cancelled flights.
H0 : P=0.01
H A : P>0.01
Step 2: Gather Data.
The data is already given and is available on statcrunch.
Step 3: Determine the method/distribution and verify the conditions.
End of preview
Want to access all the pages? Upload your documents or become a member.
Related Documents
Hypothesis Testing in Statisticslg...
|7
|1124
|23