Glucose Tolerance Assay
VerifiedAdded on 2023/04/22
|11
|2219
|464
AI Summary
This article discusses the Glucose Tolerance Assay, its importance in diagnosing diabetes, and the procedure to conduct the assay. It also provides information on interpreting the results and includes a standard curve for glucose concentration. The article concludes with a discussion on the accuracy of the collected data and the diagnosis of different patients based on their glucose levels.
Contribute Materials
Your contribution can guide someone’s learning journey. Share your
documents today.

Running head: GLUCOSE TOLERANCE ASSAY
GLUCOSE TOLERANCE ASSAY
Name of the Student
Name of the University
Author’s Note:
GLUCOSE TOLERANCE ASSAY
Name of the Student
Name of the University
Author’s Note:
Secure Best Marks with AI Grader
Need help grading? Try our AI Grader for instant feedback on your assignments.

1GLUCOSE TOLERANCE ASSAY
Table of Contents
Introduction:....................................................................................................................................2
Materials:.........................................................................................................................................3
Methods:..........................................................................................................................................4
Preparation of standard curve from standard glucose solution using spectrometer....................4
Preparation and assessment of patients’ samples........................................................................4
Calculation of standard deviation................................................................................................4
Results:............................................................................................................................................5
Discussion and Conclusion:.............................................................................................................8
References:....................................................................................................................................10

2GLUCOSE TOLERANCE ASSAY
Introduction:
FGT or Fasting Glucose Test is a test which is commonly used to determine the blood glucose
levels in an individual and therefore, can be employed to diagnose the functioning insulin level
of any individuals (Ortiz et al. 2018). As a result, this Fasting Glucose Test can be used to
diagnose the pre- diabetic or diabetic condition in an individual. Glucagon is a type of hormone
which produced in the pancreas and gets triggered by sustained fasting. This hormone, glucagon,
is the reason behind the release of glucose in the blood stream by liver (Bonner et al. 2015).
Body reacts to the glucose level in the blood stream by producing the hormone Insulin which in
turn mediates the glucose present in the blood stream to enter in the cell and supplying them with
the needed energy for their functioning. Thus, insulin helps maintain the blood glucose level in
the blood stream and preventing the condition known as hyperglycemia (Jakubowicz et al.
2015). Hyperglycemia is a condition in which body cannot produce enough insulin required to
handle blood sugar present in the blood and thus causing high blood sugar in blood and the
fasting blood sugar level remains high (Jakubowicz et al. 2015). This high blood sugar level or
hyperglycemia is a major concern for the affected individuals can lead to the condition known as
diabetes mellitus for both type 1 and type 2. Diabetes has become a major global health issues
and untreated condition leads to severe dysfunction of organ and can even leads to death. Hence,
accurate determining test is required to measure the blood glucose level to detect the presence of
diabetes (Varni et al. 2018). In case of definition and classification of diabetes, British diabetic
association has endorsed to adapt the criteria and guidelines provided World Health Organisation
(WHO). The primary change that was occurred due to this adaptation is the lower cut- off value
for the venous plasma glucose and the new value is 7.0 mmol/L (Diabetes UK 2019). There are
various symptoms available for diabetes such as unexplained and rapid weight loss, polydipsia,

3GLUCOSE TOLERANCE ASSAY
and polyuria which can be employed to diagnose diabetes. Diagnosis test for diabetes can be
performed in three way and these three test are fasting plasma glucose concentration, random
venous plasma glucose concentration and two hour plasma glucose concentration. From the
above discussion, it can be inferred that the determination of glucose level is essential in case of
diagnosis for the diabetes (Diabetes UK 2019). Therefore, in this investigation, an experimental
procedure will be conducted to calculate the glucose concentration from unknown samples and
interpretation of the readings glucose tolerance level.
Materials:
Following materials, instruments, and equipment were used during the experiment process:
o Test tubes and test tube racks
o Spectrophotometer
o Cuvettes (capacity 1 ml) and cuvettes holder
o Parafilm squares
o Stop watches
o Beaker and Virkon bowl for cuvettes
o 1 ml standard reagent for Quality Control
o P20, P100, and P1000
o 30 ml Randox made Glucose reagent
o 25 ml Glucose standard.
Plasma samples were collected from the patient twice during the oral glucose tolerance test; one
at the beginning of the experiment and one at the end of 120 minutes. Additionally, for the
patient 4, ten readings were collected at 120 minutes for the calculation of standard deviation.
Secure Best Marks with AI Grader
Need help grading? Try our AI Grader for instant feedback on your assignments.

4GLUCOSE TOLERANCE ASSAY
Methods:
Preparation of standard curve from standard glucose solution using spectrometer
First, a blank sample was created for the spectrometer and blank was prepared using 12.5 μl of
buffer with 1 ml of glucose reagent. After that 6 samples was prepared for the construction of the
standard curve. Six known concentration was used for this step and they are 3 mM, 6 mM, 7
mM, 10 mM, 11 mM, and 12 mM. These concentrations were prepared from 100 mM standard
glucose solution by dilution method and dilutions were performed using distill water. Before the
measurement of the absorbance, samples were incubated at the room temperature for the
development of the color. Absorbance of the samples were measured at the 500 nm. For
validation of the standard curve, a known concentration of 10 mmol/L was used and the
acceptable range was set at 9.2 to 10.8 mmol/L.
Preparation and assessment of patients’ samples
Total eight samples were collected from the four patient. Samples were collected twice at 0
minute and at 120 minute from the each patient. 0.5 ml of blood sample were collected from the
each patient for each sampling points. After measuring the data, samples were rinsed down the
sink and tubes were discarded in the normal waste bin. Absorbance readings of the collected
samples were measured using spectrophotometer and glucose concentrations were calculated
using the standard curve.
Calculation of standard deviation
To calculate the accuracy of the collected data, standard deviation was collected from the ten
readings measured from patient four at 120 minutes. Standard deviation was calculated using the
following formula:

5GLUCOSE TOLERANCE ASSAY
√ ¿
Where, S denotes the Standard Deviation of the sample
X denotes the each readings of the data collected from patient four
X denotes the mean of the collected data
Σ denotes the sum of the values
N denotes the number of values in the data set.
Results:
To calculate the glucose level (mM) in the four patients a standard curve was constructed. The
standard curve was constructed using the data presented in the Table 1 below.
Table 1: Glucose and Absorbance value which were used for the construction of the standard
curve.
Glucose (mM) Absorbance
3 0.219
6 0.451
7 0.532
10 0.791
11 0.842
12 0.929
Using the data presented in the Table 1, a standard curve has been constructed and the
constructed standard curve is depicted in the Figure 1.

6GLUCOSE TOLERANCE ASSAY
2 4 6 8 10 12 14
0
0.1
0.2
0.3
0.4
0.5
0.6
0.7
0.8
0.9
1
f(x) = 0.0793371104815865 x − 0.0205864022662892
R² = 0.998732036586502
Standard Curve
Glucose (mM)
Absorbance
Figure 1: Constructed standard curve using the readings obtained from Table 1.
From the Figure 1, the equation, Y = 0.079X – 0.020 has been obtained where Y = Absorbance
and X = Glucose level in mM.
The above standard curve was validated using the Quality Control sample of known
concentration 10 mmol/L. The absorbance result were put in to the above equation and the
resultant glucose concentration was obtained at 9.89 mM. This value is pretty close to the
original 10 mmol/L concentration and within the acceptable range (9.2 to 10.8 mmol/L) set at the
start of the experiment. Hence, it can be assumed that the standard curve is valid and the
difference in the concentration can be considered as experimental error.
The above mentioned equation was used to calculate the glucose level in the four patients. For
the four patients, absorbance was collected at 0 minutes and at 120 minutes and corresponding
glucose levels were calculated using the fore mentioned formula obtained from the constructed
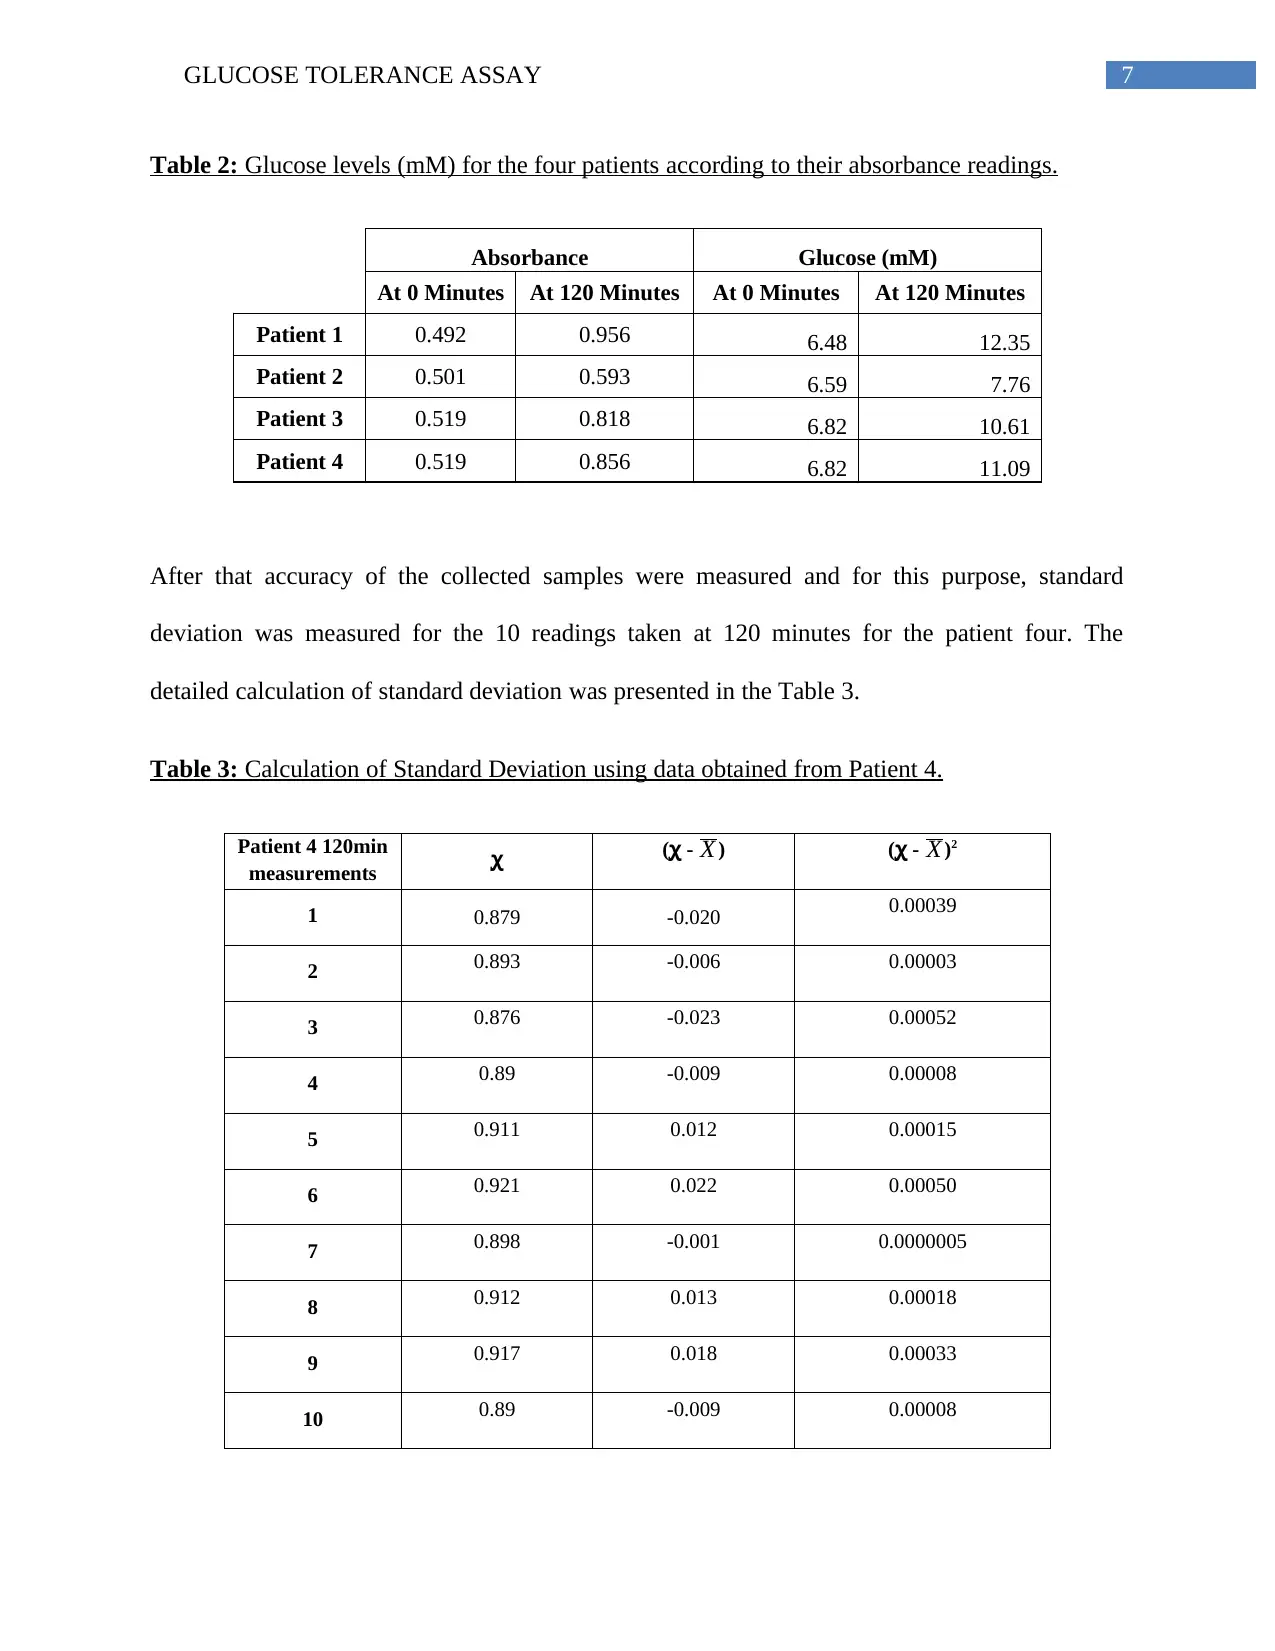
standard curve. The calculated glucose levels for the four patients are presented in the Table 2.
Paraphrase This Document
Need a fresh take? Get an instant paraphrase of this document with our AI Paraphraser

7GLUCOSE TOLERANCE ASSAY
Table 2: Glucose levels (mM) for the four patients according to their absorbance readings.
Absorbance Glucose (mM)
At 0 Minutes At 120 Minutes At 0 Minutes At 120 Minutes
Patient 1 0.492 0.956 6.48 12.35
Patient 2 0.501 0.593 6.59 7.76
Patient 3 0.519 0.818 6.82 10.61
Patient 4 0.519 0.856 6.82 11.09
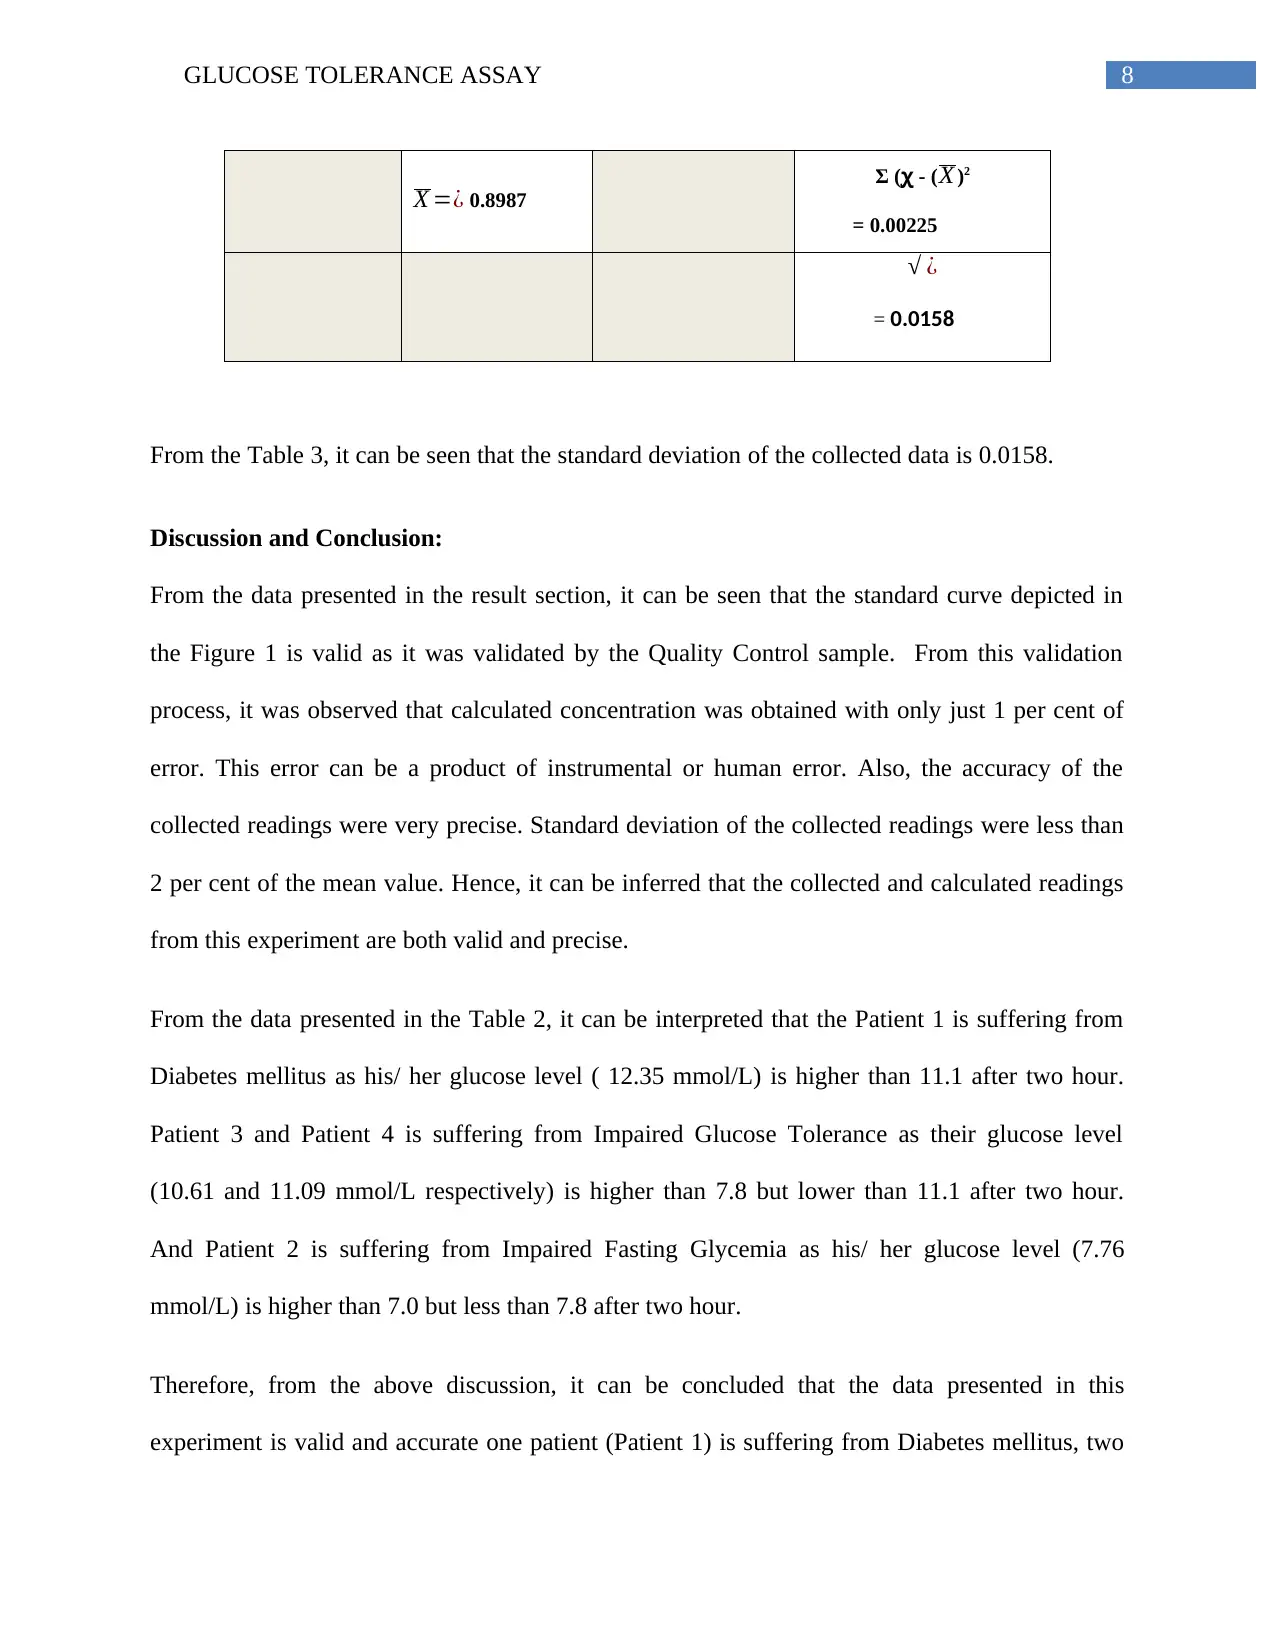
After that accuracy of the collected samples were measured and for this purpose, standard
deviation was measured for the 10 readings taken at 120 minutes for the patient four. The
detailed calculation of standard deviation was presented in the Table 3.
Table 3: Calculation of Standard Deviation using data obtained from Patient 4.
Patient 4 120min
measurements ꭕ ( -ꭕ X ) ( -ꭕ X )2
1 0.879 -0.020 0.00039
2 0.893 -0.006 0.00003
3 0.876 -0.023 0.00052
4 0.89 -0.009 0.00008
5 0.911 0.012 0.00015
6 0.921 0.022 0.00050
7 0.898 -0.001 0.0000005
8 0.912 0.013 0.00018
9 0.917 0.018 0.00033
10 0.89 -0.009 0.00008

8GLUCOSE TOLERANCE ASSAY
X =¿ 0.8987
Σ ( - (ꭕ X )2
= 0.00225
√ ¿
= 0.0158
From the Table 3, it can be seen that the standard deviation of the collected data is 0.0158.
Discussion and Conclusion:
From the data presented in the result section, it can be seen that the standard curve depicted in
the Figure 1 is valid as it was validated by the Quality Control sample. From this validation
process, it was observed that calculated concentration was obtained with only just 1 per cent of
error. This error can be a product of instrumental or human error. Also, the accuracy of the
collected readings were very precise. Standard deviation of the collected readings were less than
2 per cent of the mean value. Hence, it can be inferred that the collected and calculated readings
from this experiment are both valid and precise.
From the data presented in the Table 2, it can be interpreted that the Patient 1 is suffering from
Diabetes mellitus as his/ her glucose level ( 12.35 mmol/L) is higher than 11.1 after two hour.
Patient 3 and Patient 4 is suffering from Impaired Glucose Tolerance as their glucose level
(10.61 and 11.09 mmol/L respectively) is higher than 7.8 but lower than 11.1 after two hour.
And Patient 2 is suffering from Impaired Fasting Glycemia as his/ her glucose level (7.76
mmol/L) is higher than 7.0 but less than 7.8 after two hour.
Therefore, from the above discussion, it can be concluded that the data presented in this
experiment is valid and accurate one patient (Patient 1) is suffering from Diabetes mellitus, two

9GLUCOSE TOLERANCE ASSAY
patient (Patient 3 and 4) is suffering from Impaired Glucose Tolerance, and last patient (Patient
2) is suffering from Impaired Fasting Glycemia.
patient (Patient 3 and 4) is suffering from Impaired Glucose Tolerance, and last patient (Patient
2) is suffering from Impaired Fasting Glycemia.
Secure Best Marks with AI Grader
Need help grading? Try our AI Grader for instant feedback on your assignments.

10GLUCOSE TOLERANCE ASSAY
References:
Bonner, C., Kerr-Conte, J., Gmyr, V., Queniat, G., Moerman, E., Thévenet, J., Beaucamps, C.,
Delalleau, N., Popescu, I., Malaisse, W.J. and Sener, A., 2015. Inhibition of the glucose
transporter SGLT2 with dapagliflozin in pancreatic alpha cells triggers glucagon
secretion. Nature medicine, 21(5), p.512.
Diabetes UK 2019. Diagnostic criteria for diabetes. Diabetes UK. Available at:
https://www.diabetes.org.uk/professionals/position-statements-reports/diagnosis-ongoing-
management-monitoring/new_diagnostic_criteria_for_diabetes [Accessed 23 Feb. 2019].
Jakubowicz, D., Wainstein, J., Ahren, B., Landau, Z., Bar-Dayan, Y. and Froy, O., 2015. Fasting
until noon triggers increased postprandial hyperglycemia and impaired insulin response after
lunch and dinner in individuals with type 2 diabetes: a randomized clinical trial. Diabetes
Care, 38(10), pp.1820-1826.
Ortiz, A., Fernandez, E., Alvarez, F., Santacruz, E., Rosillo, M., Escobar, H. and Luque, M.,
2018, May. Oral glucose tolerance test vs fasting plasma glucose determination for the
assessment of glucose metabolism disturbances in women with Polycystic Ovary Syndrome.
In 20th European Congress of Endocrinology (Vol. 56). BioScientifica.
Varni, J.W., Delamater, A.M., Hood, K.K., Raymond, J.K., Driscoll, K.A., Wong, J.C., Adi, S.,
Joyce, P., Grishman, E.K., Faith, M.A. and Corathers, S.D., 2018. Diabetes symptoms predictors
of health-related quality of life in adolescents and young adults with type 1 or type 2
diabetes. Quality of Life Research, 27(9), pp.2295-2303.
1 out of 11
Related Documents
Your All-in-One AI-Powered Toolkit for Academic Success.
+13062052269
info@desklib.com
Available 24*7 on WhatsApp / Email
![[object Object]](/_next/static/media/star-bottom.7253800d.svg)
Unlock your academic potential
© 2024 | Zucol Services PVT LTD | All rights reserved.


