Wilcoxon Signed Ranks Test Application
VerifiedAdded on 2021/04/17
|20
|5891
|40
AI Summary
The provided document presents an analysis of a Wilcoxon Signed Ranks test. The test was conducted to compare pretest and posttest scores in a research setting. The results showed a significance value of 0.146, indicating that the null hypothesis could be accepted. The analysis provides insights into the application and interpretation of the Wilcoxon Signed Ranks test in statistical research.
Contribute Materials
Your contribution can guide someone’s learning journey. Share your
documents today.

Unit V, Part 2 Work Sheet &Take Home
Exam
Student Name: Student ID:
Subject Name: Subject ID:
Due Date: Apr 3
1
Exam
Student Name: Student ID:
Subject Name: Subject ID:
Due Date: Apr 3
1
Secure Best Marks with AI Grader
Need help grading? Try our AI Grader for instant feedback on your assignments.
Section 2: Analyzing the Data
Parametric & Nonparametric Procedures
1. a. Parametric tests:
Parametric tests are those statistical tests which are based on postulations of the population. The
population parameters are taken as the basis of parametric test and null hypotheses are formed
based on those parameters(Corder, 2014).Hypotheses are constructed on the basis of equal mean
or equal variances. t- Test is one of the examples of parametric test which assume the normality of
population data.
b. Nonparametric tests:
Nonparametric tests do not assume any analytically strict conditions about the population. Non
parametric tests are more concerned about the order or rank of data instead of mean and variance.
Hence focus for these tests are not on the probability distribution of the population. Few examples
of non-parametric tests are Mann-Whitney test, Wilcoxon Signed-Rank test and Kruskal-Walis
test(Gibbons, 2011).
2. Seven common characteristics of Parametric Tests:
a. Sample data are collected from population observations independent in nature.
b. Collected sample data are normally distributed.
c. Population variancefor two or more groups has equal values.
d. Sampling technique is random in nature from a well-defined population.
e. Measurement of sample data is in ratio or interval scale.
f. Parametric tests compare sample means as a measure of central tendency.
g.Parametric tests compare two samples of equal sizes.
3. Examples of a Parametric Test:
ANS: Independent sample t-test, chi-square test are two examples of Parametric test(Hart, 2001).
4. Six common characteristics of Nonparametric Tests:
a. Non parametric tests are applicable to data in nominal or ordinal scale.
b. Probability distribution of the population is not required in non-parametric tests.
c. Non parametric tests use median as a measure of central tendency to compare between the
samples.
d. Rank of the sample data are used in non-parametric tests.
e.Parameter values for the population data are not required in non-parametric tests.
2
f. Single assumption is independent observation with identical distribution of population data.
5. Examplesof Nonparametric Tests:
ANS: Three examples are Kruskal-Walis test, Mann-Whitney test and Wilcoxon Signed-Rank
test.
Chapter 5
1. Independent t Test:
ANS: The population data for independent t-test is assumed to follow normal
distribution.Independent sample t-test is a parametric test, which compares sample means as a
measure of central tendency between two independent samples(Samuels, 2012). The dependent
variables are hypothesized to have the same variances.
2. Mann-Whitney U-Test:
ANS: Mann-Whitney U-Test is non-parametric test. The basic requirements are similar to a t-test.
Medians of two populations are compared by the help of this test. Ordinal data is used for the test
with a sample size of five to twenty.
3. Choosing between the Independent Test and the Mann-Whitney U-Test
The Independent t test can be used when:
a. The population data is normally distributed.
b. Comparison between two independent sample means has to be done.
c. It is hypothesized that Variances of the two groups under observation are equal.
The Mann-Whitney U-test can be used when:
a. Ordinal variablesare to be measured is.
b. Two groups are tested which are independent.
c. Comparison of medians and differences in spread are done for two samples.
d. Observations of each group are independent in nature within the group.
4. Research question(s) Independent Samplest-test and the Mann-Whitney U-test address
ANS: Both the tests assumes that the observations of the study are independent in nature and
statistically infers whether two populations are significantly different or not. For normally
distributed populations t-test compares means of the populations(Pituch, 2013). Medians of two
populations are compared by Mann-Whitney U-test if the populations under the study are
normally distributed.
5. Assumptions for the Independent Samplest-test:
a. Observations of the population must be independent in nature.
b. The dependent variable should be normally distributed in the population data.
3
c. Variances of the variable for two populations should be equal.
6. Example of a Null and Alternative Hypothesis for the Independentt-test:
a. H0: Mean score of mathematics and statistics are equal for class X 2017 batch. (Null)
b. H1: Mean score of mathematics is greater than mean score of statistics in class X (one tail
test) 2017 batch.
7. Conceptual understanding of the Independent Samplest-Test:
ANS: Populations are assumed to be infinite in size and follow normal distribution which is
inferred from the law of large numbers. The t-statistic is used instead of z-statistic when
population variance is unknown. Statistical inference about population characteristics are drawn
by comparing population means(Balducci, 2010). In comparison of two samples t-test is used to
find the information about the population, which is whether the samples are from same or
different populations.
8. For sample size with the t test the following must be determined:
a. Power of the test under study.
b.Probability of Type-I error of the study associated with the null hypothesis.
c. Probability of Type-II error of the study.
d. Relation between power and type-II error of the study.
9. Null and Alternative Hypothesis for the Mann-Whitney U-Test:
a. H0: Median of scores for mathematics and statistics are equal for class X 2017 batch.
(Null)
b. H1: Median of scores for mathematics is greater than mean score of statistics in class X
(one tail test) 2017 batch.
10. Conceptual understanding of the Mann-Whitney U-Test:
ANS: The Mann-Whitney U test is based on the relative ranks of the measurements in each group.
The difference in population distributions are assessed by comparing the medians of the
populations.
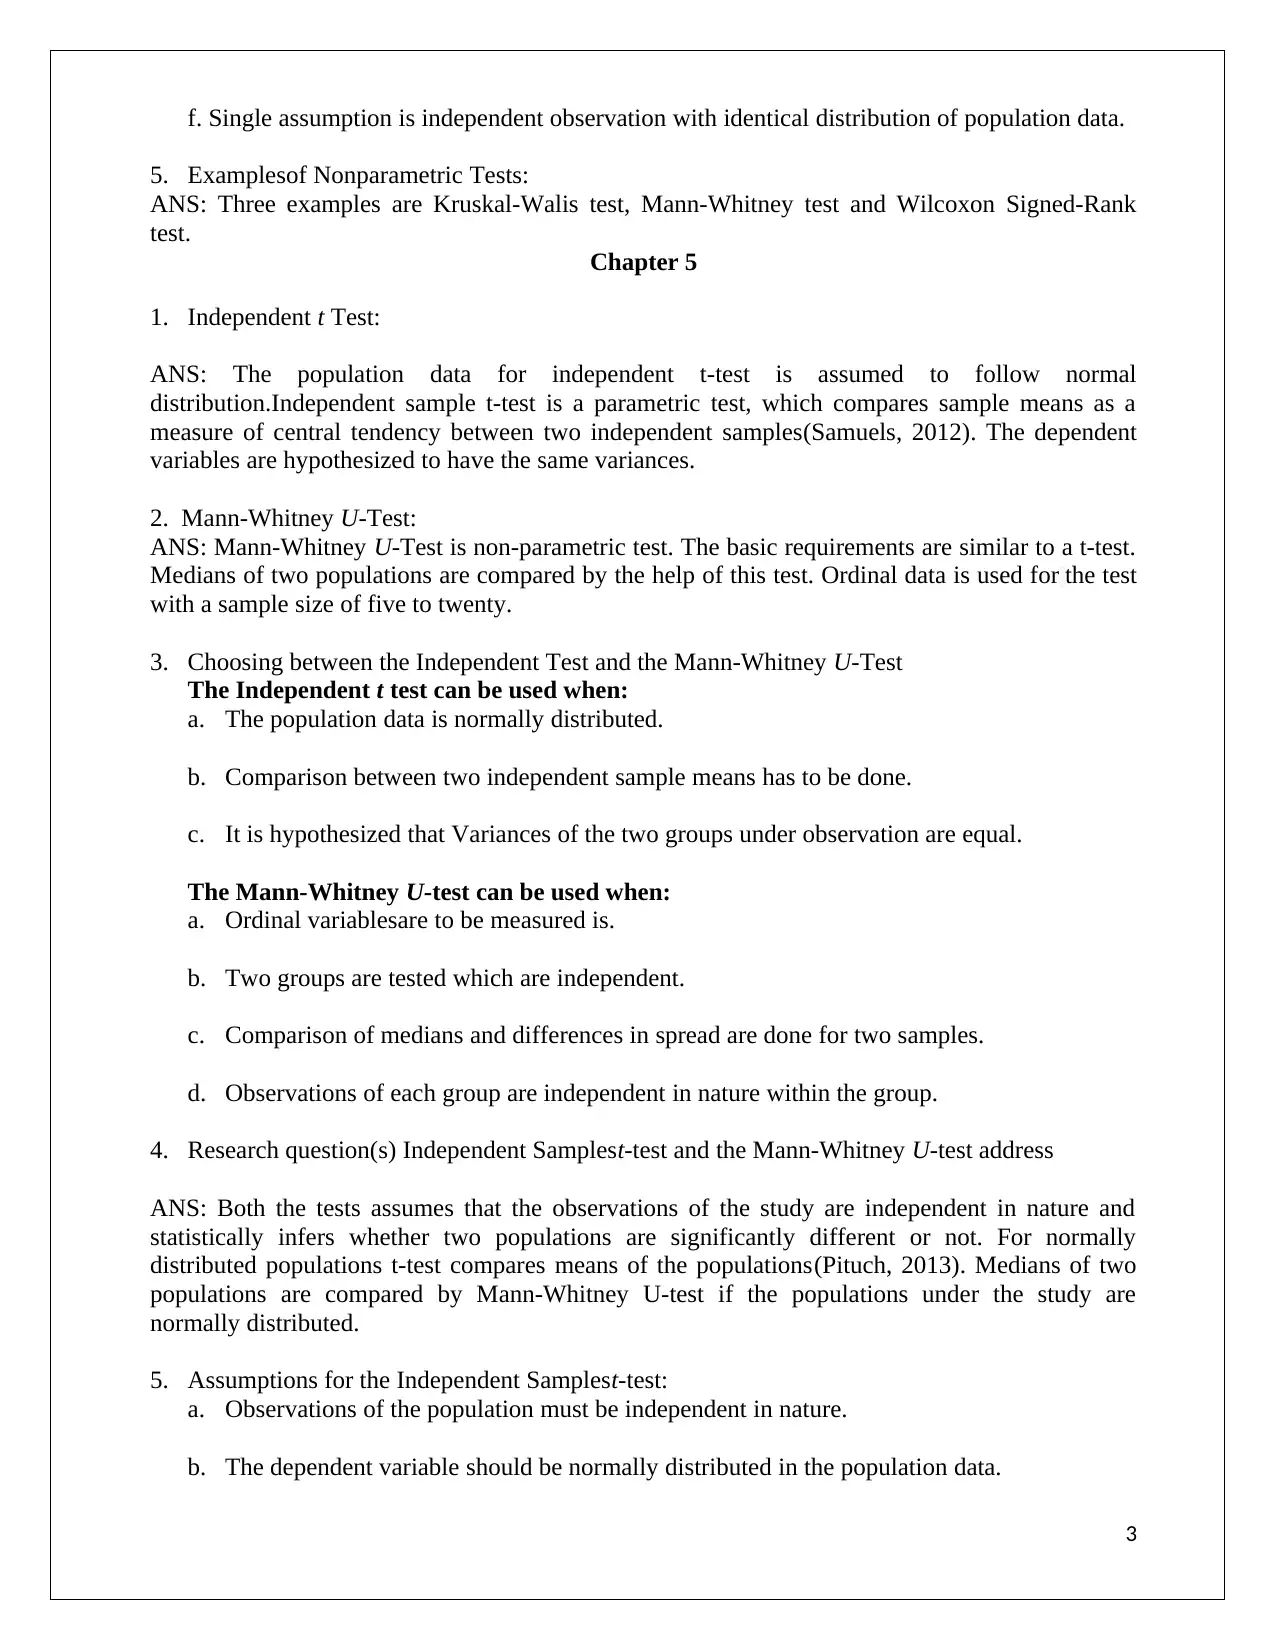
11. Significance of a one-tailed test:
ANS: In one-tailed test the critical region is set in any one of the tail of the probability curve. The
alpha value of the critical region of the test is assigned in either left or right tail(Hair, 2011). The
probability of the association is tested in either greater (right tail) or lesser (left tail) direction of
the probability curve.
Figure 1: Left and Right tail test alpha distribution
4
6. Example of a Null and Alternative Hypothesis for the Independentt-test:
a. H0: Mean score of mathematics and statistics are equal for class X 2017 batch. (Null)
b. H1: Mean score of mathematics is greater than mean score of statistics in class X (one tail
test) 2017 batch.
7. Conceptual understanding of the Independent Samplest-Test:
ANS: Populations are assumed to be infinite in size and follow normal distribution which is
inferred from the law of large numbers. The t-statistic is used instead of z-statistic when
population variance is unknown. Statistical inference about population characteristics are drawn
by comparing population means(Balducci, 2010). In comparison of two samples t-test is used to
find the information about the population, which is whether the samples are from same or
different populations.
8. For sample size with the t test the following must be determined:
a. Power of the test under study.
b.Probability of Type-I error of the study associated with the null hypothesis.
c. Probability of Type-II error of the study.
d. Relation between power and type-II error of the study.
9. Null and Alternative Hypothesis for the Mann-Whitney U-Test:
a. H0: Median of scores for mathematics and statistics are equal for class X 2017 batch.
(Null)
b. H1: Median of scores for mathematics is greater than mean score of statistics in class X
(one tail test) 2017 batch.
10. Conceptual understanding of the Mann-Whitney U-Test:
ANS: The Mann-Whitney U test is based on the relative ranks of the measurements in each group.
The difference in population distributions are assessed by comparing the medians of the
populations.
11. Significance of a one-tailed test:
ANS: In one-tailed test the critical region is set in any one of the tail of the probability curve. The
alpha value of the critical region of the test is assigned in either left or right tail(Hair, 2011). The
probability of the association is tested in either greater (right tail) or lesser (left tail) direction of
the probability curve.
Figure 1: Left and Right tail test alpha distribution
4
Secure Best Marks with AI Grader
Need help grading? Try our AI Grader for instant feedback on your assignments.
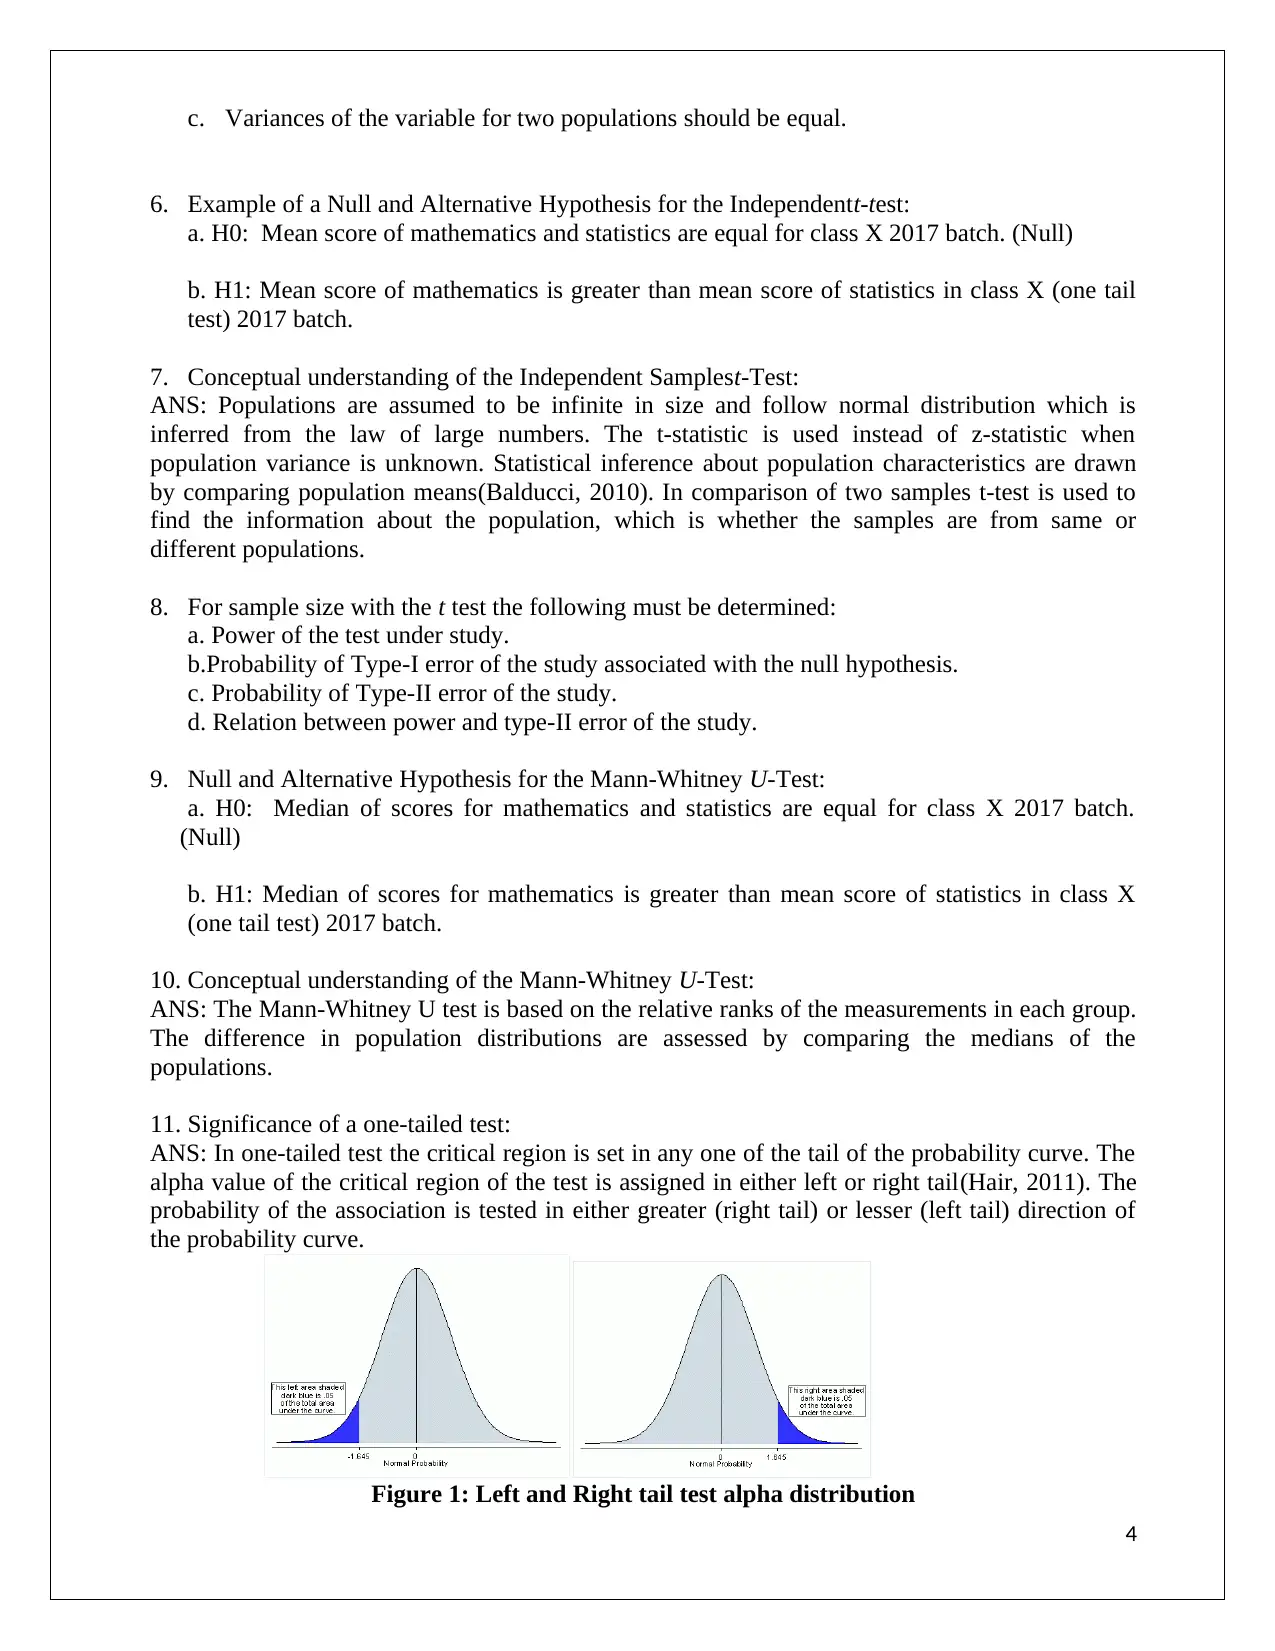
12. Significance of two-tailed test:
ANS: Two-tailed test distributes the alpha value equally in both the tails. If the level of
significance is 5% then alpha value of 0.05 is distributed in both tails as 0.025. In two-tailed test
the alternate hypothesis tests the probability of sample mean being greater or less than that of
population mean. This is a two directional test method.
Figure 2: Two-tailed test alpha value distribution
Critical Thinking
(Note article by Wali &Wali)
1. The aim of this study is:
ANS: The aim of the study was to underline the relationship among lipid profile, BMI, glucose,
HbA1c and leptin levels in patients with STs(Wali, 2016).
2. The design of the study is:
ANS: The design of the study was controlled study based on the samples taken from a tertiary
care hospital in south India from April 2013 to May 2014.
3. Inclusion criterion for this study:
ANS: The patients with at least three STs were chosen for the study.
4. Exclusion criteria for the subjects:
a. Patient who was on scheduled medicines that could affect the level of glucose metabolism
or leptin levels were excluded.
b. Patients with irregular lipid profile were excluded. Possible reasons were diabetes mellitus,
gastroentropathy, mal absorptive disorders and hepatic diseases.
c. Patients with liver or kidney disease were excluded. Some of the patients with
endocrinopathies such as acromegaly or Cushing’s syndrome and other medical disorders
were also excluded.
d. The study also excluded pregnant women and lactating mothers.
5. Parameters measured and level of measurement:
a. Waist circumference, Height and weight of the patients were measured.BMI level was
evaluated as a ratio of weight (in kg) and square of height (in meters).
b.By the help of an enzyme related immune-sorbent assay leptin serum level was calculated.
5
c. Total triglycerides (TG) and serum total cholesterol (TC) and were measured by an
enzymatic method
d. After applying enzymatic method, Serum high density lipo-protein (HDL) and Serum low
density lipo-protein (LDL) were found by phosphotungstate precipitation.
6. Statistical analysis procedures for the study:
ANS:Two tailed independent student’s t-test was used for analysis in the study. the analysis was
done using SPSS software platform.
7. Step 1: Null and Alternative Hypotheses for this article:
Ho: ST cases and control group have same mean values of the study parameters.
HA:ST cases and control group have significantly different mean values of study parameters.
8. Step 2: The significance level (a-level), degrees of freedom and the critical value:
a. The a-level is: 0.05
b. The total degrees of freedom are __124___ (n1+n2-2 ___)
9. Patients were screened __171____. Patients satisfied the criteriafor inclusion ___126___.
10. Summarization of the major findings of the study:
ANS: There was significant relation of STs with some of the parameters. The significantly
associated parameters were Leptin levels, LDL, VLDL and Triglycerides. Other parameters such
as glucose levels, HDL and BMI had statistically insignificant relation with STs of the patients.
11. Study limitations:
ANS: Insulin level of the patients was not measured. The samples were not collected at the different
collection centres. Only one collection centre had been used to collect raw data and the sample size was
also small.
Critical Thinking
(Note article by Tsai)
1. ANS: The aim/objective of this study was to analyze the effect of research utilization training.
An eight week course was conducted for the nurses, which was based on research utilization
training.
2. Description of the design of this study:
ANS: The research work included eighty nine participants who completed the initial six months of
course work successfully. Their age and educational level were noted down and later matched
with that of the control group. The participants went through an eight week research utilization
course. The sixty five hour course work was divided into three stages(Tsai, 2003). Research
participation and utilization based questionnaire were distributed to participants and their
approach toward nursing was recorded.
3. Selection criteria for the study subjects:
6
ANS: The selection criterion was based on marks obtained in the questionnaire by Tsai et al.
(1998b).
4. Description of the study procedure:
ANS: Experimental group participated in an eight week (2 month) at the medical center. The
course was a classroom program based on research utilization. The subjects were tested at the
beginning, immediately after the course completion and finally six months after the course
completion.
5. Research tools:
ANS: Structured questionnaires were used which covered five sections of the study.
6. Number of enrollments in the study and how many completed the study:
ANS: One hundred and five participated in the study and after successful completion of six
months of coursework eighty nine of them completed the study.
7. Statistical analysis procedures used for this study:
ANS: Mann-Whitney U –test and repeated measure ANCOVA were used for statistical
analysis(Nachar, 2008).
8. Step 1: Null and Alternative Hypotheses for this article:
1. Ho:Research utilization course attending nurses and control group had equalamount of positive
attitude toward nursing research.
HA:Research utilization course attending nurses had more positive attitude toward nursing
research compared to control group.
2. Ho: Research utilization course attending nurses and control group had equal amount of
support for nursing research.
HA:Research utilization course attending nurses had more support toward nursing research
compared to control group.
3. Ho: Research utilization course attending nurses and control group had equal score of
participation for nursing research.
HA:Research utilization course attending nurses had more score of participation toward nursing
research compared to control group.
4. Ho: Research utilization course attending nurses and control group had equal score of research
utilization for nursing research.
HA:Research utilization course attending nurses had more score of research utilization toward
nursing research compared to control group.
7
Paraphrase This Document
Need a fresh take? Get an instant paraphrase of this document with our AI Paraphraser
9. Step 2: Significance level (a-level) for this study.
a. The a-level was 0.05
10. Description and discussion of the results of the Mann-Whitney U-test:
ANS: Mann-Whitney U-test revealed that no significant difference was there between
experimental and control group as p-value was greater than 0.05 (z = -0.7). The second and third
stages of the study were significantly performed better by experimental group compared to control
group with p-value less than 0.05.
11. Study limitations:
ANS: Short duration of the study and probable biasness of the institution towards research utilization
were the limitations of the study.
Chapter 6
1. Paired t Test:
ANS: Paired t-test is used for several pairs of observations where only a single measurement
variable and two nominal variables are present(Strong, 2014). Paired t-test hypothesizes the mean
difference for the pair of observations as zero.
2. Define the Wilcoxon Matched-Pairs Rank Test:
ANS: Wilcoxon Matched-Pairs Rank Test is a non-parametric test which compares sample
median with hypothetical population median. Difference of each pair along with the sign of the
difference is noted and ranked. The ranks are then used to compute the test statistic ( z ~ N ( 0,1 )
3. a. Type of data required for the Paired tTest:
ANS: Two sets of Nominal data from normally distributed sampling distribution (for mean
difference) are required for paired t-test.
b. Type of data required for the Wilcoxon Matched-Pairs Test:
ANS: For Wilcoxon Matched-Pairs Test the data should come from a symmetrical distribution of
the differences for the pairs of observations ordinal in nature(Woolson, 2008).
4. Choosing between the Paired tTest and the Wilcoxon Matched-Pairs Test
The paired t test can be used when:
a. Sampling distribution for mean difference is approximately normally distributed.
b. Selection is unbiased or random.
c. Sample data has no inaccurate values.
The Wilcoxon Matched-Pairs Signed Rank Test
a. Sampling distribution for mean difference is severely not normally distributed
b. Sampling distribution of the differences for the pairs of observation is symmetric.
c. Paired differences and signs of paired differences can be given rank.
8
5.Research question(s)answered by Paired tTest and the Wilcoxon Matched-Pairs Signed
Rank Test:
ANS: Both the tests analyses a sample with paired data to test whether they originated from a
population of specific mean or median.
6. Assumptions for the Pairedt Test and the Wilcoxon Matched-Pairs Test:
ANS: Paired t Test assumes that sampling distribution for mean difference is approximately
normally distributed and sample selection is unbiased or random without any inaccuracy.
Wilcoxon Matched-Pairs Test assumes that sampling distribution of the differences for the pairs
of observation is symmetric and paired differences are independent.
7. Example of a Null and Alternative Hypothesis for the PairedtTest:
ANS: H0: Diabetic patients respond do not change when treatment A is imparted.
HA: Diabetic patients respond significantly positive when treatment A is imparted
8. Conceptual understanding of the Paired tTest:
ANS: Paired t-test is nothing but one sample t-test which takes the difference of paired
observation as sample data.
9. Conceptual understanding of the Wilcoxon Matched-Pairs Signed Rank test:
ANS: Wilcoxon Matched-Pairs Signed Rank test is similar to a paired t-test where the difference
of paired observations is symmetric but not normal. Difference along with their signs are ranked
and used for calculation of test statistic which is normal in nature.
Critical Thinking
(Note article by Kim, Junes & Song)
1. The aim/purpose of the study is:
ANS: The aim of the study was to make elderly women habitual to examine changes in health performance
and cardiovascular risk factors along with life satisfaction.
2. The design of the study is:
ANS: A pretest-posttest method was used for the apparently experimental group.
3. Selection criteria for the study subjects:
ANS: Subjects were selected based on three criteria. Ability to carry out daily activities without help and
ability to follow lectures in education classes with minimum interaction skills(Kim, 2003). No subjects
having chronic diseases were selected.
4. Measurement instruments used in this study:
ANS: Three instruments namely the life satisfaction scale developed by Choi (1986), a health behavior
scale (Song and Lee, 2001) and a cardiovascular risk factor profile (AHA, 1996) were used.
5. Step 1: Null and Alternative Hypotheses for this article:
ANS: H0: The health promotion program did not have significant effect on the health behaviors of
elderly women
9
HA: The health promotion program had significant positive effect on the health behaviors of elderly
women
6. Step 2: The a-level was 0.05
7. Summarization of the major findings of this study:
ANS: The health program had significant positive effects on all three aspects of elderly women health. All
the three factors had positive changes in their total scores, significant improvement in overall health of
elderly women were also noticed for six weeks.
8. Study limitations:
ANS: Absence of individual cardiovascular training program and comprehensive physiological assessment
program were identified as the limitations.
Critical Thinking
(Note article by Ellis, Charlett& Bendall)
1. The aim of the study is:
ANS: The aim was to test the appropriateness of primary gel separation tubes. The tubes were studied for
the storage of frozen sera proposed for serological testing.
2. Materials and methods:
ANS: The sera were separated from blood samples of 102 patients after collection of blood in gel
separation tubes. The blood sera were later distributed in gel separation and plastic tubes(Ellis, 2004). All
the samples were frozen and studied one year later for anti-rubella IgG concentrations.
3. Selection criteria for the study subjects:
ANS: The patients were randomly selected from adult patients at the genitourinary medicine clinic.
4. Measurement instruments used in this study:
ANS: Vacutainer 3.5 ml Plus SST gel separation tube and 1.8 ml plastic micro tube were used.
5. Step 1: Null and Alternative Hypotheses for this article:
ANS: H0: There is no significant difference in anti-rubella IgG activity between gel sera of gel separation
and plastic tubes.
HA: There is significant difference in anti-rubella IgG activity between gel sera of gel separation and
plastic tubes (two tailed).
6. Step 2: The a-level is: 0.05
7. Major findings of this study:
ANS: The study found that gel separation tubes were a realistic alternative to plastic micro tubes for
freezing blood samples in laboratory. Sera separation costs and sample handling errors were reduced by the
use of gel separation tubes.
8. Limitation of the study:
ANS: Extensive testing procedures and storage problem for large size gel separation tubes were
some limitations of the study.
10
Secure Best Marks with AI Grader
Need help grading? Try our AI Grader for instant feedback on your assignments.
SPSS Exercises for Chapters 5 & 6
Independent t Test
Data Set 1
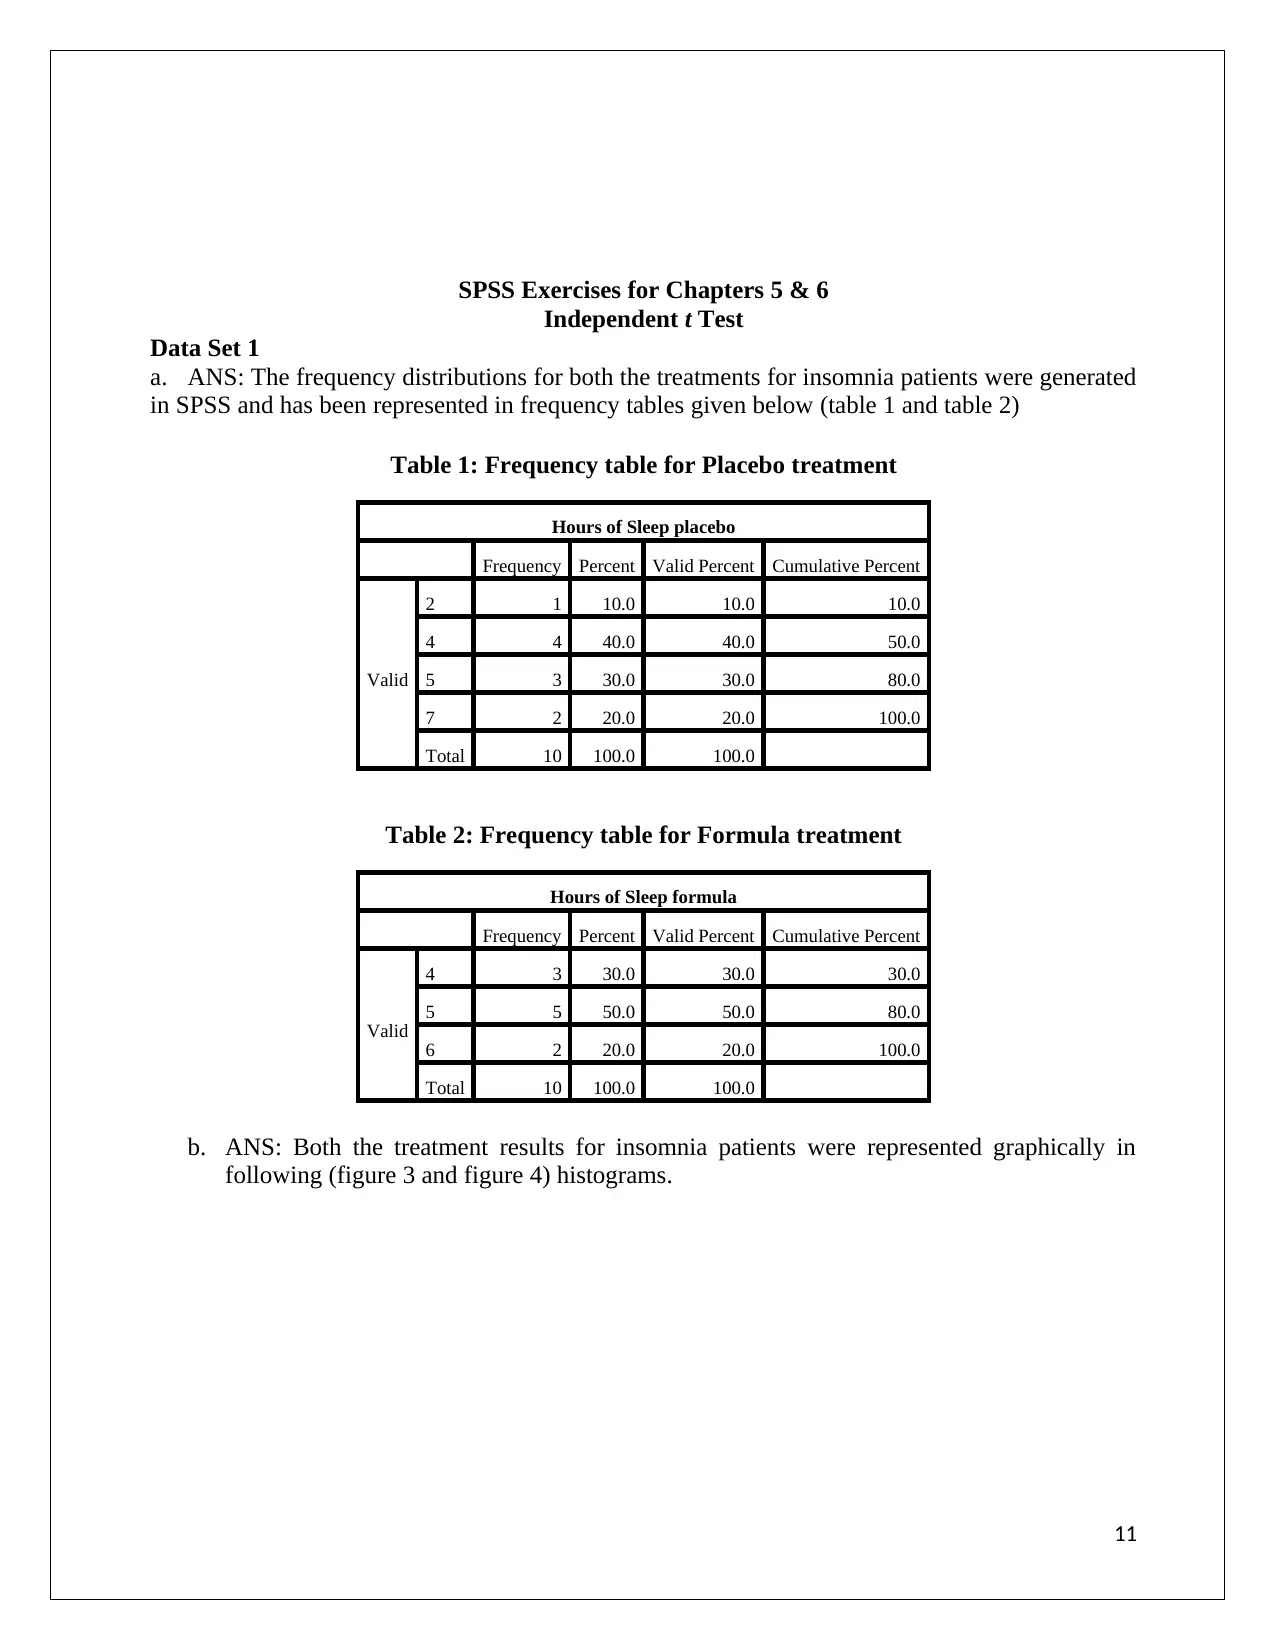
a. ANS: The frequency distributions for both the treatments for insomnia patients were generated
in SPSS and has been represented in frequency tables given below (table 1 and table 2)
Table 1: Frequency table for Placebo treatment
Hours of Sleep placebo
Frequency Percent Valid Percent Cumulative Percent
Valid
2 1 10.0 10.0 10.0
4 4 40.0 40.0 50.0
5 3 30.0 30.0 80.0
7 2 20.0 20.0 100.0
Total 10 100.0 100.0
Table 2: Frequency table for Formula treatment
Hours of Sleep formula
Frequency Percent Valid Percent Cumulative Percent
Valid
4 3 30.0 30.0 30.0
5 5 50.0 50.0 80.0
6 2 20.0 20.0 100.0
Total 10 100.0 100.0
b. ANS: Both the treatment results for insomnia patients were represented graphically in
following (figure 3 and figure 4) histograms.
11
Independent t Test
Data Set 1
a. ANS: The frequency distributions for both the treatments for insomnia patients were generated
in SPSS and has been represented in frequency tables given below (table 1 and table 2)
Table 1: Frequency table for Placebo treatment
Hours of Sleep placebo
Frequency Percent Valid Percent Cumulative Percent
Valid
2 1 10.0 10.0 10.0
4 4 40.0 40.0 50.0
5 3 30.0 30.0 80.0
7 2 20.0 20.0 100.0
Total 10 100.0 100.0
Table 2: Frequency table for Formula treatment
Hours of Sleep formula
Frequency Percent Valid Percent Cumulative Percent
Valid
4 3 30.0 30.0 30.0
5 5 50.0 50.0 80.0
6 2 20.0 20.0 100.0
Total 10 100.0 100.0
b. ANS: Both the treatment results for insomnia patients were represented graphically in
following (figure 3 and figure 4) histograms.
11
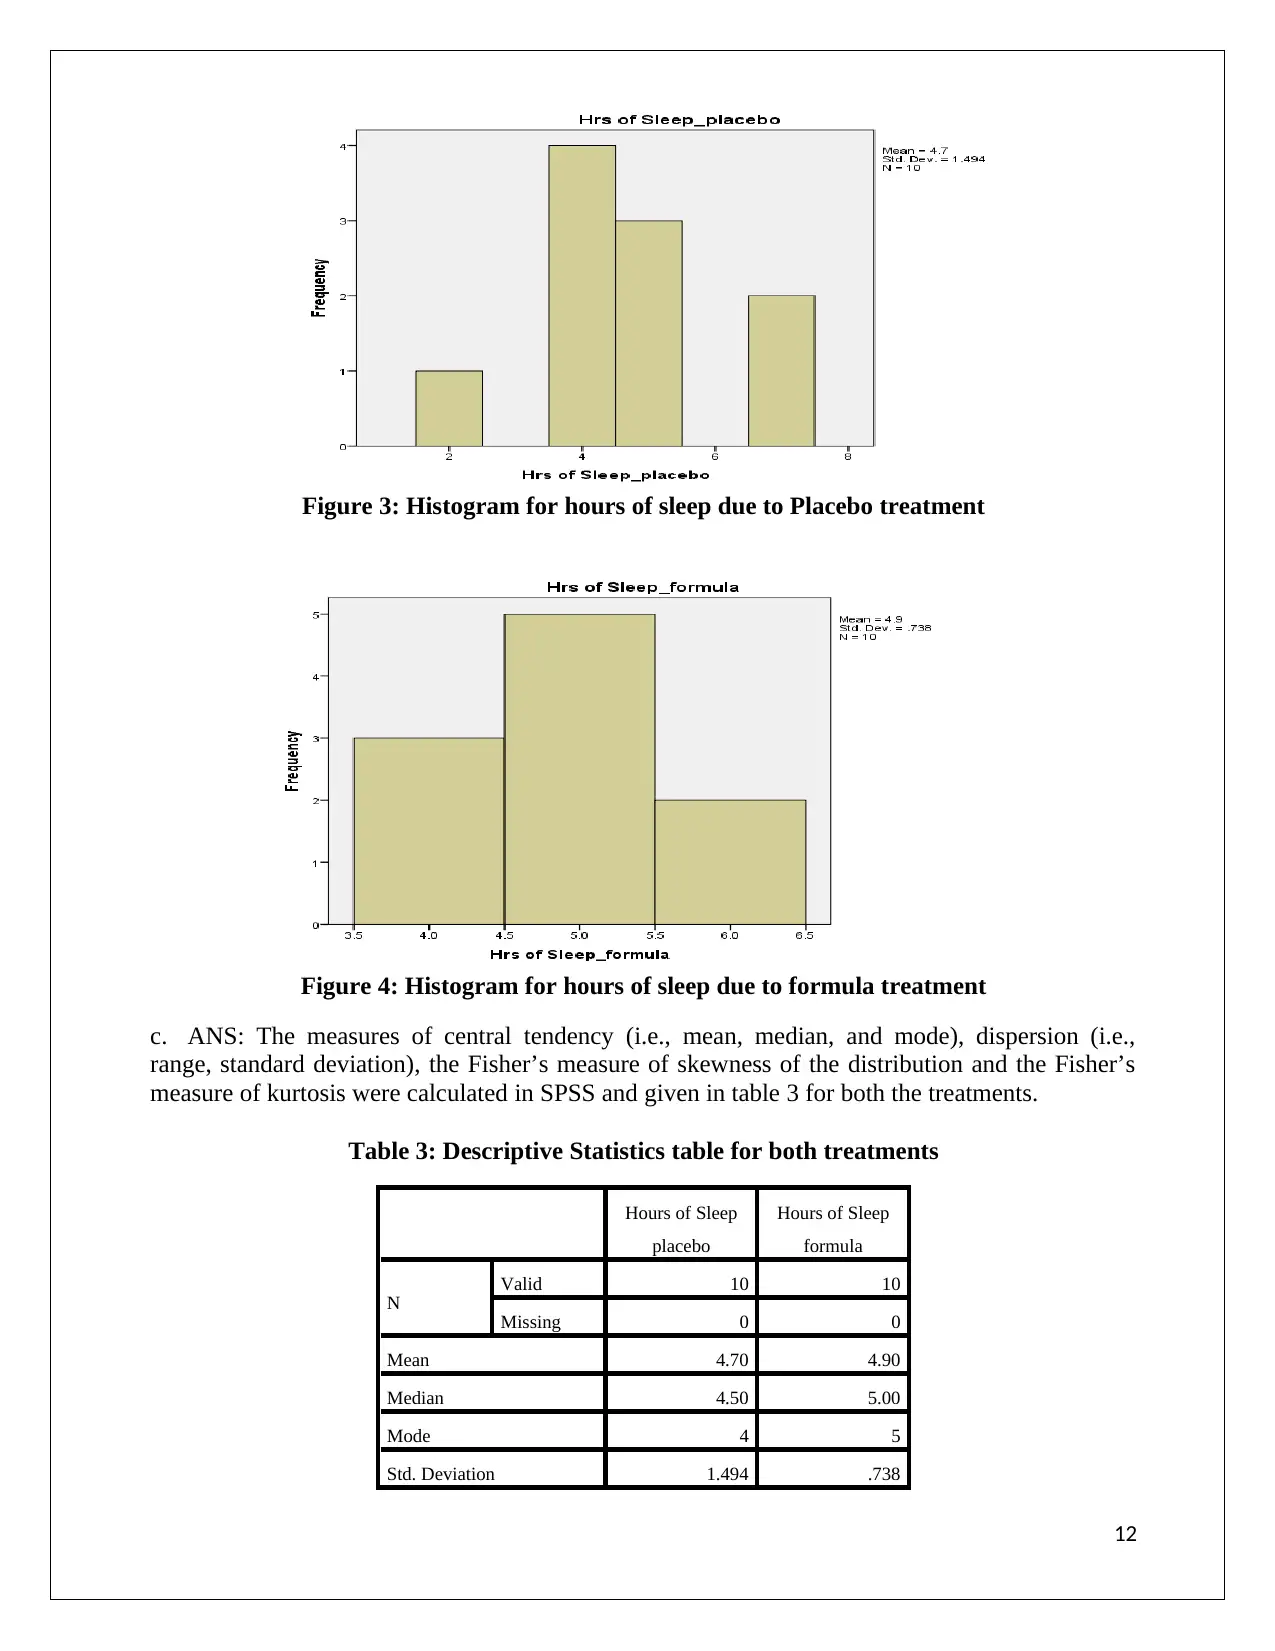
Figure 3: Histogram for hours of sleep due to Placebo treatment
Figure 4: Histogram for hours of sleep due to formula treatment
c. ANS: The measures of central tendency (i.e., mean, median, and mode), dispersion (i.e.,
range, standard deviation), the Fisher’s measure of skewness of the distribution and the Fisher’s
measure of kurtosis were calculated in SPSS and given in table 3 for both the treatments.
Table 3: Descriptive Statistics table for both treatments
Hours of Sleep
placebo
Hours of Sleep
formula
N
Valid 10 10
Missing 0 0
Mean 4.70 4.90
Median 4.50 5.00
Mode 4 5
Std. Deviation 1.494 .738
12
Skewness .140 .166
Std. Error of Skewness .687 .687
Kurtosis .478 -.734
Std. Error of Kurtosis 1.334 1.334
Range 5 2
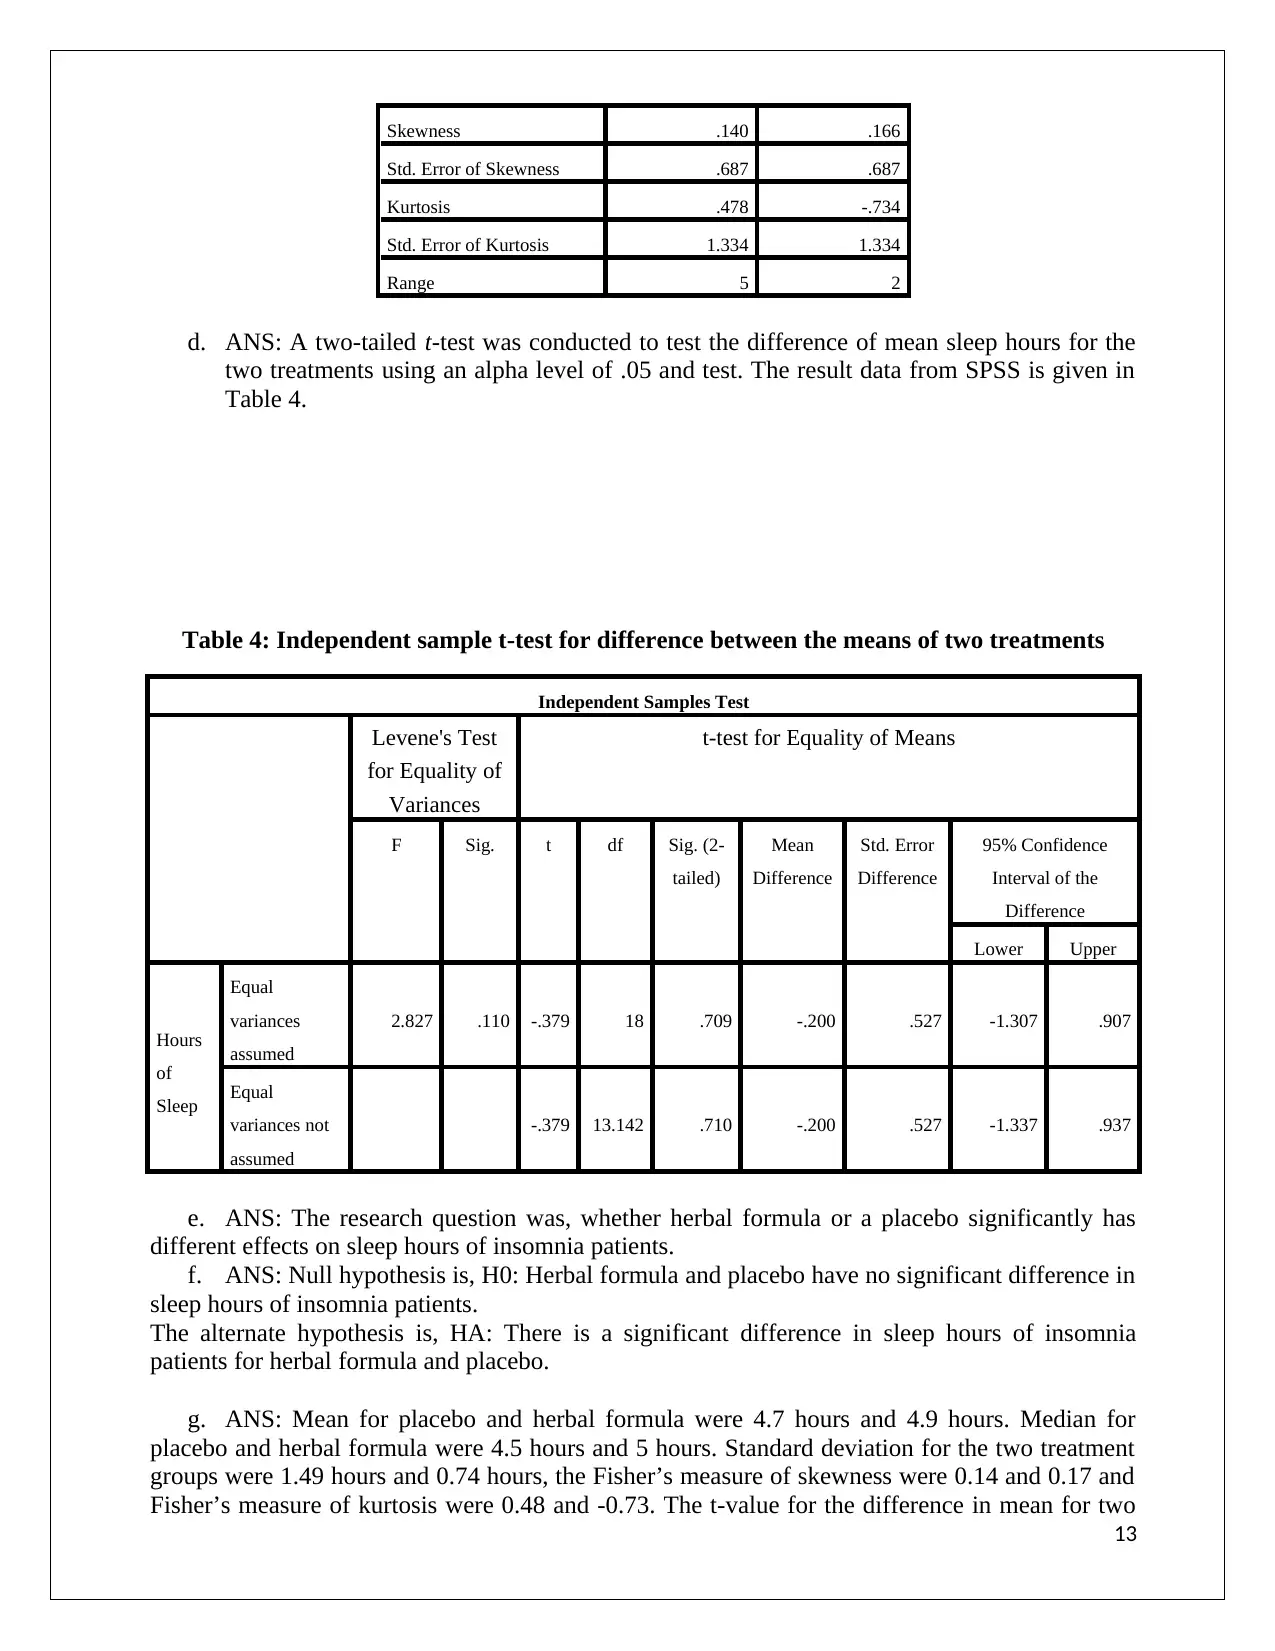
d. ANS: A two-tailed t-test was conducted to test the difference of mean sleep hours for the
two treatments using an alpha level of .05 and test. The result data from SPSS is given in
Table 4.
Table 4: Independent sample t-test for difference between the means of two treatments
Independent Samples Test
Levene's Test
for Equality of
Variances
t-test for Equality of Means
F Sig. t df Sig. (2-
tailed)
Mean
Difference
Std. Error
Difference
95% Confidence
Interval of the
Difference
Lower Upper
Hours
of
Sleep
Equal
variances
assumed
2.827 .110 -.379 18 .709 -.200 .527 -1.307 .907
Equal
variances not
assumed
-.379 13.142 .710 -.200 .527 -1.337 .937
e. ANS: The research question was, whether herbal formula or a placebo significantly has
different effects on sleep hours of insomnia patients.
f. ANS: Null hypothesis is, H0: Herbal formula and placebo have no significant difference in
sleep hours of insomnia patients.
The alternate hypothesis is, HA: There is a significant difference in sleep hours of insomnia
patients for herbal formula and placebo.
g. ANS: Mean for placebo and herbal formula were 4.7 hours and 4.9 hours. Median for
placebo and herbal formula were 4.5 hours and 5 hours. Standard deviation for the two treatment
groups were 1.49 hours and 0.74 hours, the Fisher’s measure of skewness were 0.14 and 0.17 and
Fisher’s measure of kurtosis were 0.48 and -0.73. The t-value for the difference in mean for two
13
Std. Error of Skewness .687 .687
Kurtosis .478 -.734
Std. Error of Kurtosis 1.334 1.334
Range 5 2
d. ANS: A two-tailed t-test was conducted to test the difference of mean sleep hours for the
two treatments using an alpha level of .05 and test. The result data from SPSS is given in
Table 4.
Table 4: Independent sample t-test for difference between the means of two treatments
Independent Samples Test
Levene's Test
for Equality of
Variances
t-test for Equality of Means
F Sig. t df Sig. (2-
tailed)
Mean
Difference
Std. Error
Difference
95% Confidence
Interval of the
Difference
Lower Upper
Hours
of
Sleep
Equal
variances
assumed
2.827 .110 -.379 18 .709 -.200 .527 -1.307 .907
Equal
variances not
assumed
-.379 13.142 .710 -.200 .527 -1.337 .937
e. ANS: The research question was, whether herbal formula or a placebo significantly has
different effects on sleep hours of insomnia patients.
f. ANS: Null hypothesis is, H0: Herbal formula and placebo have no significant difference in
sleep hours of insomnia patients.
The alternate hypothesis is, HA: There is a significant difference in sleep hours of insomnia
patients for herbal formula and placebo.
g. ANS: Mean for placebo and herbal formula were 4.7 hours and 4.9 hours. Median for
placebo and herbal formula were 4.5 hours and 5 hours. Standard deviation for the two treatment
groups were 1.49 hours and 0.74 hours, the Fisher’s measure of skewness were 0.14 and 0.17 and
Fisher’s measure of kurtosis were 0.48 and -0.73. The t-value for the difference in mean for two
13
Paraphrase This Document
Need a fresh take? Get an instant paraphrase of this document with our AI Paraphraser
treatments was -0.38 with significance value of 0.71. Hence the hypothesis of equality of means
of sleeping hours for both the treatments was accepted.
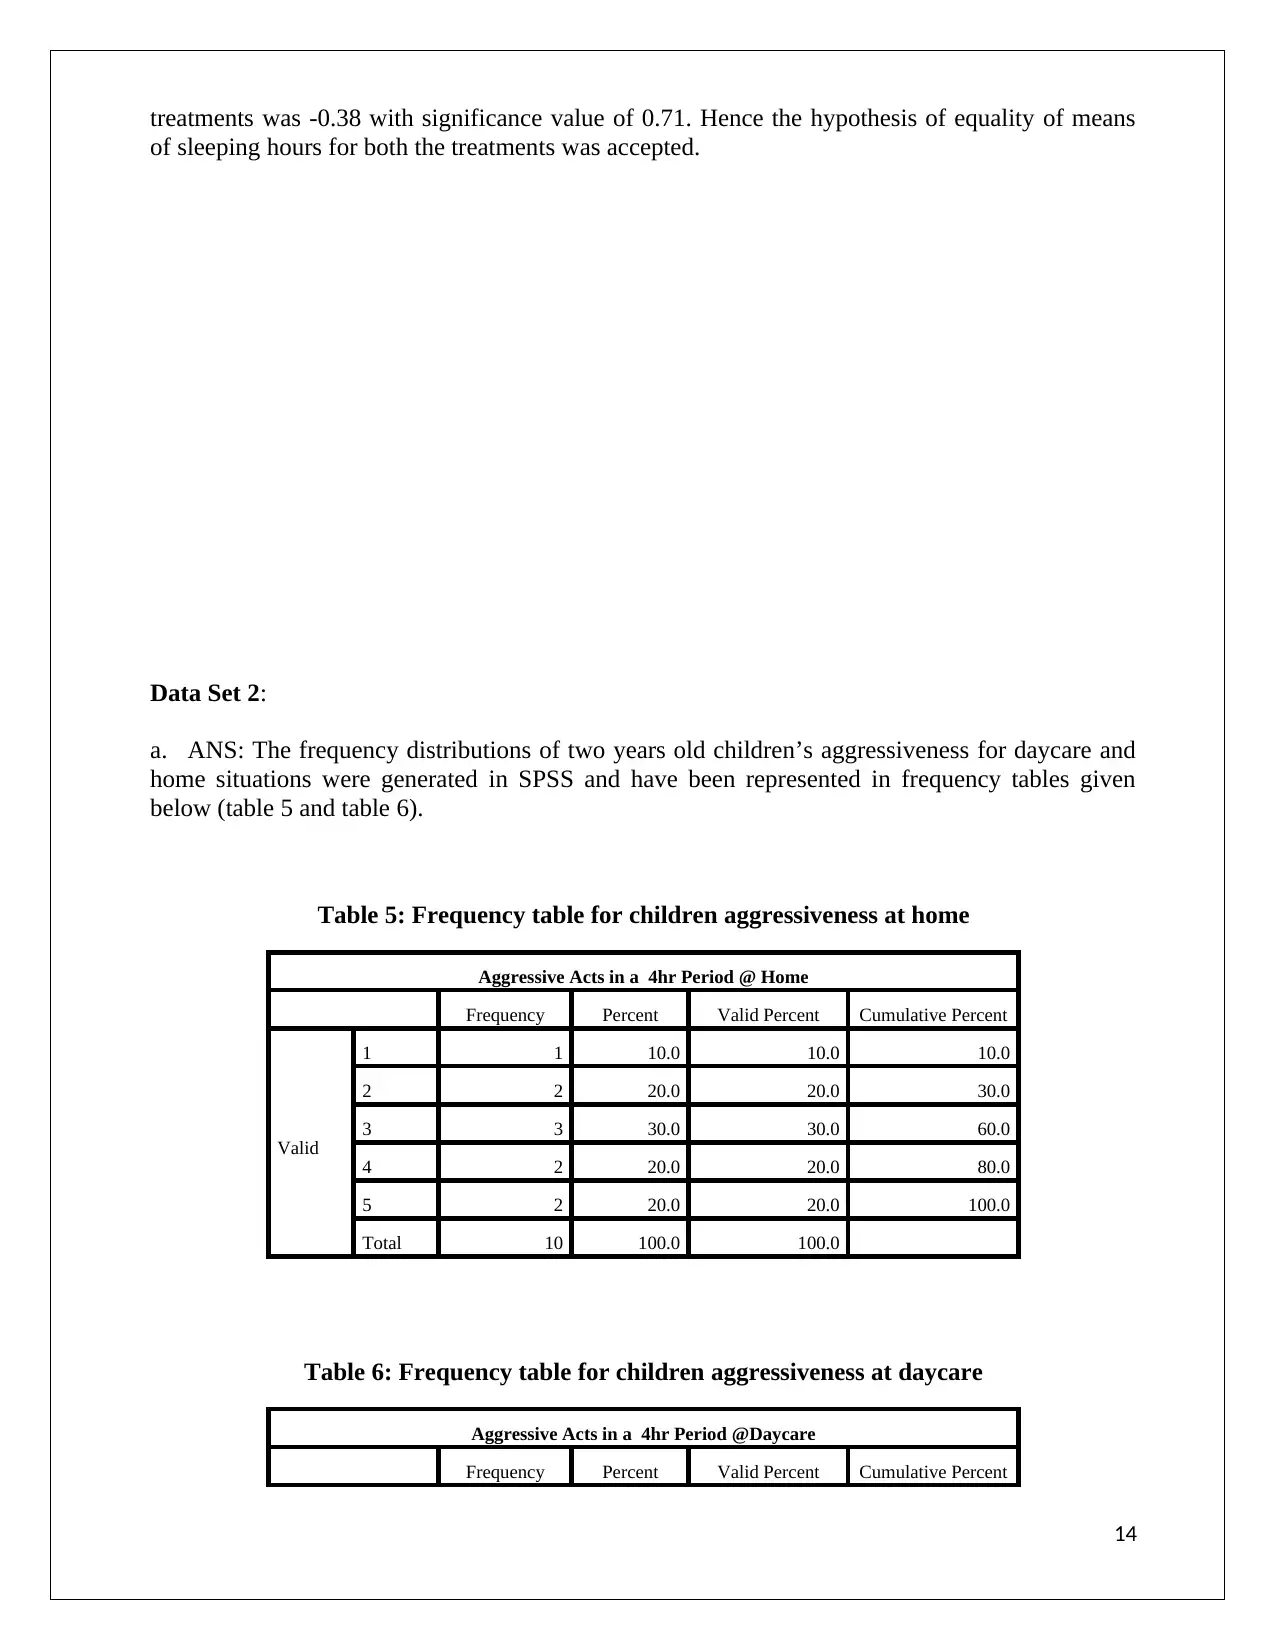
Data Set 2:
a. ANS: The frequency distributions of two years old children’s aggressiveness for daycare and
home situations were generated in SPSS and have been represented in frequency tables given
below (table 5 and table 6).
Table 5: Frequency table for children aggressiveness at home
Aggressive Acts in a 4hr Period @ Home
Frequency Percent Valid Percent Cumulative Percent
Valid
1 1 10.0 10.0 10.0
2 2 20.0 20.0 30.0
3 3 30.0 30.0 60.0
4 2 20.0 20.0 80.0
5 2 20.0 20.0 100.0
Total 10 100.0 100.0
Table 6: Frequency table for children aggressiveness at daycare
Aggressive Acts in a 4hr Period @Daycare
Frequency Percent Valid Percent Cumulative Percent
14
of sleeping hours for both the treatments was accepted.
Data Set 2:
a. ANS: The frequency distributions of two years old children’s aggressiveness for daycare and
home situations were generated in SPSS and have been represented in frequency tables given
below (table 5 and table 6).
Table 5: Frequency table for children aggressiveness at home
Aggressive Acts in a 4hr Period @ Home
Frequency Percent Valid Percent Cumulative Percent
Valid
1 1 10.0 10.0 10.0
2 2 20.0 20.0 30.0
3 3 30.0 30.0 60.0
4 2 20.0 20.0 80.0
5 2 20.0 20.0 100.0
Total 10 100.0 100.0
Table 6: Frequency table for children aggressiveness at daycare
Aggressive Acts in a 4hr Period @Daycare
Frequency Percent Valid Percent Cumulative Percent
14
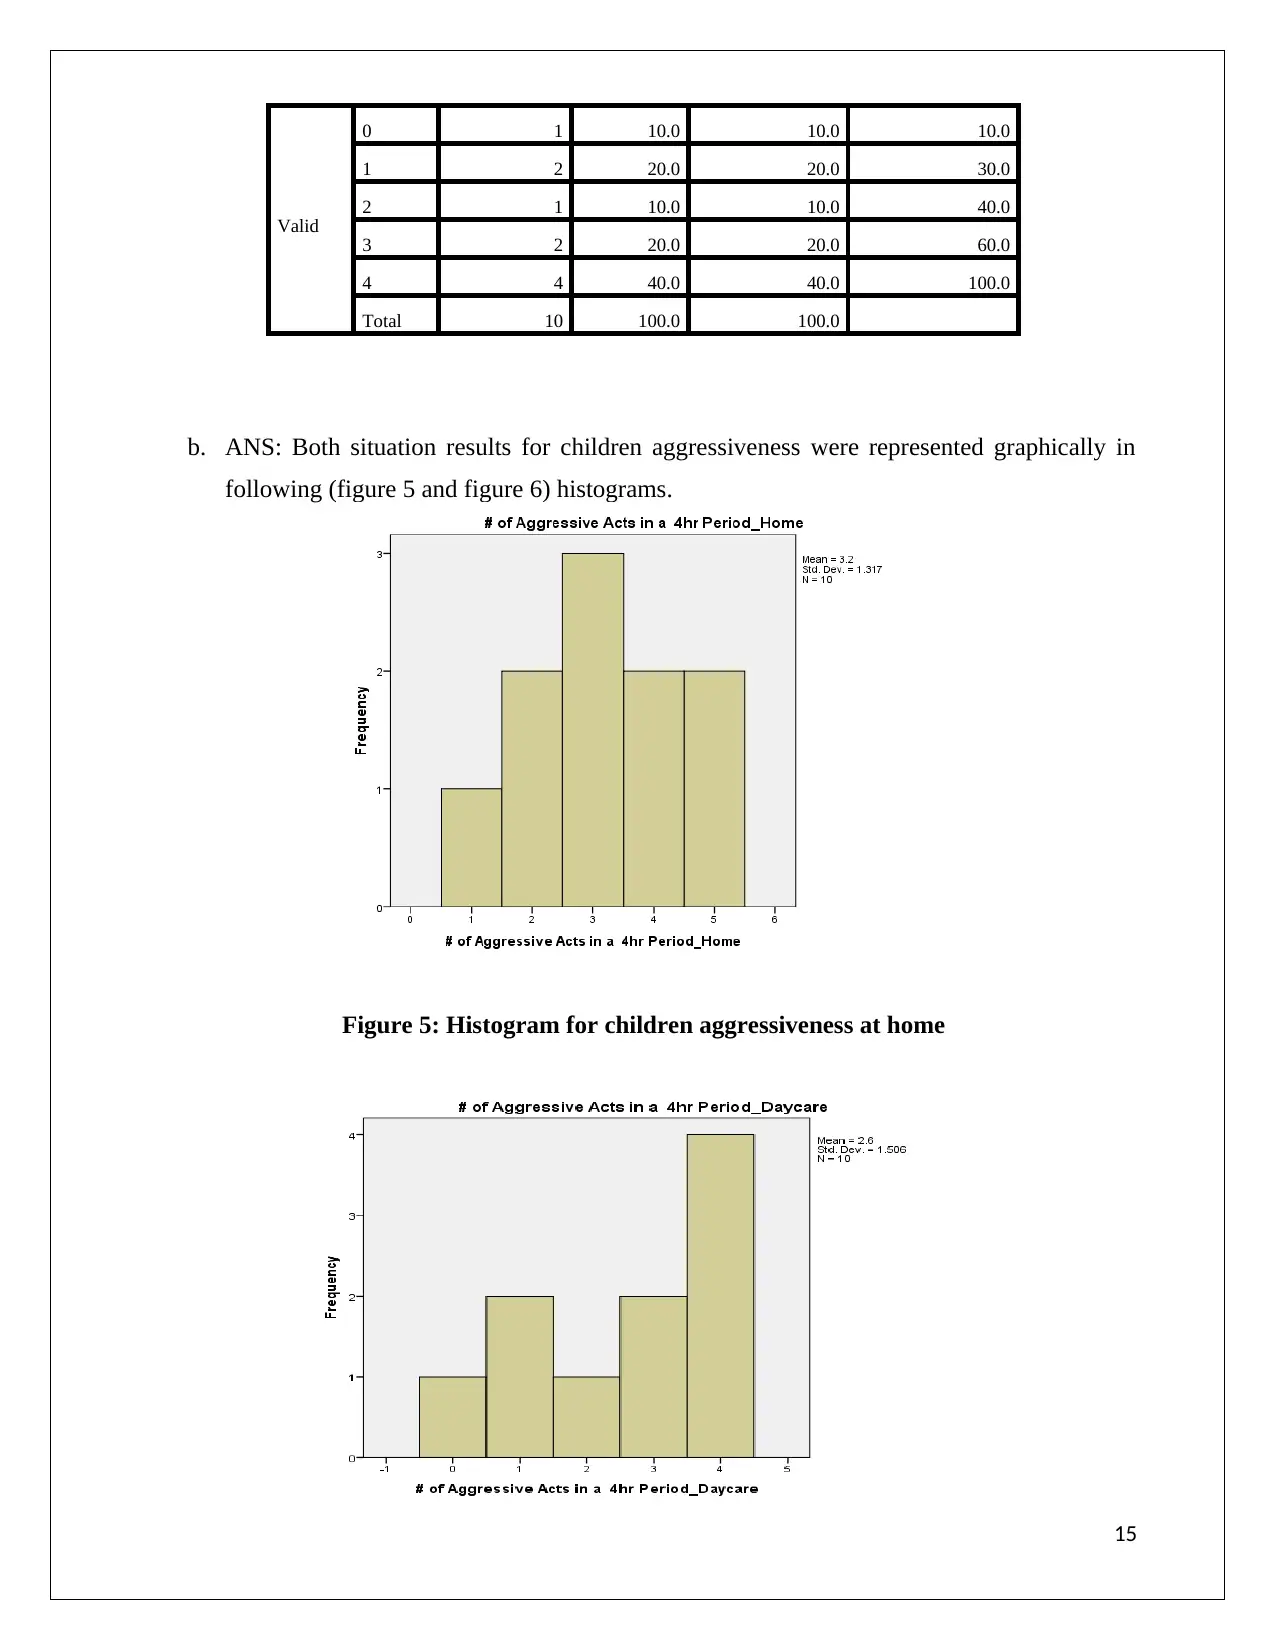
Valid
0 1 10.0 10.0 10.0
1 2 20.0 20.0 30.0
2 1 10.0 10.0 40.0
3 2 20.0 20.0 60.0
4 4 40.0 40.0 100.0
Total 10 100.0 100.0
b. ANS: Both situation results for children aggressiveness were represented graphically in
following (figure 5 and figure 6) histograms.
Figure 5: Histogram for children aggressiveness at home
15
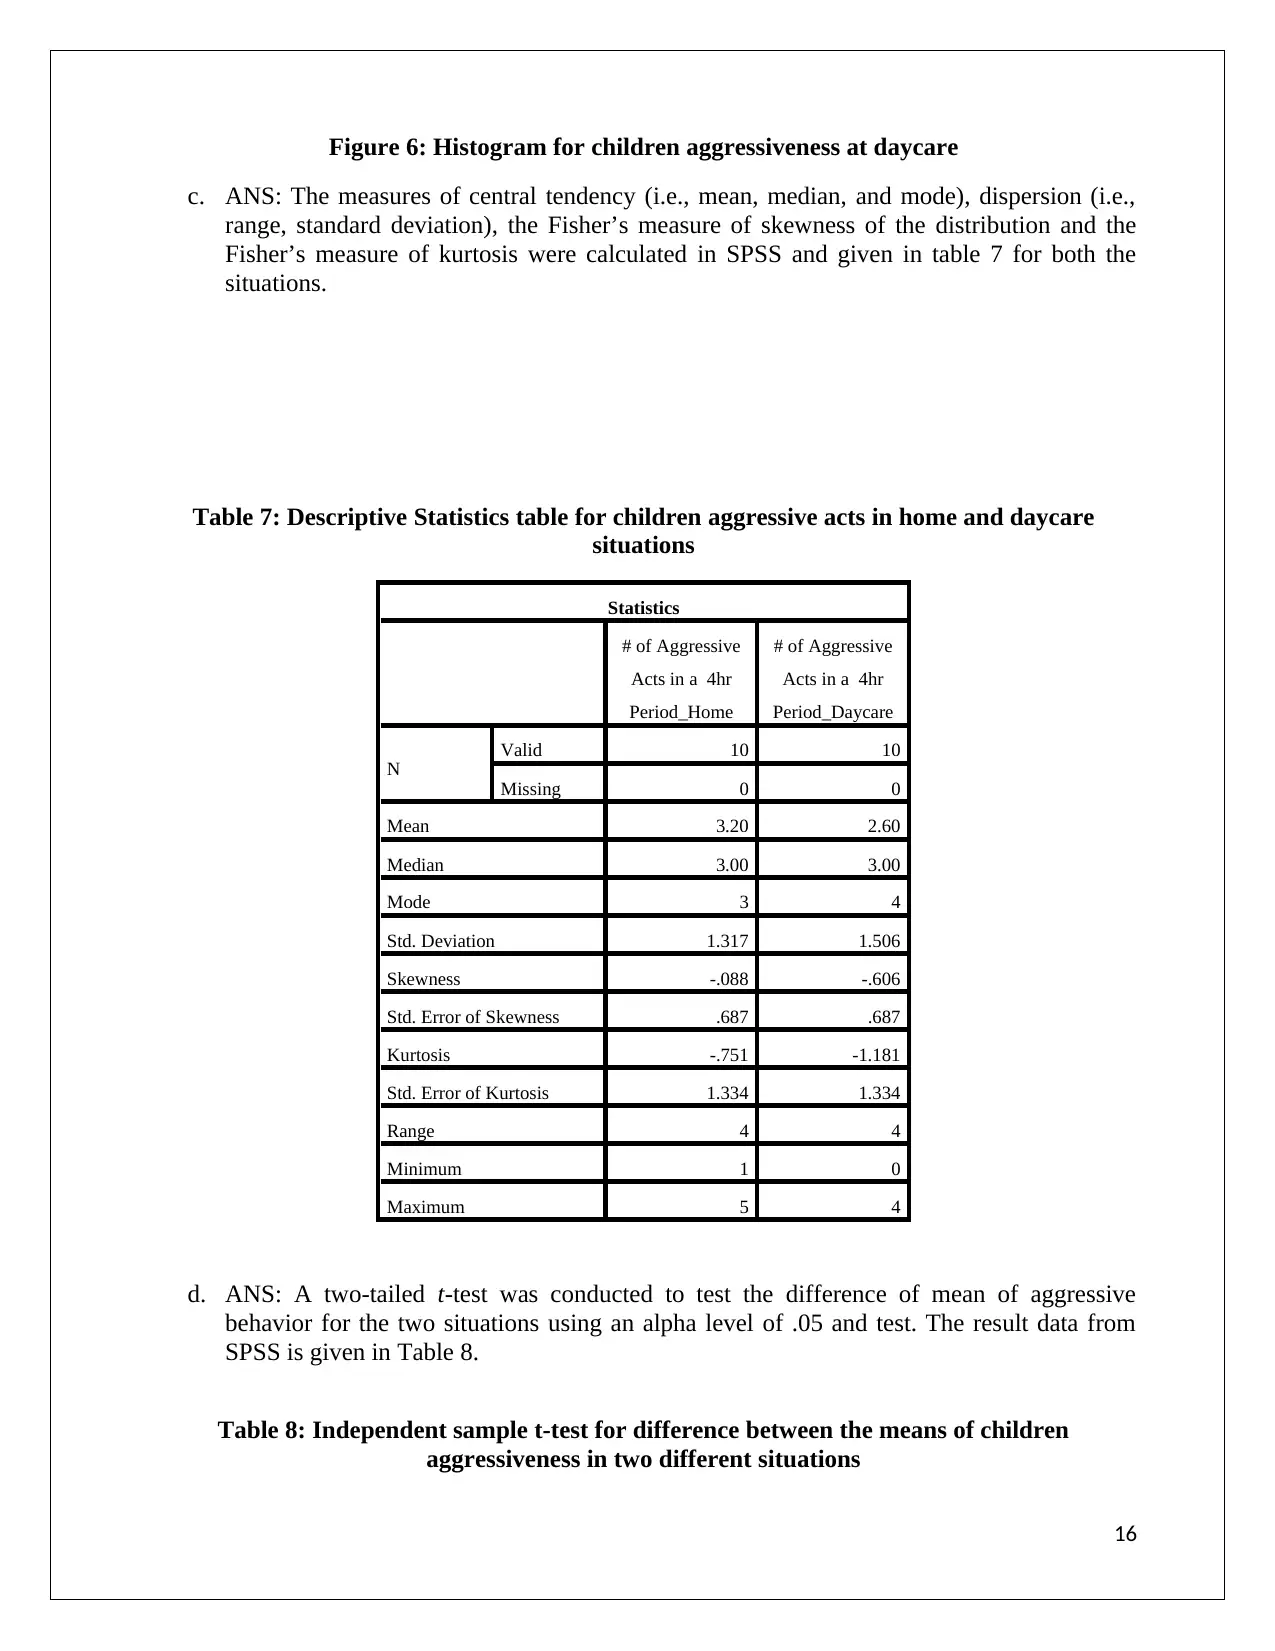
Figure 6: Histogram for children aggressiveness at daycare
c. ANS: The measures of central tendency (i.e., mean, median, and mode), dispersion (i.e.,
range, standard deviation), the Fisher’s measure of skewness of the distribution and the
Fisher’s measure of kurtosis were calculated in SPSS and given in table 7 for both the
situations.
Table 7: Descriptive Statistics table for children aggressive acts in home and daycare
situations
Statistics
# of Aggressive
Acts in a 4hr
Period_Home
# of Aggressive
Acts in a 4hr
Period_Daycare
N
Valid 10 10
Missing 0 0
Mean 3.20 2.60
Median 3.00 3.00
Mode 3 4
Std. Deviation 1.317 1.506
Skewness -.088 -.606
Std. Error of Skewness .687 .687
Kurtosis -.751 -1.181
Std. Error of Kurtosis 1.334 1.334
Range 4 4
Minimum 1 0
Maximum 5 4
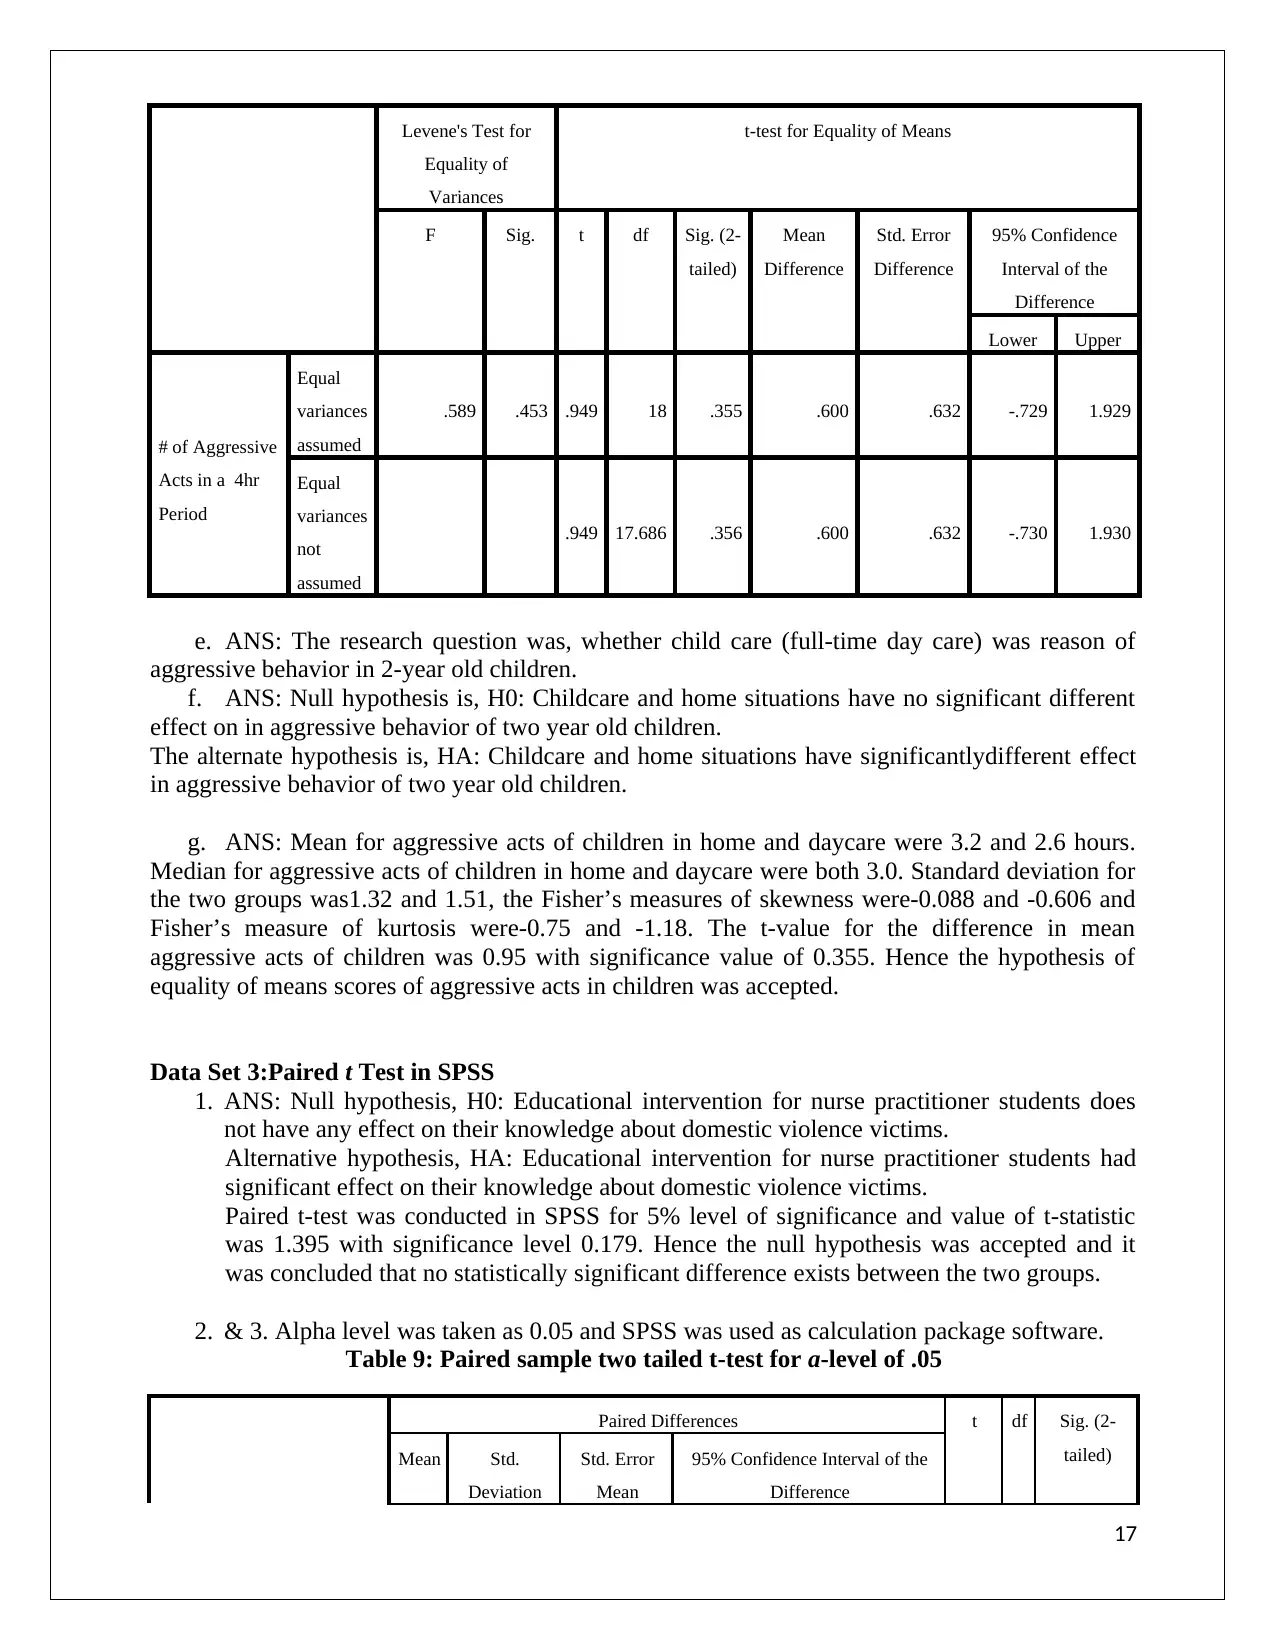
d. ANS: A two-tailed t-test was conducted to test the difference of mean of aggressive
behavior for the two situations using an alpha level of .05 and test. The result data from
SPSS is given in Table 8.
Table 8: Independent sample t-test for difference between the means of children
aggressiveness in two different situations
16
c. ANS: The measures of central tendency (i.e., mean, median, and mode), dispersion (i.e.,
range, standard deviation), the Fisher’s measure of skewness of the distribution and the
Fisher’s measure of kurtosis were calculated in SPSS and given in table 7 for both the
situations.
Table 7: Descriptive Statistics table for children aggressive acts in home and daycare
situations
Statistics
# of Aggressive
Acts in a 4hr
Period_Home
# of Aggressive
Acts in a 4hr
Period_Daycare
N
Valid 10 10
Missing 0 0
Mean 3.20 2.60
Median 3.00 3.00
Mode 3 4
Std. Deviation 1.317 1.506
Skewness -.088 -.606
Std. Error of Skewness .687 .687
Kurtosis -.751 -1.181
Std. Error of Kurtosis 1.334 1.334
Range 4 4
Minimum 1 0
Maximum 5 4
d. ANS: A two-tailed t-test was conducted to test the difference of mean of aggressive
behavior for the two situations using an alpha level of .05 and test. The result data from
SPSS is given in Table 8.
Table 8: Independent sample t-test for difference between the means of children
aggressiveness in two different situations
16
Secure Best Marks with AI Grader
Need help grading? Try our AI Grader for instant feedback on your assignments.
Levene's Test for
Equality of
Variances
t-test for Equality of Means
F Sig. t df Sig. (2-
tailed)
Mean
Difference
Std. Error
Difference
95% Confidence
Interval of the
Difference
Lower Upper
# of Aggressive
Acts in a 4hr
Period
Equal
variances
assumed
.589 .453 .949 18 .355 .600 .632 -.729 1.929
Equal
variances
not
assumed
.949 17.686 .356 .600 .632 -.730 1.930
e. ANS: The research question was, whether child care (full-time day care) was reason of
aggressive behavior in 2-year old children.
f. ANS: Null hypothesis is, H0: Childcare and home situations have no significant different
effect on in aggressive behavior of two year old children.
The alternate hypothesis is, HA: Childcare and home situations have significantlydifferent effect
in aggressive behavior of two year old children.
g. ANS: Mean for aggressive acts of children in home and daycare were 3.2 and 2.6 hours.
Median for aggressive acts of children in home and daycare were both 3.0. Standard deviation for
the two groups was1.32 and 1.51, the Fisher’s measures of skewness were-0.088 and -0.606 and
Fisher’s measure of kurtosis were-0.75 and -1.18. The t-value for the difference in mean
aggressive acts of children was 0.95 with significance value of 0.355. Hence the hypothesis of
equality of means scores of aggressive acts in children was accepted.
Data Set 3:Paired t Test in SPSS
1. ANS: Null hypothesis, H0: Educational intervention for nurse practitioner students does
not have any effect on their knowledge about domestic violence victims.
Alternative hypothesis, HA: Educational intervention for nurse practitioner students had
significant effect on their knowledge about domestic violence victims.
Paired t-test was conducted in SPSS for 5% level of significance and value of t-statistic
was 1.395 with significance level 0.179. Hence the null hypothesis was accepted and it
was concluded that no statistically significant difference exists between the two groups.
2. & 3. Alpha level was taken as 0.05 and SPSS was used as calculation package software.
Table 9: Paired sample two tailed t-test for a-level of .05
Paired Differences t df Sig. (2-
tailed)Mean Std.
Deviation
Std. Error
Mean
95% Confidence Interval of the
Difference
17
Lower Upper
Pair
1
Posttest Score -
Pretest Score .650 2.084 .466 -.326 1.626 1.395 19 .179
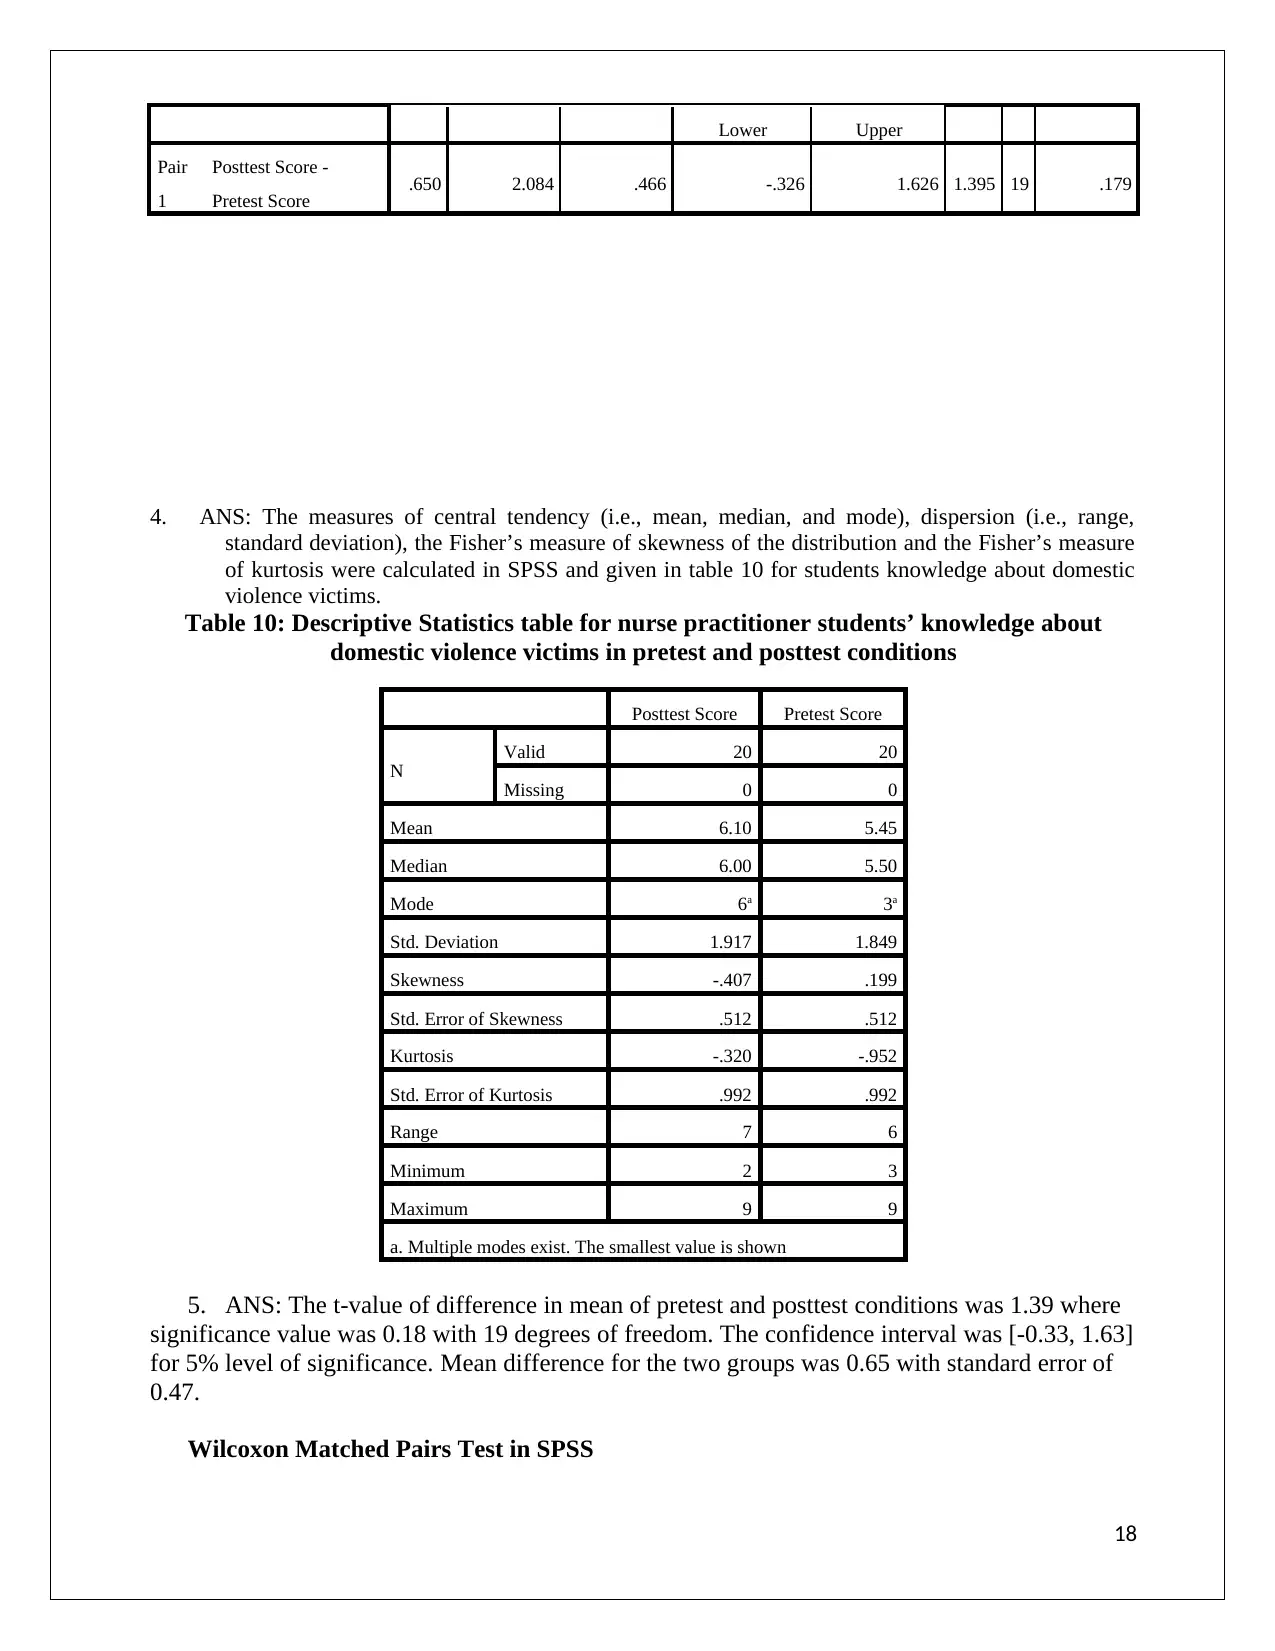
4. ANS: The measures of central tendency (i.e., mean, median, and mode), dispersion (i.e., range,
standard deviation), the Fisher’s measure of skewness of the distribution and the Fisher’s measure
of kurtosis were calculated in SPSS and given in table 10 for students knowledge about domestic
violence victims.
Table 10: Descriptive Statistics table for nurse practitioner students’ knowledge about
domestic violence victims in pretest and posttest conditions
Posttest Score Pretest Score
N
Valid 20 20
Missing 0 0
Mean 6.10 5.45
Median 6.00 5.50
Mode 6a 3a
Std. Deviation 1.917 1.849
Skewness -.407 .199
Std. Error of Skewness .512 .512
Kurtosis -.320 -.952
Std. Error of Kurtosis .992 .992
Range 7 6
Minimum 2 3
Maximum 9 9
a. Multiple modes exist. The smallest value is shown
5. ANS: The t-value of difference in mean of pretest and posttest conditions was 1.39 where
significance value was 0.18 with 19 degrees of freedom. The confidence interval was [-0.33, 1.63]
for 5% level of significance. Mean difference for the two groups was 0.65 with standard error of
0.47.
Wilcoxon Matched Pairs Test in SPSS
18
Pair
1
Posttest Score -
Pretest Score .650 2.084 .466 -.326 1.626 1.395 19 .179
4. ANS: The measures of central tendency (i.e., mean, median, and mode), dispersion (i.e., range,
standard deviation), the Fisher’s measure of skewness of the distribution and the Fisher’s measure
of kurtosis were calculated in SPSS and given in table 10 for students knowledge about domestic
violence victims.
Table 10: Descriptive Statistics table for nurse practitioner students’ knowledge about
domestic violence victims in pretest and posttest conditions
Posttest Score Pretest Score
N
Valid 20 20
Missing 0 0
Mean 6.10 5.45
Median 6.00 5.50
Mode 6a 3a
Std. Deviation 1.917 1.849
Skewness -.407 .199
Std. Error of Skewness .512 .512
Kurtosis -.320 -.952
Std. Error of Kurtosis .992 .992
Range 7 6
Minimum 2 3
Maximum 9 9
a. Multiple modes exist. The smallest value is shown
5. ANS: The t-value of difference in mean of pretest and posttest conditions was 1.39 where
significance value was 0.18 with 19 degrees of freedom. The confidence interval was [-0.33, 1.63]
for 5% level of significance. Mean difference for the two groups was 0.65 with standard error of
0.47.
Wilcoxon Matched Pairs Test in SPSS
18
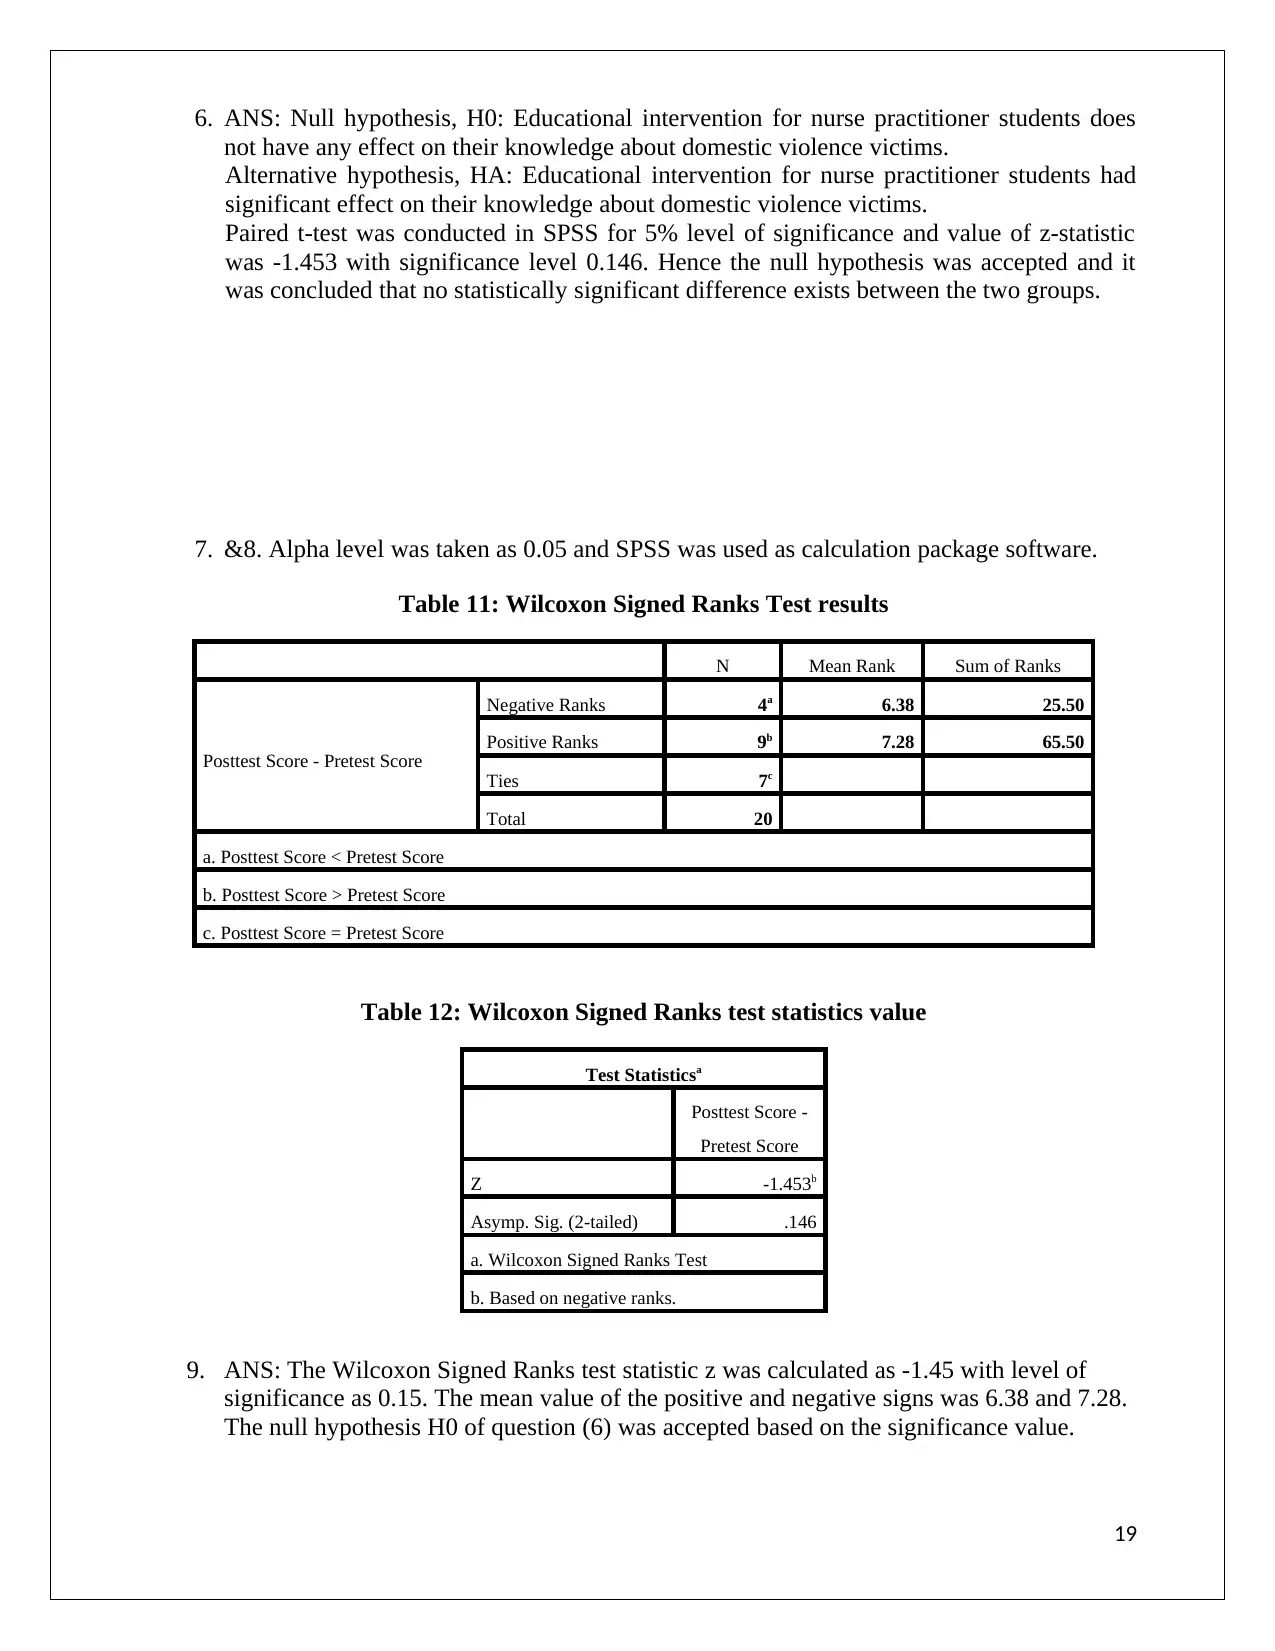
6. ANS: Null hypothesis, H0: Educational intervention for nurse practitioner students does
not have any effect on their knowledge about domestic violence victims.
Alternative hypothesis, HA: Educational intervention for nurse practitioner students had
significant effect on their knowledge about domestic violence victims.
Paired t-test was conducted in SPSS for 5% level of significance and value of z-statistic
was -1.453 with significance level 0.146. Hence the null hypothesis was accepted and it
was concluded that no statistically significant difference exists between the two groups.
7. &8. Alpha level was taken as 0.05 and SPSS was used as calculation package software.
Table 11: Wilcoxon Signed Ranks Test results
N Mean Rank Sum of Ranks
Posttest Score - Pretest Score
Negative Ranks 4a 6.38 25.50
Positive Ranks 9b 7.28 65.50
Ties 7c
Total 20
a. Posttest Score < Pretest Score
b. Posttest Score > Pretest Score
c. Posttest Score = Pretest Score
Table 12: Wilcoxon Signed Ranks test statistics value
Test Statisticsa
Posttest Score -
Pretest Score
Z -1.453b
Asymp. Sig. (2-tailed) .146
a. Wilcoxon Signed Ranks Test
b. Based on negative ranks.
9. ANS: The Wilcoxon Signed Ranks test statistic z was calculated as -1.45 with level of
significance as 0.15. The mean value of the positive and negative signs was 6.38 and 7.28.
The null hypothesis H0 of question (6) was accepted based on the significance value.
19
Paraphrase This Document
Need a fresh take? Get an instant paraphrase of this document with our AI Paraphraser
Reference Lists
Balducci, S., Zanuso, S., Nicolucci, A., Fernando, F., Cavallo, S., Cardelli, P., ... & Fallucca, F.
(2010). Anti-inflammatory effect of exercise training in subjects with type 2 diabetes and
the metabolic syndrome is dependent on exercise modalities and independent of weight
loss. Nutrition, Metabolism and Cardiovascular Diseases, 20(8), 608-617.
Corder, G. W., & Foreman, D. I. (2014). Nonparametric statistics: A step-by-step approach. John
Wiley & Sons.
Ellis, V., Charlett, A., & Bendall, R. (2004). A comparison of IgG anti-rubella activity in frozen
serum stored in primary gel separation tubes or secondary tubes. Journal of clinical
pathology, 57(1), 104-106.
Gibbons, J. D., & Chakraborti, S. (2011). Nonparametric statistical inference. In International
encyclopedia of statistical science (pp. 977-979). Springer Berlin Heidelberg.
Hair, J. F., Ringle, C. M., & Sarstedt, M. (2011). PLS-SEM: Indeed a silver bullet. Journal of
Marketing theory and Practice, 19(2), 139-152.
Hart, A. (2001). Mann-Whitney test is not just a test of medians: differences in spread can be
important. BMJ: British Medical Journal, 323(7309), 391.
Kim, C. G., June, K. J., & Song, R. (2003). Effects of a health-promotion program on
cardiovascular risk factors, health behaviors, and life satisfaction in institutionalized
elderly women. International journal of nursing studies, 40(4), 375-381.
Nachar, N. (2008). The Mann-Whitney U: A test for assessing whether two independent samples
come from the same distribution. Tutorials in Quantitative Methods for Psychology, 4(1),
13-20.
Pituch, K. A. (2013). Intermediate statistics: A modern approach. Routledge.
Samuels, M. L. (2012). Statistics for the life sciences. London: Pearson education.
20
1 out of 20
Related Documents


Your All-in-One AI-Powered Toolkit for Academic Success.
+13062052269
info@desklib.com
Available 24*7 on WhatsApp / Email
![[object Object]](/_next/static/media/star-bottom.7253800d.svg)
Unlock your academic potential
© 2024 | Zucol Services PVT LTD | All rights reserved.