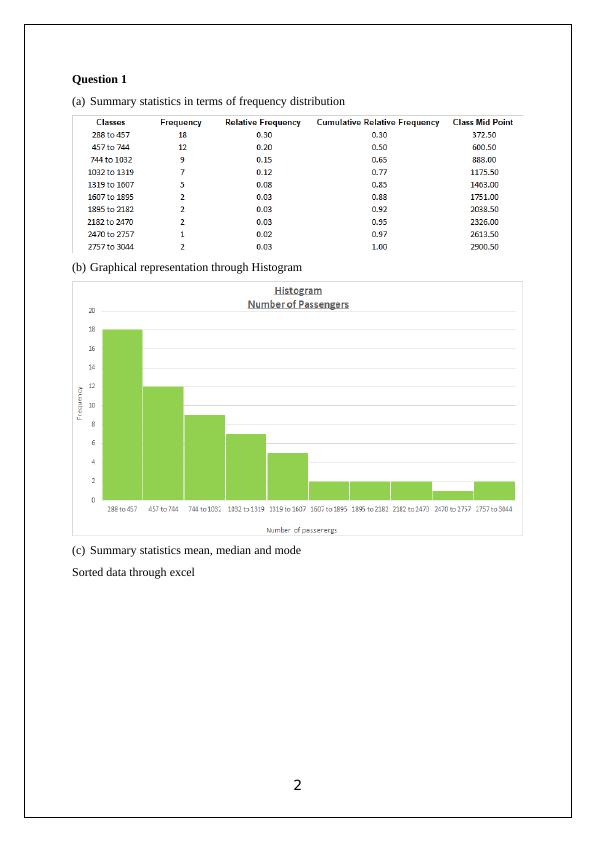
Graphical representation through Histogram Question 2022
This group assignment requires students to demonstrate their understanding of business research principles and statistical analysis techniques taught in the course.
11 Pages816 Words10 Views
Added on 2022-10-18
Graphical representation through Histogram Question 2022
This group assignment requires students to demonstrate their understanding of business research principles and statistical analysis techniques taught in the course.
Added on 2022-10-18
ShareRelated Documents

End of preview
Want to access all the pages? Upload your documents or become a member.
Applied Quantitative Methods HA1011 Assignment
|14
|935
|302
Applied Quantitative Methods
|11
|864
|469
Applied Quantitative Methods Assignment II
|13
|1415
|20
Measures of Central Tendency - PDF
|10
|636
|148
HA1011 - Applied Quantative methods
|15
|943
|30
Frequency distribution of Melbourne 20 18 18 16 14 12 to 1577 1577 to 1859 1 1 1859 to 2140 2140 to 2422 2422 to 2703 Number of passengers at train station (Melbourne) 20 18 18 16 14 12
|11
|1565
|67