Green Consumption Values and Responses to Environmentally Friendly Products
Added on 2023-05-30
19 Pages20147 Words490 Views
Research Article
Seeing the world through GREEN-tinted glasses: Green consumption values
and responses to environmentally friendly products☆
Kelly L. Haws a,⁎, Karen Page Winterich b , Rebecca Walker Naylor c
a Owen Graduate School of Management, 401 21st Ave South, Vanderbilt University, Nashville, TN 37203, USA
b Smeal College of Business, Pennsylvania State University, 449 Business Building, University Park, PA, 16802, USA
c Fisher College of Business, The Ohio State University, 2100 Neil Avenue, 538 Fisher Hall, Columbus, OH 43210, USA
Received 30 October 2012; received in revised form 23 October 2013; accepted 4 November 2013
Available online 13 November 2013
Abstract
The primary goal of this research is to conceptualize and develop a scale of green consumption values, which we define as the tendency to
express the value of environmental protection through one's purchases and consumption behaviors. Across six studies, we demonstrate that the six-
item measure we develop (i.e., the GREEN scale) can be used to capture green consumption values in a reliable, valid, and parsimonious manner.
We further theorize and empirically demonstrate that green consumption values are part of a larger nomological network associated with
conservation of not just environmental resources but also personal financial and physical resources. Finally, we demonstrate that the GREEN scale
predicts consumer preference for environmentally friendly products. In doing so, we demonstrate that stronger green consumption values increase
preference for environmentally friendly products through more favorable evaluations of the non-environmental attributes of these products. These
results have important implications for consumer responses to the growing number of environmentally friendly products.
© 2013 Society for Consumer Psychology. Published by Elsevier Inc. All rights reserved.
Keywords: Sustainability; Scale development; Environmental marketing; Green marketing; Motivated reasoning
1. Introduction
In today's marketplace, consumers are increasingly faced
with choices between “green” products and their more
traditional counterparts, as more firms produce products
whose composition and/or packaging are positioned as
environmentally friendly. For example, Wal-Mart is pressuring
its suppliers like General Electric and Procter & Gamble to
provide environmentally friendly products (Rosenbloom &
Barbaro, 2009). Moreover, many corporate initiatives now
focus exclusively on environmental issues, such as KPMG's
Global Green Initiative (KPMG, 2010; see also Menon &
Menon, 1997). However, the extent to which consumers value
and therefore positively respond to such offerings through
value-consistent behavior remains questionable.
Clearly not all consumers are willing to buy environmentally
friendly (EF) products. 1 Some consumers may be reluctant to
purchase EF products because they are perceived to be less
effective (Luchs et al., 2010). Cost may also be a critical
☆ The authors gratefully acknowledge that this project was funded by the Alton M.
& Marion R. Withers Retailing Research Grant Center for Retailing Studies, Texas
A&M University. The first two authors contributed equally to this research.
⁎ Corresponding author.
E-mail addresses: Kelly.haws@vanderbilt.edu (K.L. Haws),
kpw2@psu.edu (K.P. Winterich), naylor_53@fisher.osu.edu (R.W. Naylor).
1 We define an environmentally friendly product as one with at least one positive
environmental attribute. An “environmental attribute” is an attribute that reflects the
impact of the product on the environment. As such, environmental product attributes
can be positive (i.e., the product has little to no negative impact on the environment
and is considered environmentally friendly) or negative (i.e., the product harms the
environment). This definition is consistent with the definition of “ethical attributes”
used in past research (Irwin & Naylor, 2009; Luchs, Naylor, Irwin, & Raghunathan,
2010; Peloza, White, & Shang, 2013), with the key distinction being that
environmental attributes are specifically about the environment, not more broadly
about any issue that a consumer sees as relevant to their values/ethics (e.g., child
labor concerns; unsafe work environments, donations to charity, discrimination;
Mohr & Webb, 2005).
1057-7408/$ -see front matter © 2013 Society for Consumer Psychology. Published by Elsevier Inc. All rights reserved.
http://dx.doi.org/10.1016/j.jcps.2013.11.002
Available online at www.sciencedirect.com
ScienceDirect
Journal of Consumer Psychology 24, 3 (2014) 336 – 354
deterrent; eco-friendly products have historically cost more than
their traditional 2 counterparts (Dale, 2008; Mintel, 2009), and not
all consumers are willing to pay price premiums for ethical or EF
products (Mintel, 2010). Clearly, some consumers are willing to
purchase EF products while others are not, which suggests that
there are individual differences among consumers in the value
they place on conserving the environment in consumption
settings. Therefore, the primary objective of our research is to
develop a method to understand differences across consumers
who do and do not value conserving the environment as part of
their consumption behavior. As such, we introduce the construct
of green consumption values, which we formally define as the
tendency to express the value of environmental protection
through one's purchases and consumption behaviors.
Across six studies, we demonstrate that the six-item measure
we develop (i.e., the GREEN scale) can be used to reliably
capture green consumption values. We further suggest that
green consumption values are part of a larger nomological
network associated with conservation of not just environmental
resources but also personal financial and physical resources. In
others words, consumers with stronger green consumption
values (i.e., “green” consumers) are generally oriented toward
protecting resources at both the environmental and personal
level. We test these proposed nomological network relation-
ships empirically as part of our larger scale development effort.
Finally, to further validate the scale, we demonstrate that the
GREEN scale predicts consumer preference for EF products. In
doing so, we show that stronger green consumption values
increase preference for EF products through more favorable
evaluations of these products' non-environmental attributes,
consistent with consumers' use of motivated reasoning in other
decision making contexts (Kunda, 1990).
2. Understanding green consumers
Environmentally responsible behavior is receiving increasing
attention in the literature (Catlin & Wang, 2013; Leonidou,
Katsikeas, & Morgan, 2013; Peloza et al., 2013; Trudel & Argo,
2013; White & Simpson, 2013). This focus is consistent with a
broader interest in understanding socially responsible consumption
that has persisted for several decades (e.g., Anderson &
Cunningham, 1972; Antil, 1984; Roberts, 1995; Webb, Mohr, &
Harris, 2008; Webster, 1975). However, the extent to which
consumers' environmentally responsible behaviors differ among
individuals, and why, is not clear given that existing research has
focused on responses to environmental products at the firm level
(Leonidou et al., 2013) or as a result of differing situational factors
(Catlin & Wang, 2013; Peloza et al., 2013; White & Simpson,
2013). To be sure, past research aimed at understanding socially
responsible consumption has sought to understand differences
among individual consumers. Yet, this research focused on broader
social issues, as illustrated by Roberts' (1993) description of a
socially responsible consumer as “one who purchases products and
services perceived to have a positive (or less negative) influence on
the environment or who patronizes businesses that attempt to effect
related positive social change” (p. 140).
Although we acknowledge that environmental issues have
often been conceptualized as part of a broader effort to understand
socially conscious consumers (Mohr, Webb, & Harris, 2001;
Roberts, 1993; Webster, 1975), the more general notion of
socially responsible consumption is multifaceted. As such,
investigations of socially conscious consumption have often led
to long and complex measures designed to capture the full scope
of the constructs involved, which include issues not directly
related to the environment (see, for example, Antil, 1984; Webb
et al., 2008). Other scales designed to measure consumer social
responsibility have become dated as perceptions of socially
responsible behaviors change over time (Dunlap, Van Liere,
Mertig, & Jones, 2000).3 Thus, our primary goal is to develop a
concise measure of exclusively green consumption values, as
opposed to broader attitudes toward socially responsible behavior
or environmental consciousness. As we develop this measure, we
also seek to identify the consumer characteristics associated with
green consumption values as part of a broader nomological
network and understanding of the green consumer. In addition to
the desire of consumers with strong green consumption values to
use society's environmental resources wisely (i.e., clean water,
clean air, flora, and fauna; Cunningham, Cunningham, &
Woodworth, 2001), we suggest that green consumers also value
conservation of their personal resources.
As such, we focus our conceptualization and nomological
network of green consumption values on the underlying
characteristics of concern for both individual-level financial and
physical resources. Specifically, we expect consumers with
stronger green consumption values to be more conscientious in
the use of their financial resources, consistent with past research
suggesting that green consumption (or conservation) may be
related to concerns about spending money. For example, in one
study, price consciousness was the only variable, other than
household characteristics (i.e., number of rooms) and family size,
to significantly predict energy use (Heslop, Moran, & Cousineau,
1981). In another study, care in shopping (reflecting shopping for
specials and checking prices) significantly predicted making a
special effort to buy environmentally-friendly products for both
men and women (Shrum, McCarty, & Lowrey, 1995).
Relatedly, we also expect consumers with stronger green
consumption values to be more careful users of physical
resources, for example by using their products fully and by not
using more than the necessary amount of a product for it to
perform its function effectively, as suggested by Lastovicka,
Bettencourt, Hughner, and Kuntze's (1999) work on frugal
consumption. Specifically, we suggest that green consumers
will be reluctant to give up their physical possessions because
they will seek to extract full and complete value from goods
2 When we refer to a “traditional” product, we refer to offerings in which there
is no known environmentally friendly attribute, though they are not necessarily
harmful to the environment.
3 For example, some scale items use figures that become dated (e.g., “I would
be willing to accept an increase in my family's total expenses of $120 next year
to promote the wise use of natural resources” from Antil, 1984), while others
focus on avoiding trade with certain countries due to policies that have changed
over time (e.g., “I do not buy products from companies that have investments in
South Africa” from Roberts, 1995).
337K.L. Haws et al. / Journal of Consumer Psychology 24, 3 (2014) 336–354
before discarding them, consistent with Haws, Naylor, Coulter,
and Bearden's (2012) work on product retention tendency.
Additionally, we theorize that green consumers will be more
likely to be innovative users of existing physical resources, that
is, that they will creatively reuse and find multiple uses for their
products, as suggested by Price and Ridgeway's (1983) work
on use innovativeness, a behavior indicative of self-recycling.
To understand consumers' green consumption values, the
corresponding nomological net, and their predictive validity, we
first conduct a series of four scale development and validation
studies. In Study 1a, we discuss our development of a six-item
scale to measure green consumption values, compare it to an
existing measure of socially responsible consumption, and
establish a nomological network including concern for both
personal financial and physical resources. Study 1b provides
further validation of the scale and nomological network using an
adult sample. Study 1c demonstrates the test–retest reliability of
the scale while also providing evidence of predictive validity
relative to existing measures of environmental attitudes drawn
from the literature. Study 1d provides further support for the
predictive validity of our green measure with actual choice.
3. Study 1a: Developing the GREEN scale and testing the
nomological network
3.1. Participants and method
To develop the GREEN scale, we initially compiled a list of
58 items intended to measure how much consumers valued the
environment when making consumption decisions. These items
were generated by the authors by adapting items from existing
environmental attitude scales and drawing upon popular press
articles regarding green marketing (e.g., Dale, 2008; Stone,
2009). We presented this set of items, plus other measures
described below, to 264 undergraduate students who were
participating in a multi-phased study for course credit. Given
our intention to parsimoniously assess the tendency to express
the importance of environmental protection through one's
purchases and consumption behaviors, we anticipated a
one-factor model for our GREEN scale.
In addition to the 58 proposed items to assess green
consumption values, we also included the 40-item measure of
Socially Responsible Consumption Behavior (SRCB) devel-
oped by Antil in 1984. Our intent was not to compare our
measure against every existing measure of environmental or
socially responsible values, attitudes, and behaviors, but rather
to develop a concise scale that would not easily become
outdated and would compare well with past measures. We used
the Antil (1984) scale for these benchmarking purposes because
of its inclusion of environmental values as a key part of socially
responsible consumption as well as its existing use in the
literature. We anticipated that our six-item measure would be
strongly related to this existing 40-item measure.
Additionally, we sought to examine our proposed nomolog-
ical network with respect to the relationship between green
consumption values and existing measures of consumers' use of
personal financial and physical resources. The first of these
measures was Lastovicka et al.'s (1999) frugality scale.
Lastovicka et al. (1999) characterized frugality as being about
both the careful acquisition and careful consumption of goods,
encompassing the vigilant use of both financial and physical
resources. Therefore, we expect GREEN to be related to frugality
because of the emphasis a frugal consumer places on the careful
use of financial resources in acquiring goods and concern for
physical possessions during consumption (Lastovicka et al.,
1999). We also measured consumer spending self-control
(CSSC) because we expect greener consumers to exercise more
thoughtfulness and control in their spending decision making,
which would be implied in a positive relationship between
GREEN and CSSC (Haws, Bearden, & Nenkov, 2012). We
also included Lichtenstein, Netemeyer, and Burton's (1990)
measure of price consciousness and Lichtenstein, Ridgway, and
Netemeyer's (1993) measure of value consciousness. We expect
GREEN to be positively related to both of these constructs as
these tendencies also suggest careful use of financial resources.
To address the conservative use of personal physical resources
beyond that captured in Lastovicka et al.'s (1999) frugality scale,
we measured the tendency to retain or relinquish possessions
(using the product retention tendency scale; Haws, Naylor et al.,
2012) and innovativeness in the use and reuse of products (using
Price & Ridgeway's, 1983 three-dimensional use innovativeness
scale). We expect these constructs to be positively related to
GREEN, as they involve a focus on the careful disposition and
use of physical resources.
Finally, to assess the potential for consumers to misrepresent
themselves by responding in a socially desirable manner, which
may be of particular concern for socially responsible and
environmentally friendly behaviors (Luchs et al., 2010), we
assessed the relationship between GREEN and both self-
deceptive enhancement and impression management using a
shortened version of Paulhus (1998) Balanced Inventory of
Desirable Responding (BIDR) scale.
3.2. Results
We first conducted a series of factor analyses to reduce the
set of 58 items. An initial exploratory factor analysis revealed
that there was one primary factor that emerged from the set of
58 items, with an eigenvalue of 19.23 for the first factor versus
5.00 for the second factor, which explained 33% versus 9% of
variance, respectively. A careful inspection of the factor
loadings for the second and subsequent factors showed that
the loadings were significantly smaller than the loadings on the
first factor, supporting the proposed one-factor model as
sufficiently capturing our construct. 4 As such, we focused on
identifying items from this one factor that would assess green
consumption values.
We found that 10 items had a loading of at least .70 or higher on
the first factor. We carefully examined these 10 items to limit the
use of redundant or unclear items in order to use as few items as
4 We also compared the one-factor model to a series of other models
including two, three, and four factor models, and we consistently found
evidence that one factor provided the best fitting model.
338 K.L. Haws et al. / Journal of Consumer Psychology 24, 3 (2014) 336–354
possible while retaining high validity, which is consistent with
recommendations by Bearden, Netemeyer, and Haws (2010) and
Bearden, Netemeyer, and Teel (1989). This process led to the
elimination of four items. Accordingly, we determined that the
remaining six items were highly reliable (α = .89) and could
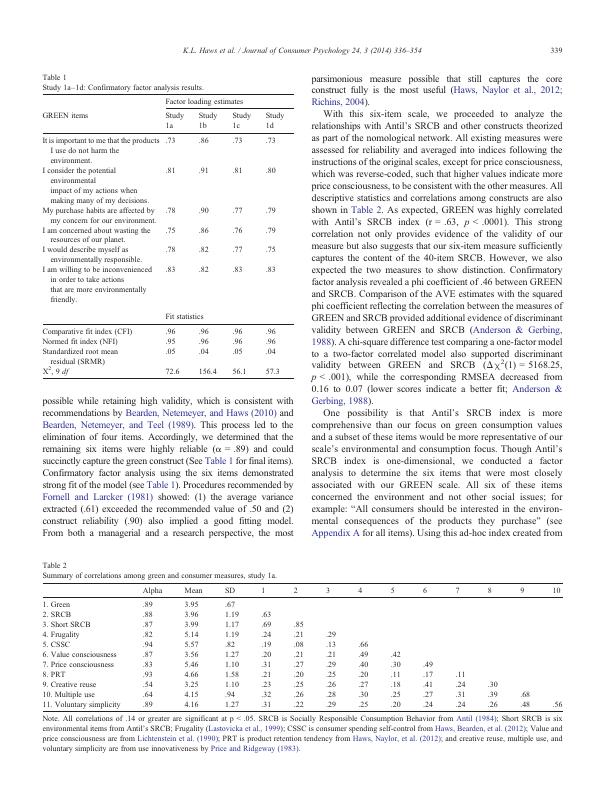
succinctly capture the green construct (See Table 1 for final items).
Confirmatory factor analysis using the six items demonstrated
strong fit of the model (see Table 1). Procedures recommended by
Fornell and Larcker (1981) showed: (1) the average variance
extracted (.61) exceeded the recommended value of .50 and (2)
construct reliability (.90) also implied a good fitting model.
From both a managerial and a research perspective, the most
parsimonious measure possible that still captures the core
construct fully is the most useful (Haws, Naylor et al., 2012;
Richins, 2004).
With this six-item scale, we proceeded to analyze the
relationships with Antil's SRCB and other constructs theorized
as part of the nomological network. All existing measures were
assessed for reliability and averaged into indices following the
instructions of the original scales, except for price consciousness,
which was reverse-coded, such that higher values indicate more
price consciousness, to be consistent with the other measures. All
descriptive statistics and correlations among constructs are also
shown in Table 2. As expected, GREEN was highly correlated
with Antil's SRCB index (r = .63, p b .0001). This strong
correlation not only provides evidence of the validity of our
measure but also suggests that our six-item measure sufficiently
captures the content of the 40-item SRCB. However, we also
expected the two measures to show distinction. Confirmatory
factor analysis revealed a phi coefficient of .46 between GREEN
and SRCB. Comparison of the AVE estimates with the squared
phi coefficient reflecting the correlation between the measures of
GREEN and SRCB provided additional evidence of discriminant
validity between GREEN and SRCB (Anderson & Gerbing,
1988). A chi-square difference test comparing a one-factor model
to a two-factor correlated model also supported discriminant
validity between GREEN and SRCB (Δχ2 (1) = 5168.25,
p b .001), while the corresponding RMSEA decreased from
0.16 to 0.07 (lower scores indicate a better fit; Anderson &
Gerbing, 1988).
One possibility is that Antil's SRCB index is more
comprehensive than our focus on green consumption values
and a subset of these items would be more representative of our
scale's environmental and consumption focus. Though Antil's
SRCB index is one-dimensional, we conducted a factor
analysis to determine the six items that were most closely
associated with our GREEN scale. All six of these items
concerned the environment and not other social issues; for
example: “All consumers should be interested in the environ-
mental consequences of the products they purchase” (see
Appendix A for all items). Using this ad-hoc index created from
Table 1
Study 1a–1d: Confirmatory factor analysis results.
Factor loading estimates
GREEN items Study
1a
Study
1b
Study
1c
Study
1d
It is important to me that the products
I use do not harm the
environment.
.73 .86 .73 .73
I consider the potential
environmental
impact of my actions when
making many of my decisions.
.81 .91 .81 .80
My purchase habits are affected by
my concern for our environment.
.78 .90 .77 .79
I am concerned about wasting the
resources of our planet.
.75 .86 .76 .79
I would describe myself as
environmentally responsible.
.78 .82 .77 .75
I am willing to be inconvenienced
in order to take actions
that are more environmentally
friendly.
.83 .82 .83 .83
Fit statistics
Comparative fit index (CFI) .96 .96 .96 .96
Normed fit index (NFI) .95 .96 .96 .96
Standardized root mean
residual (SRMR)
.05 .04 .05 .04
Χ2 , 9 df 72.6 156.4 56.1 57.3
Table 2
Summary of correlations among green and consumer measures, study 1a.
Alpha Mean SD 1 2 3 4 5 6 7 8 9 10
1. Green .89 3.95 .67
2. SRCB .88 3.96 1.19 .63
3. Short SRCB .87 3.99 1.17 .69 .85
4. Frugality .82 5.14 1.19 .24 .21 .29
5. CSSC .94 5.57 .82 .19 .08 .13 .66
6. Value consciousness .87 3.56 1.27 .20 .21 .21 .49 .42
7. Price consciousness .83 5.46 1.10 .31 .27 .29 .40 .30 .49
8. PRT .93 4.66 1.58 .21 .20 .25 .20 .11 .17 .11
9. Creative reuse .54 3.25 1.10 .23 .25 .26 .27 .18 .41 .24 .30
10. Multiple use .64 4.15 .94 .32 .26 .28 .30 .25 .27 .31 .39 .68
11. Voluntary simplicity .89 4.16 1.27 .31 .22 .29 .25 .20 .24 .24 .26 .48 .56
Note. All correlations of .14 or greater are significant at p b .05. SRCB is Socially Responsible Consumption Behavior from Antil (1984); Short SRCB is six
environmental items from Antil's SRCB; Frugality (Lastovicka et al., 1999); CSSC is consumer spending self-control from Haws, Bearden, et al. (2012); Value and
price consciousness are from Lichtenstein et al. (1990); PRT is product retention tendency from Haws, Naylor, et al. (2012); and creative reuse, multiple use, and
voluntary simplicity are from use innovativeness by Price and Ridgeway (1983).
339K.L. Haws et al. / Journal of Consumer Psychology 24, 3 (2014) 336–354
recommendations by Bearden, Netemeyer, and Haws (2010) and
Bearden, Netemeyer, and Teel (1989). This process led to the
elimination of four items. Accordingly, we determined that the
remaining six items were highly reliable (α = .89) and could
succinctly capture the green construct (See Table 1 for final items).
Confirmatory factor analysis using the six items demonstrated
strong fit of the model (see Table 1). Procedures recommended by
Fornell and Larcker (1981) showed: (1) the average variance
extracted (.61) exceeded the recommended value of .50 and (2)
construct reliability (.90) also implied a good fitting model.
From both a managerial and a research perspective, the most
parsimonious measure possible that still captures the core
construct fully is the most useful (Haws, Naylor et al., 2012;
Richins, 2004).
With this six-item scale, we proceeded to analyze the
relationships with Antil's SRCB and other constructs theorized
as part of the nomological network. All existing measures were
assessed for reliability and averaged into indices following the
instructions of the original scales, except for price consciousness,
which was reverse-coded, such that higher values indicate more
price consciousness, to be consistent with the other measures. All
descriptive statistics and correlations among constructs are also
shown in Table 2. As expected, GREEN was highly correlated
with Antil's SRCB index (r = .63, p b .0001). This strong
correlation not only provides evidence of the validity of our
measure but also suggests that our six-item measure sufficiently
captures the content of the 40-item SRCB. However, we also
expected the two measures to show distinction. Confirmatory
factor analysis revealed a phi coefficient of .46 between GREEN
and SRCB. Comparison of the AVE estimates with the squared
phi coefficient reflecting the correlation between the measures of
GREEN and SRCB provided additional evidence of discriminant
validity between GREEN and SRCB (Anderson & Gerbing,
1988). A chi-square difference test comparing a one-factor model
to a two-factor correlated model also supported discriminant
validity between GREEN and SRCB (Δχ2 (1) = 5168.25,
p b .001), while the corresponding RMSEA decreased from
0.16 to 0.07 (lower scores indicate a better fit; Anderson &
Gerbing, 1988).
One possibility is that Antil's SRCB index is more
comprehensive than our focus on green consumption values
and a subset of these items would be more representative of our
scale's environmental and consumption focus. Though Antil's
SRCB index is one-dimensional, we conducted a factor
analysis to determine the six items that were most closely
associated with our GREEN scale. All six of these items
concerned the environment and not other social issues; for
example: “All consumers should be interested in the environ-
mental consequences of the products they purchase” (see
Appendix A for all items). Using this ad-hoc index created from
Table 1
Study 1a–1d: Confirmatory factor analysis results.
Factor loading estimates
GREEN items Study
1a
Study
1b
Study
1c
Study
1d
It is important to me that the products
I use do not harm the
environment.
.73 .86 .73 .73
I consider the potential
environmental
impact of my actions when
making many of my decisions.
.81 .91 .81 .80
My purchase habits are affected by
my concern for our environment.
.78 .90 .77 .79
I am concerned about wasting the
resources of our planet.
.75 .86 .76 .79
I would describe myself as
environmentally responsible.
.78 .82 .77 .75
I am willing to be inconvenienced
in order to take actions
that are more environmentally
friendly.
.83 .82 .83 .83
Fit statistics
Comparative fit index (CFI) .96 .96 .96 .96
Normed fit index (NFI) .95 .96 .96 .96
Standardized root mean
residual (SRMR)
.05 .04 .05 .04
Χ2 , 9 df 72.6 156.4 56.1 57.3
Table 2
Summary of correlations among green and consumer measures, study 1a.
Alpha Mean SD 1 2 3 4 5 6 7 8 9 10
1. Green .89 3.95 .67
2. SRCB .88 3.96 1.19 .63
3. Short SRCB .87 3.99 1.17 .69 .85
4. Frugality .82 5.14 1.19 .24 .21 .29
5. CSSC .94 5.57 .82 .19 .08 .13 .66
6. Value consciousness .87 3.56 1.27 .20 .21 .21 .49 .42
7. Price consciousness .83 5.46 1.10 .31 .27 .29 .40 .30 .49
8. PRT .93 4.66 1.58 .21 .20 .25 .20 .11 .17 .11
9. Creative reuse .54 3.25 1.10 .23 .25 .26 .27 .18 .41 .24 .30
10. Multiple use .64 4.15 .94 .32 .26 .28 .30 .25 .27 .31 .39 .68
11. Voluntary simplicity .89 4.16 1.27 .31 .22 .29 .25 .20 .24 .24 .26 .48 .56
Note. All correlations of .14 or greater are significant at p b .05. SRCB is Socially Responsible Consumption Behavior from Antil (1984); Short SRCB is six
environmental items from Antil's SRCB; Frugality (Lastovicka et al., 1999); CSSC is consumer spending self-control from Haws, Bearden, et al. (2012); Value and
price consciousness are from Lichtenstein et al. (1990); PRT is product retention tendency from Haws, Naylor, et al. (2012); and creative reuse, multiple use, and
voluntary simplicity are from use innovativeness by Price and Ridgeway (1983).
339K.L. Haws et al. / Journal of Consumer Psychology 24, 3 (2014) 336–354
End of preview
Want to access all the pages? Upload your documents or become a member.
Related Documents
Consumers' perceptions of luxury brands’ CSR initiativeslg...
|11
|14121
|416