Hotel Finance and Revenue: Financial Analysis of British Airways
VerifiedAdded on 2023/06/09
|24
|5092
|348
AI Summary
This report paper conducts a financial analysis of British Airways through ratio analysis, trend analysis, and other tools to evaluate the stability, profitability, liquidity, solvency, and capital structure of the company. The report also provides recommendations based on the findings.
Contribute Materials
Your contribution can guide someone’s learning journey. Share your
documents today.
Running Head: Hotel Finance and revenue
1
Project Report: Hotel Finance and revenue
1
Project Report: Hotel Finance and revenue
Secure Best Marks with AI Grader
Need help grading? Try our AI Grader for instant feedback on your assignments.
Hotel Finance and revenue
2
Contents
Introduction.......................................................................................................................3
Company overview...........................................................................................................3
Analysis and Findings.......................................................................................................3
Profitability ratios.........................................................................................................4
Efficiency ratios............................................................................................................6
Liquidity ratios..............................................................................................................8
Capital structure ratios..................................................................................................9
Investor’s ratios..........................................................................................................10
Discussion.......................................................................................................................12
Conclusion and recommendation...................................................................................12
References.......................................................................................................................14
Appendix.........................................................................................................................16
Hotel Finance and revenue
3
Introduction:
Evaluation on the financial statement of an organization is a process that helps the
companies, professionals, investors and the other stakeholders to identify the real
performance of the company and make better choices about the performance and the
investment into the company. In this process, all the financial related entities such as budgets,
projects, financial statement, and financial transactions etc of the business is identified and
evaluated to reach over a conclusion. Basically, these studied are conducted by the different
parties for different purpose. In context with the investors, financial analysis process is done
to measure the stability level, profitability, liquidity, solvency etc level of the business to
make an investment decision into the company (Higgins, 2012). In context with the financial
manager, the financial statement of the company is studied to make an idea about the overall
performance of the company and make the changes into the current policy and strategy of the
company.
Financial analysis process includes various tools and techniques through which the
financial performance of an organization could be evaluated easily as well as the position of
the business could be maintained. In this report paper, ratio analysis, trend analysis etc study
has been conducted on “British airways” to reach over a conclusion about the investment into
the company.
Company overview:
“British airways” is an UK company which has been awarded as largest airline in
2017 in context with the fleet size. The operations and the activities of the company are
handled by the head office of the company which is situated at Waterside at London Heat. It
has been founded in the year of 1974 and from that, the company has merged with other
company to diversify the market and manage the performance of the company. the company
is offering its products and the services at international destinations which also include the
Australian destinations. The current report explains that the company is serving into approx
183 destinations (Home, 2018). The financial analysis and evaluation explains that the
company has faced various phases in last few years however the current performance of the
company has been stable.
Analysis and Findings:
Hotel Finance and revenue
4
The financial evaluation study has been done on the financial statement of “British
airways” to measure the financial performance and the financial changes of the company. the
study of ratio analysis has been done on the company initially to evaluate the stability,
profitability, liquidity, solvency etc level of the business to make an investment decision into
the company. In addition, this study has also been performed to measure the changes into the
financial performance of the company in last 3 years.
The study of ratio analysis is a technical and quantitative analysis that measures the
information and the idea about the financial performance, changes and the position of the
company (Gapenski & Reiter, 2008). This study is used by the investors as well as by the
companies to evaluates and measure the numerous aspect related to the financial performance
of the company. It further explains that how the company is performing in context with the
stability, profitability, liquidity, solvency level. The ratio analysis of British airways is as
follows:
Profitability ratios:
Profitability ratios are one of the crucial tools to measure the profit generation level of
the business. It measures the net profit, gross profit and operating profit of the business
through different financial term to measure the profit generation capabilities of the business.
the profitability ratios make it easier for the analyst and the investors of the organization to
measure the profit generation level of the business. Profitability ratios include various ratios
to identity the profitability performance of the company. the profitability ratios of the
company are as follows:
Return on assets:
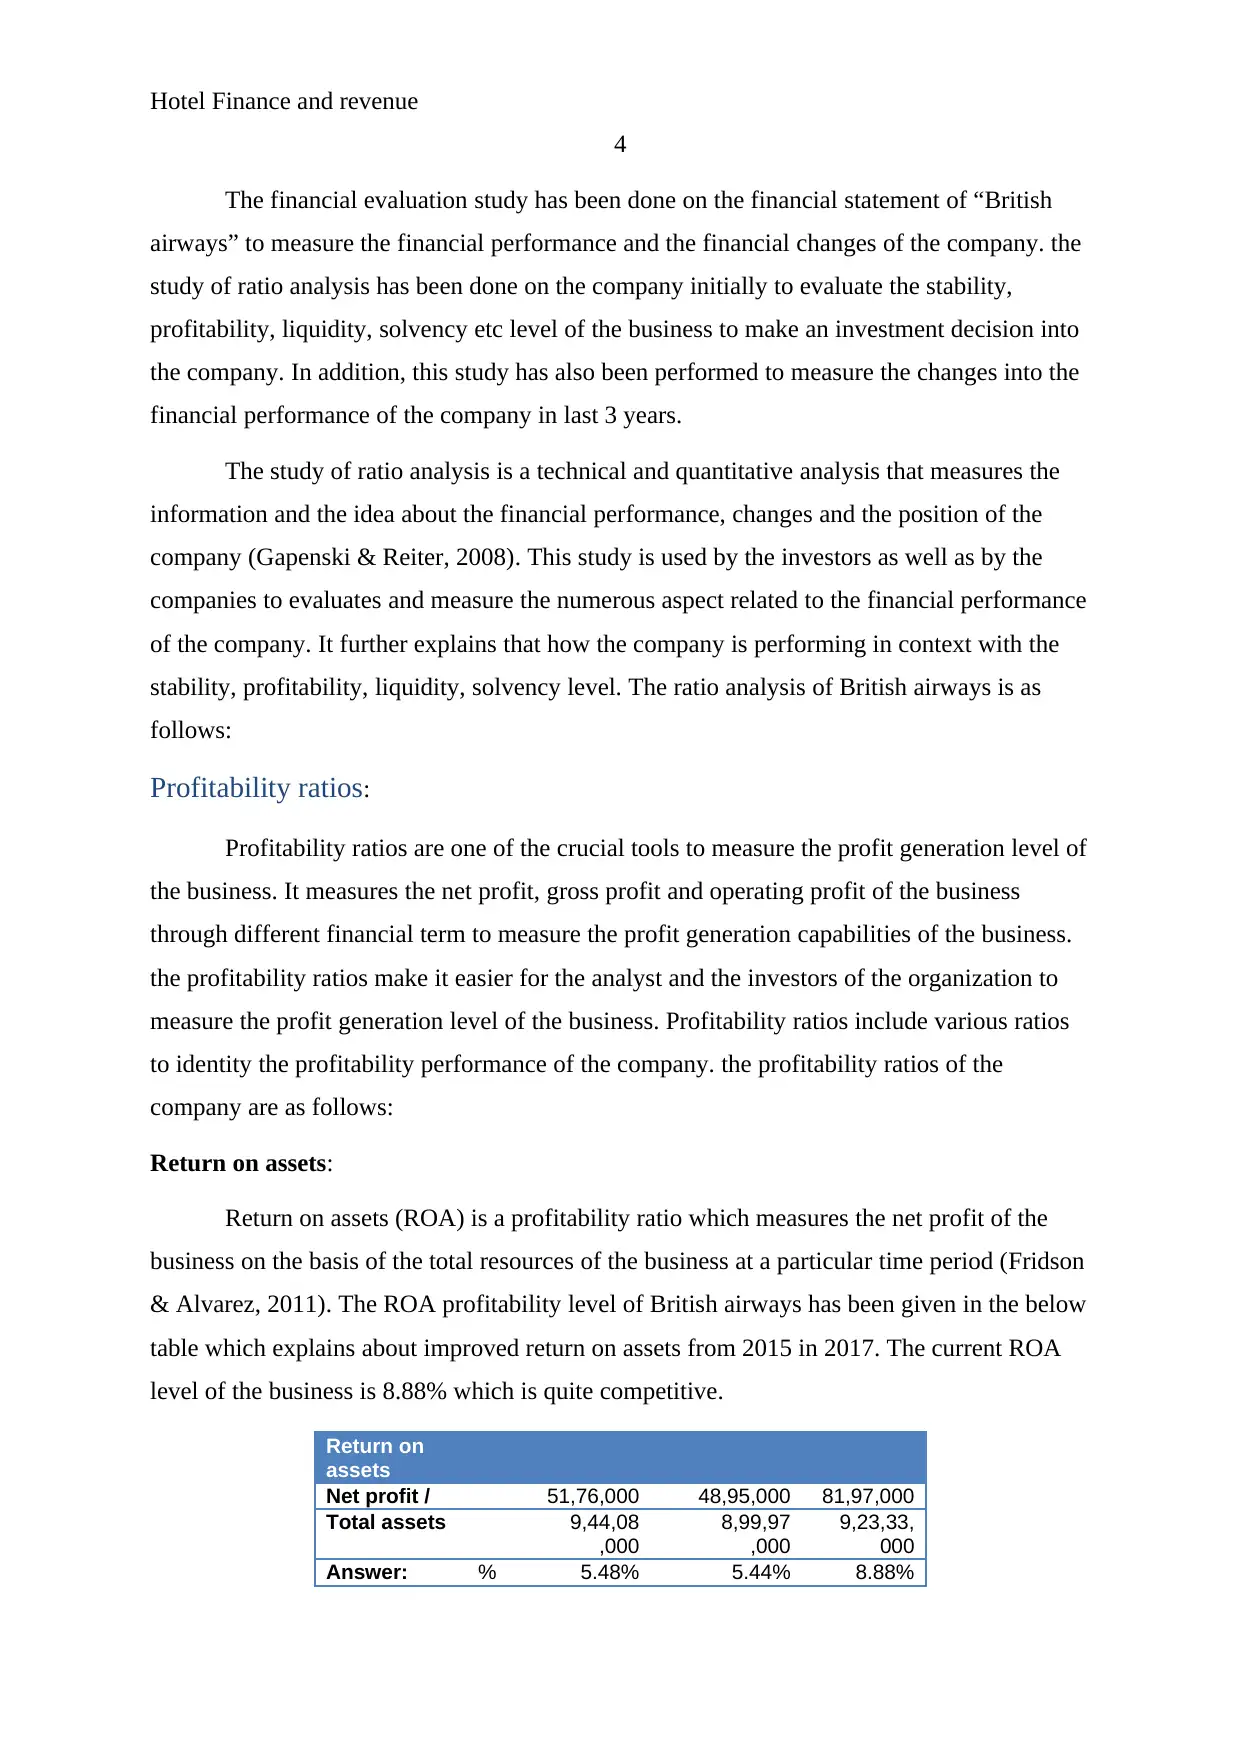
Return on assets (ROA) is a profitability ratio which measures the net profit of the
business on the basis of the total resources of the business at a particular time period (Fridson
& Alvarez, 2011). The ROA profitability level of British airways has been given in the below
table which explains about improved return on assets from 2015 in 2017. The current ROA
level of the business is 8.88% which is quite competitive.
Return on
assets
Net profit / 51,76,000 48,95,000 81,97,000
Total assets 9,44,08
,000
8,99,97
,000
9,23,33,
000
Answer: % 5.48% 5.44% 8.88%
4
The financial evaluation study has been done on the financial statement of “British
airways” to measure the financial performance and the financial changes of the company. the
study of ratio analysis has been done on the company initially to evaluate the stability,
profitability, liquidity, solvency etc level of the business to make an investment decision into
the company. In addition, this study has also been performed to measure the changes into the
financial performance of the company in last 3 years.
The study of ratio analysis is a technical and quantitative analysis that measures the
information and the idea about the financial performance, changes and the position of the
company (Gapenski & Reiter, 2008). This study is used by the investors as well as by the
companies to evaluates and measure the numerous aspect related to the financial performance
of the company. It further explains that how the company is performing in context with the
stability, profitability, liquidity, solvency level. The ratio analysis of British airways is as
follows:
Profitability ratios:
Profitability ratios are one of the crucial tools to measure the profit generation level of
the business. It measures the net profit, gross profit and operating profit of the business
through different financial term to measure the profit generation capabilities of the business.
the profitability ratios make it easier for the analyst and the investors of the organization to
measure the profit generation level of the business. Profitability ratios include various ratios
to identity the profitability performance of the company. the profitability ratios of the
company are as follows:
Return on assets:
Return on assets (ROA) is a profitability ratio which measures the net profit of the
business on the basis of the total resources of the business at a particular time period (Fridson
& Alvarez, 2011). The ROA profitability level of British airways has been given in the below
table which explains about improved return on assets from 2015 in 2017. The current ROA
level of the business is 8.88% which is quite competitive.
Return on
assets
Net profit / 51,76,000 48,95,000 81,97,000
Total assets 9,44,08
,000
8,99,97
,000
9,23,33,
000
Answer: % 5.48% 5.44% 8.88%
Secure Best Marks with AI Grader
Need help grading? Try our AI Grader for instant feedback on your assignments.
Hotel Finance and revenue
5
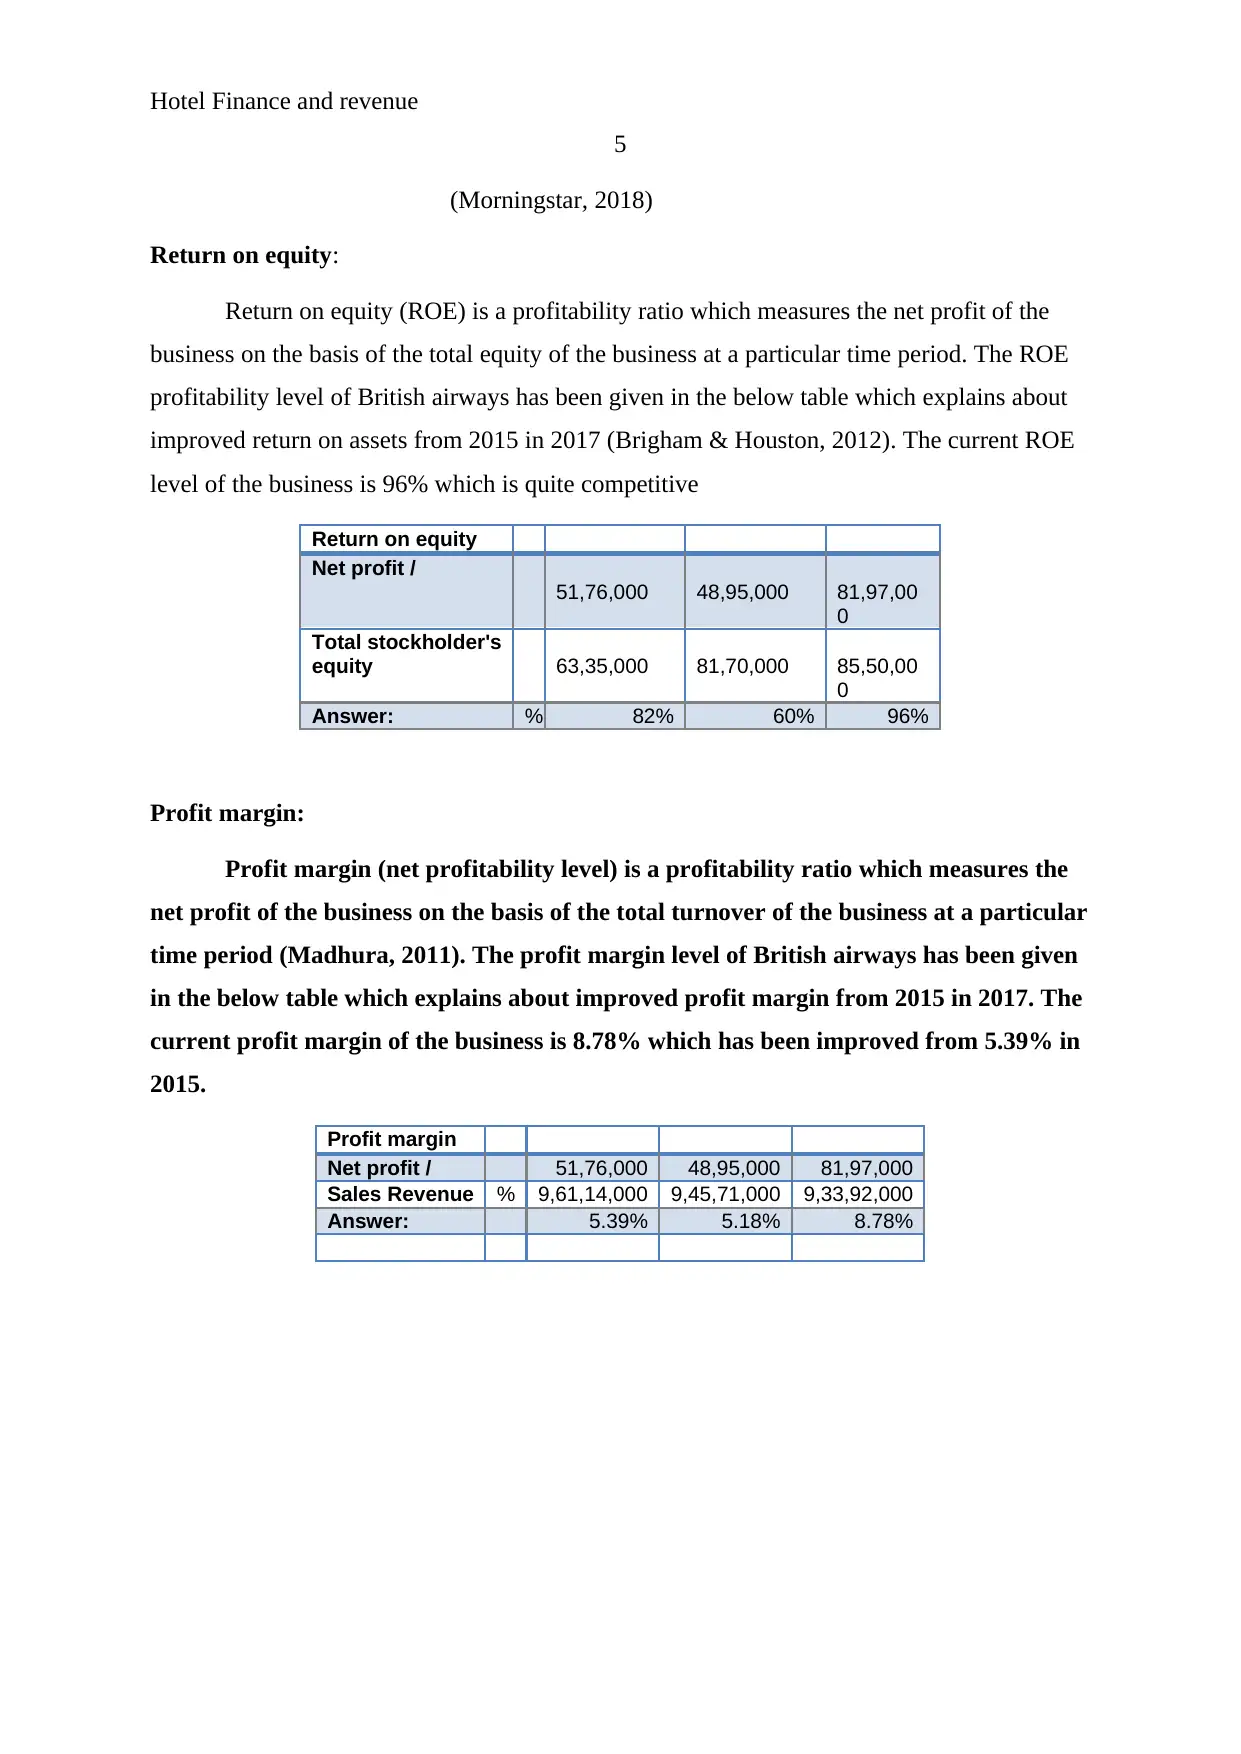
(Morningstar, 2018)
Return on equity:
Return on equity (ROE) is a profitability ratio which measures the net profit of the
business on the basis of the total equity of the business at a particular time period. The ROE
profitability level of British airways has been given in the below table which explains about
improved return on assets from 2015 in 2017 (Brigham & Houston, 2012). The current ROE
level of the business is 96% which is quite competitive
Return on equity
Net profit /
51,76,000 48,95,000 81,97,00
0
Total stockholder's
equity 63,35,000 81,70,000 85,50,00
0
Answer: % 82% 60% 96%
Profit margin:
Profit margin (net profitability level) is a profitability ratio which measures the
net profit of the business on the basis of the total turnover of the business at a particular
time period (Madhura, 2011). The profit margin level of British airways has been given
in the below table which explains about improved profit margin from 2015 in 2017. The
current profit margin of the business is 8.78% which has been improved from 5.39% in
2015.
Profit margin
Net profit / 51,76,000 48,95,000 81,97,000
Sales Revenue % 9,61,14,000 9,45,71,000 9,33,92,000
Answer: 5.39% 5.18% 8.78%
5
(Morningstar, 2018)
Return on equity:
Return on equity (ROE) is a profitability ratio which measures the net profit of the
business on the basis of the total equity of the business at a particular time period. The ROE
profitability level of British airways has been given in the below table which explains about
improved return on assets from 2015 in 2017 (Brigham & Houston, 2012). The current ROE
level of the business is 96% which is quite competitive
Return on equity
Net profit /
51,76,000 48,95,000 81,97,00
0
Total stockholder's
equity 63,35,000 81,70,000 85,50,00
0
Answer: % 82% 60% 96%
Profit margin:
Profit margin (net profitability level) is a profitability ratio which measures the
net profit of the business on the basis of the total turnover of the business at a particular
time period (Madhura, 2011). The profit margin level of British airways has been given
in the below table which explains about improved profit margin from 2015 in 2017. The
current profit margin of the business is 8.78% which has been improved from 5.39% in
2015.
Profit margin
Net profit / 51,76,000 48,95,000 81,97,000
Sales Revenue % 9,61,14,000 9,45,71,000 9,33,92,000
Answer: 5.39% 5.18% 8.78%
Hotel Finance and revenue
6
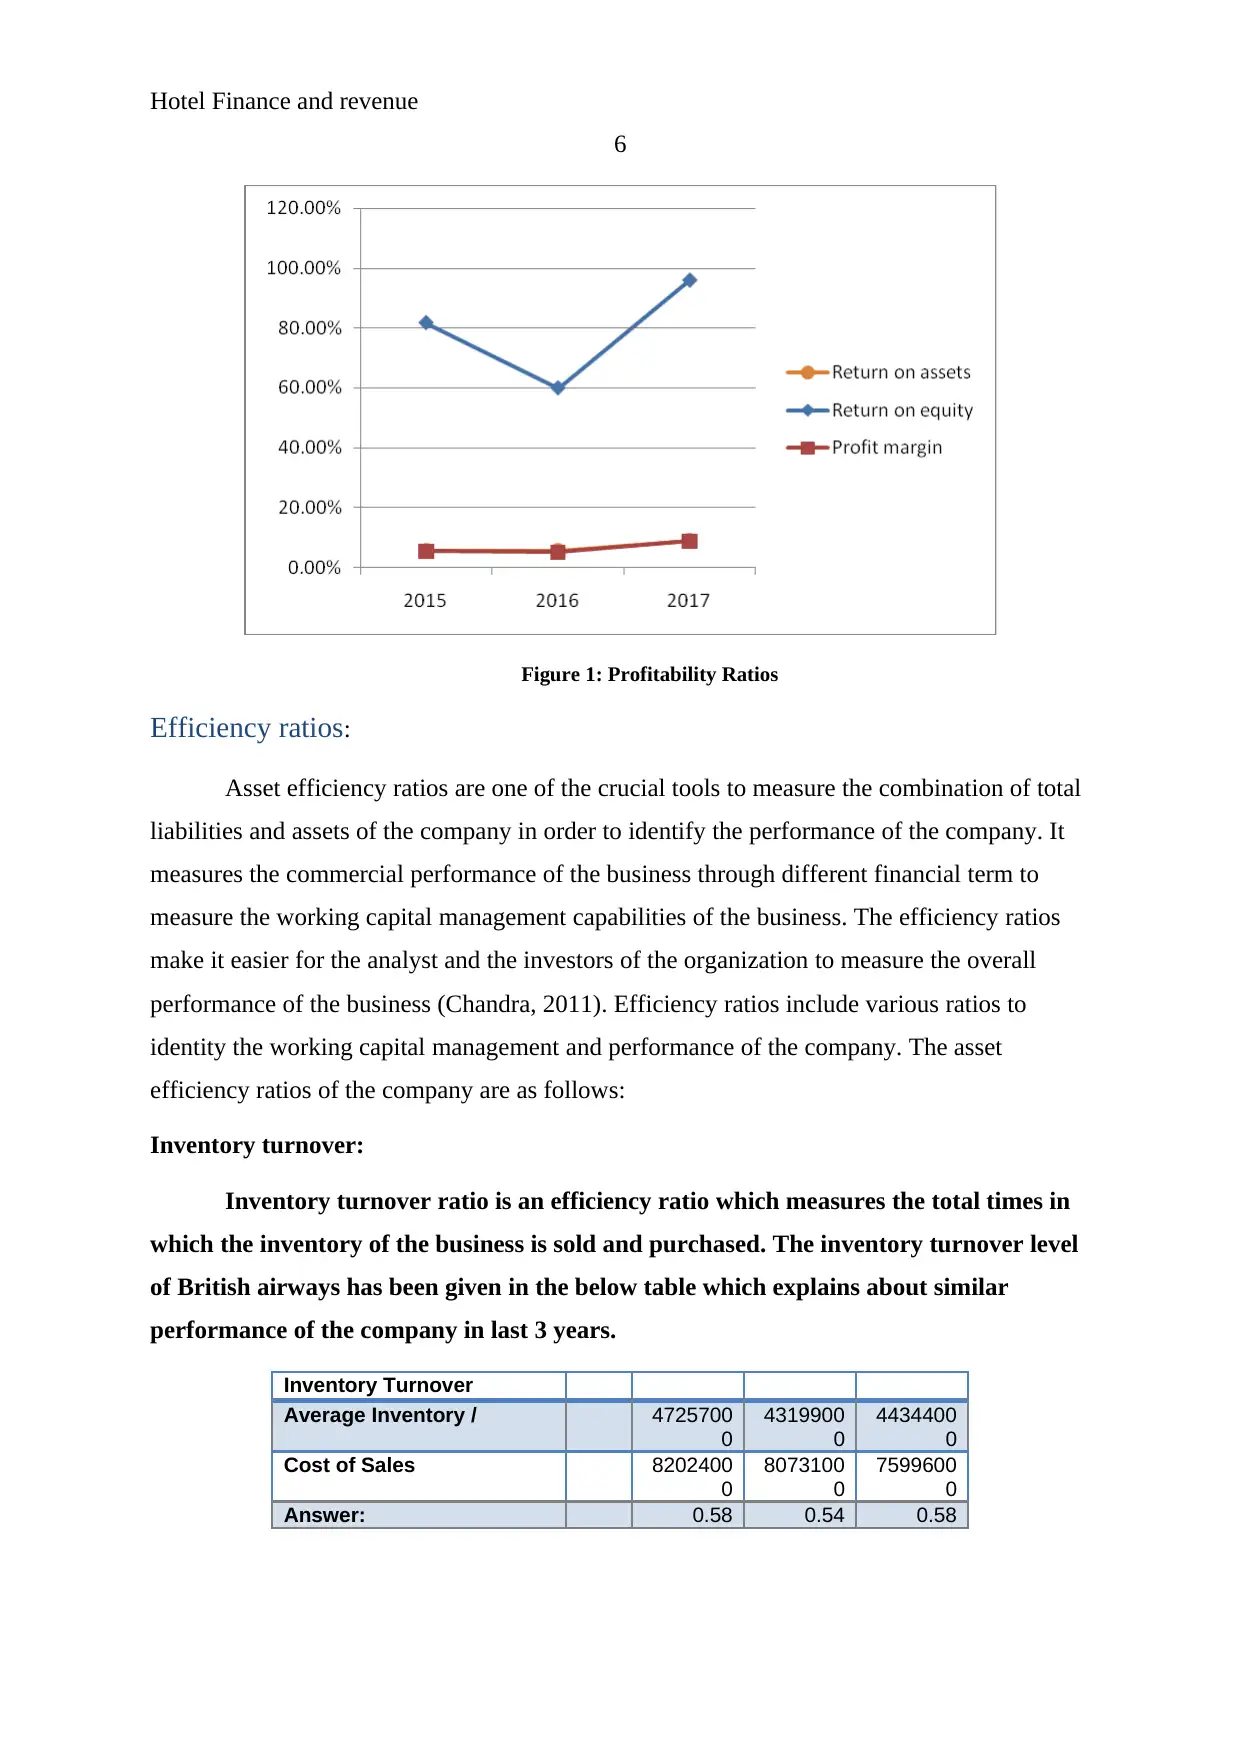
Figure 1: Profitability Ratios
Efficiency ratios:
Asset efficiency ratios are one of the crucial tools to measure the combination of total
liabilities and assets of the company in order to identify the performance of the company. It
measures the commercial performance of the business through different financial term to
measure the working capital management capabilities of the business. The efficiency ratios
make it easier for the analyst and the investors of the organization to measure the overall
performance of the business (Chandra, 2011). Efficiency ratios include various ratios to
identity the working capital management and performance of the company. The asset
efficiency ratios of the company are as follows:
Inventory turnover:
Inventory turnover ratio is an efficiency ratio which measures the total times in
which the inventory of the business is sold and purchased. The inventory turnover level
of British airways has been given in the below table which explains about similar
performance of the company in last 3 years.
Inventory Turnover
Average Inventory / 4725700
0
4319900
0
4434400
0
Cost of Sales 8202400
0
8073100
0
7599600
0
Answer: 0.58 0.54 0.58
6
Figure 1: Profitability Ratios
Efficiency ratios:
Asset efficiency ratios are one of the crucial tools to measure the combination of total
liabilities and assets of the company in order to identify the performance of the company. It
measures the commercial performance of the business through different financial term to
measure the working capital management capabilities of the business. The efficiency ratios
make it easier for the analyst and the investors of the organization to measure the overall
performance of the business (Chandra, 2011). Efficiency ratios include various ratios to
identity the working capital management and performance of the company. The asset
efficiency ratios of the company are as follows:
Inventory turnover:
Inventory turnover ratio is an efficiency ratio which measures the total times in
which the inventory of the business is sold and purchased. The inventory turnover level
of British airways has been given in the below table which explains about similar
performance of the company in last 3 years.
Inventory Turnover
Average Inventory / 4725700
0
4319900
0
4434400
0
Cost of Sales 8202400
0
8073100
0
7599600
0
Answer: 0.58 0.54 0.58
Hotel Finance and revenue
7
Inventory turnover (days):
Inventory turnover days are an efficiency ratio which measures the total time
period in which the inventory of the business would be turned. The inventory turnover
level (days) of British airways has been given in the below table which explains about
similar performance of the company in last 3 years
Inventory Turnover (days)
Average Inventory / 4,72,57,
000
4,31,99,
000
4,43,44,
000
Cost of Sales #
days
8,20,24,
000
8,07,31,
000
7,59,96,
000
Answer: (note the above needs to
be x 365)
210.29 195.31 212.98
Accounts receivable turnover:
Accounts receivable ratio is an efficiency ratio which measures the total time in
which the debtor’s amount would be received and new debtor’s amount would take
place (Rose & Hudgins, 2012). The accounts receivable turnover level of British airways
has been given in the below table which explains about improved level of the company
in last 3 years. It explains that more working capital is required by the business now.
Accounts receivable
turnover
Average trade debtors / 8003000 7804000 9763000
Sales revenue 9,61,14,00
0
9,45,71,00
0
9,33,92,00
0
Answer: 0.083 0.083 0.105
Accounts receivable turnover (days):
Accounts receivable turnover days ratio is an efficiency ratio which measures the total
time period in which the debtor’s amount would be received and new debtor’s amount would
take place. The accounts receivable turnover days level of British airways has been given in
the below table which explains about improved level of the company in last 3 years. It
explains that more working capital is required by the business now.
Receivables Turnover
(days)
Average trade debtors / 80, 78, 97,6
Paraphrase This Document
Need a fresh take? Get an instant paraphrase of this document with our AI Paraphraser
Hotel Finance and revenue
8
03,000 04,000 3,000
Sales revenue (note used
operating revenue)
#
da
ys
9,61
,14,000
9,45
,71,000
9,33,
92,000
Answer: (note the above
needs to be x 365)
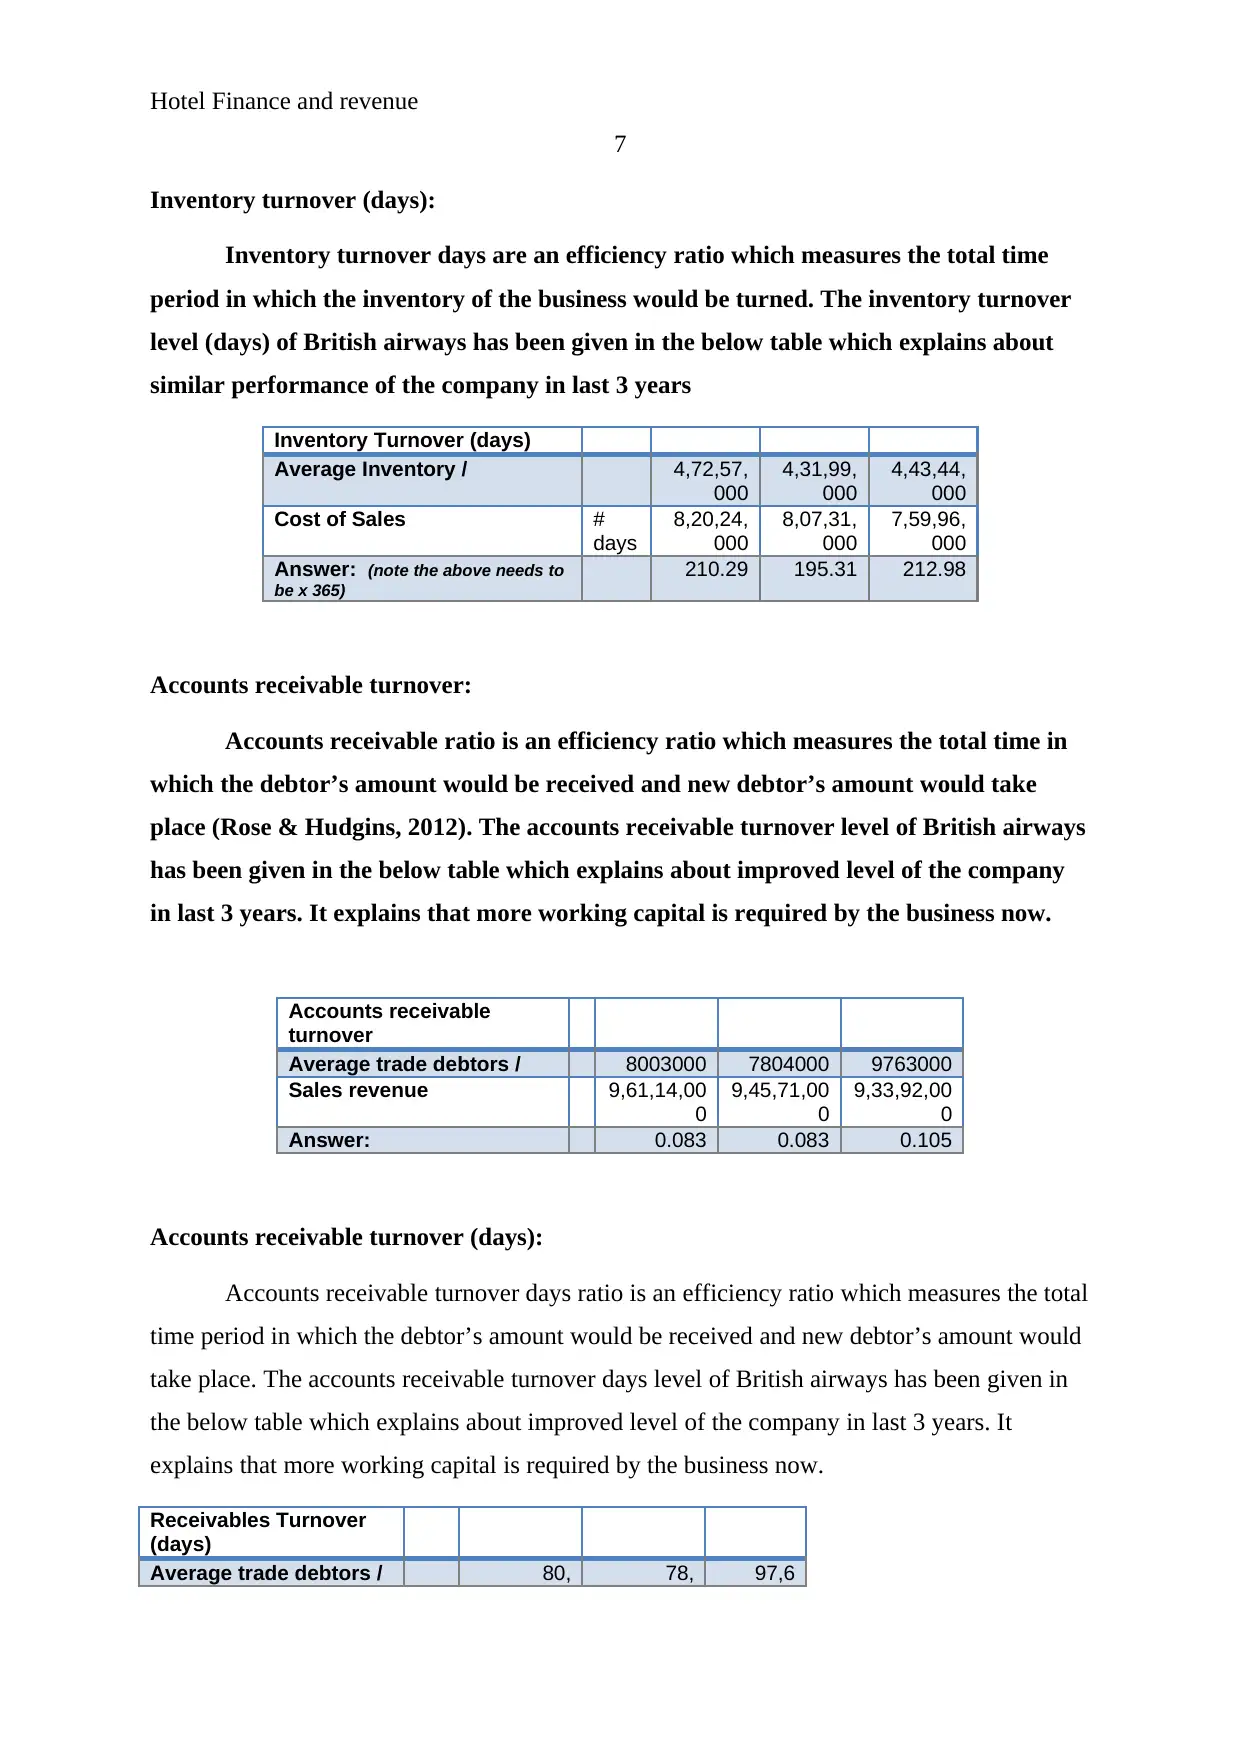
30.39 30.12 38.16
Figure 2: Efficiency Ratios
Liquidity ratios:
Liquidity ratios are one of the crucial tools to measure the short term debt payment
capability of the company in order to identify the risk level and the performance of the
company. It measures the liquidity performance of the business through current assets and
current liabilities to measure that whether the business would be able to repay all the current
liabilities at any time (Rabin, 2013). The liquidity ratios make it easier for the analyst and the
investors of the organization to measure the overall performance and the risk level of the
business. Liquidity ratios include various ratios to identity the short term debt payment
capability of the company. The liquidity ratios of the company are as follows:
Current ratio:
Current ratio measures the current assets and liabilities of an organization to identify
that whether the company has sufficient current assets to repay the current liabilities at any
time. Current ratio makes it easier for the management of the company to measure the overall
8
03,000 04,000 3,000
Sales revenue (note used
operating revenue)
#
da
ys
9,61
,14,000
9,45
,71,000
9,33,
92,000
Answer: (note the above
needs to be x 365)
30.39 30.12 38.16
Figure 2: Efficiency Ratios
Liquidity ratios:
Liquidity ratios are one of the crucial tools to measure the short term debt payment
capability of the company in order to identify the risk level and the performance of the
company. It measures the liquidity performance of the business through current assets and
current liabilities to measure that whether the business would be able to repay all the current
liabilities at any time (Rabin, 2013). The liquidity ratios make it easier for the analyst and the
investors of the organization to measure the overall performance and the risk level of the
business. Liquidity ratios include various ratios to identity the short term debt payment
capability of the company. The liquidity ratios of the company are as follows:
Current ratio:
Current ratio measures the current assets and liabilities of an organization to identify
that whether the company has sufficient current assets to repay the current liabilities at any
time. Current ratio makes it easier for the management of the company to measure the overall
Hotel Finance and revenue
9
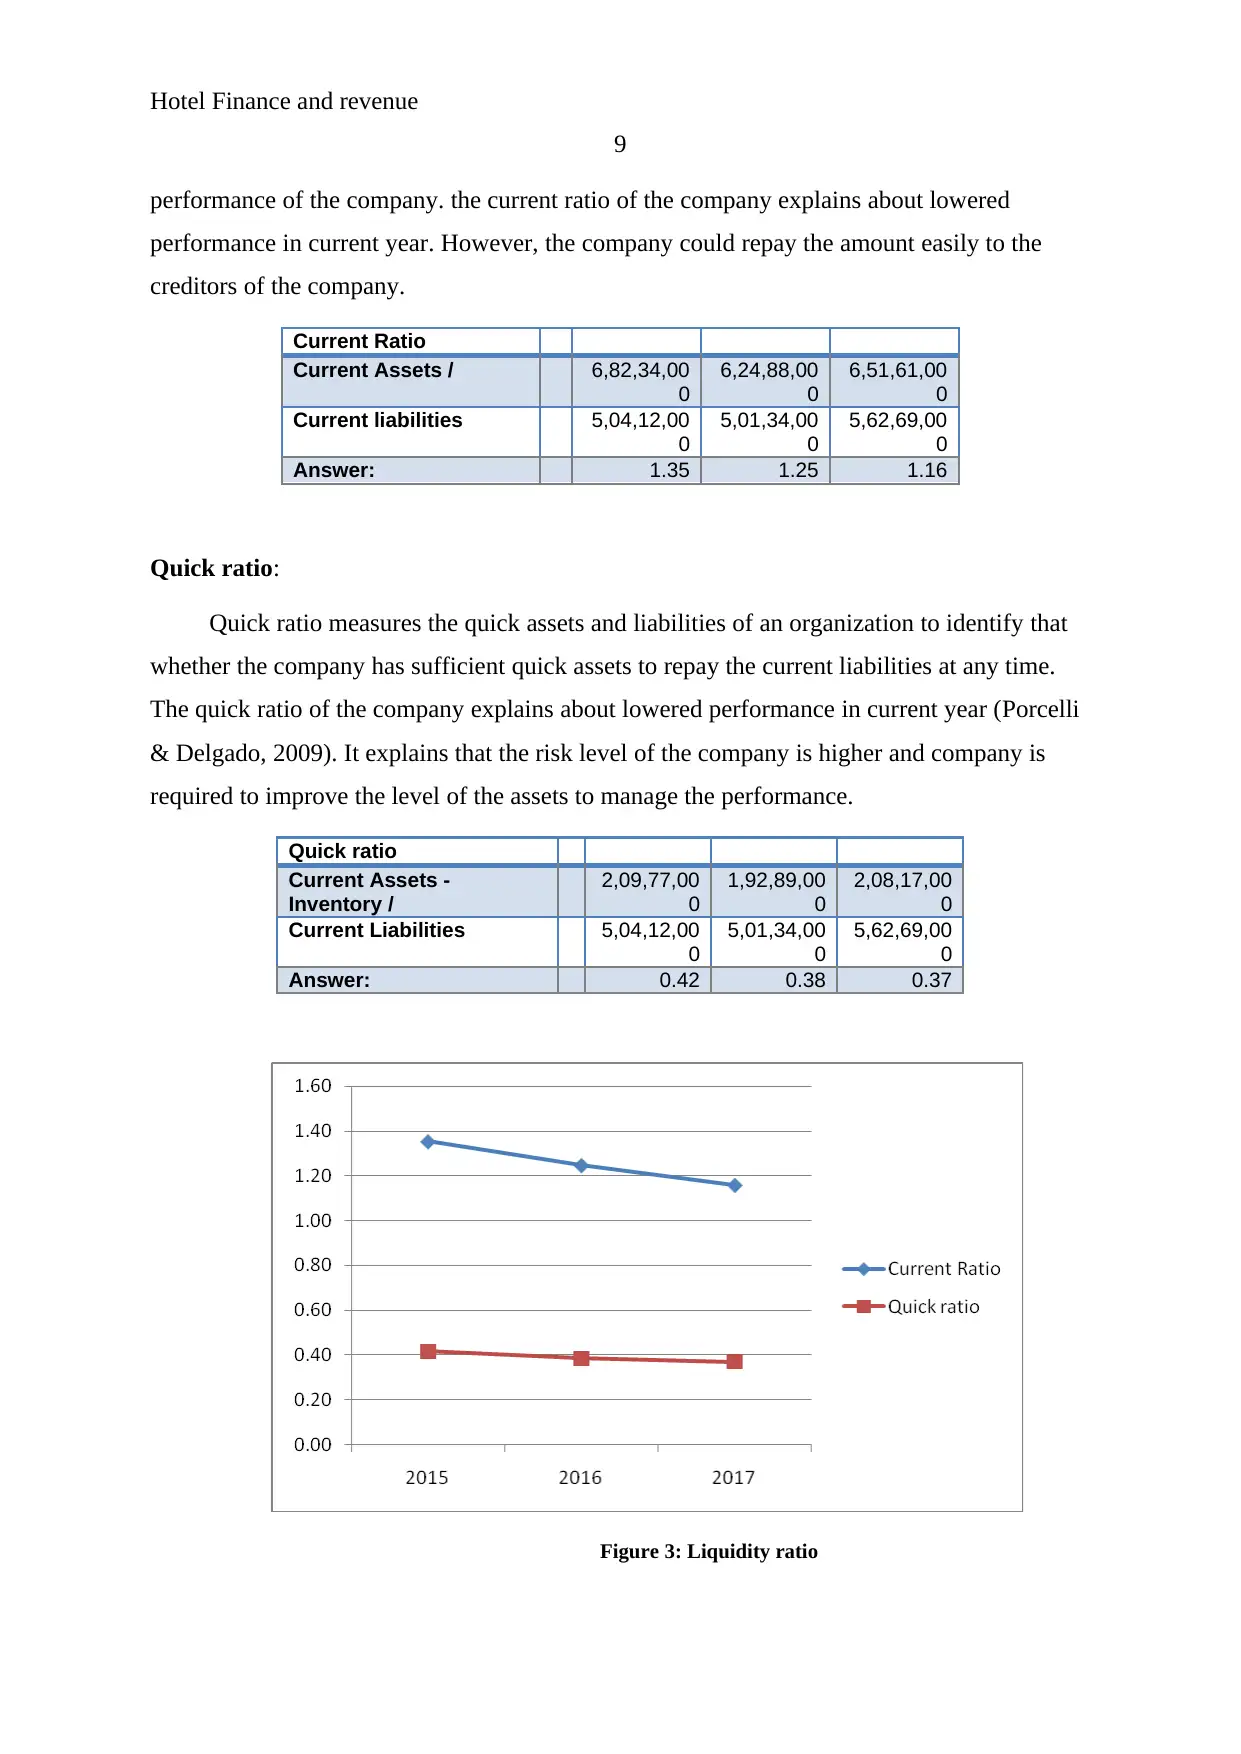
performance of the company. the current ratio of the company explains about lowered
performance in current year. However, the company could repay the amount easily to the
creditors of the company.
Current Ratio
Current Assets / 6,82,34,00
0
6,24,88,00
0
6,51,61,00
0
Current liabilities 5,04,12,00
0
5,01,34,00
0
5,62,69,00
0
Answer: 1.35 1.25 1.16
Quick ratio:
Quick ratio measures the quick assets and liabilities of an organization to identify that
whether the company has sufficient quick assets to repay the current liabilities at any time.
The quick ratio of the company explains about lowered performance in current year (Porcelli
& Delgado, 2009). It explains that the risk level of the company is higher and company is
required to improve the level of the assets to manage the performance.
Quick ratio
Current Assets -
Inventory /
2,09,77,00
0
1,92,89,00
0
2,08,17,00
0
Current Liabilities 5,04,12,00
0
5,01,34,00
0
5,62,69,00
0
Answer: 0.42 0.38 0.37
Figure 3: Liquidity ratio
9
performance of the company. the current ratio of the company explains about lowered
performance in current year. However, the company could repay the amount easily to the
creditors of the company.
Current Ratio
Current Assets / 6,82,34,00
0
6,24,88,00
0
6,51,61,00
0
Current liabilities 5,04,12,00
0
5,01,34,00
0
5,62,69,00
0
Answer: 1.35 1.25 1.16
Quick ratio:
Quick ratio measures the quick assets and liabilities of an organization to identify that
whether the company has sufficient quick assets to repay the current liabilities at any time.
The quick ratio of the company explains about lowered performance in current year (Porcelli
& Delgado, 2009). It explains that the risk level of the company is higher and company is
required to improve the level of the assets to manage the performance.
Quick ratio
Current Assets -
Inventory /
2,09,77,00
0
1,92,89,00
0
2,08,17,00
0
Current Liabilities 5,04,12,00
0
5,01,34,00
0
5,62,69,00
0
Answer: 0.42 0.38 0.37
Figure 3: Liquidity ratio
Hotel Finance and revenue
10
(Morningstar, 2018)
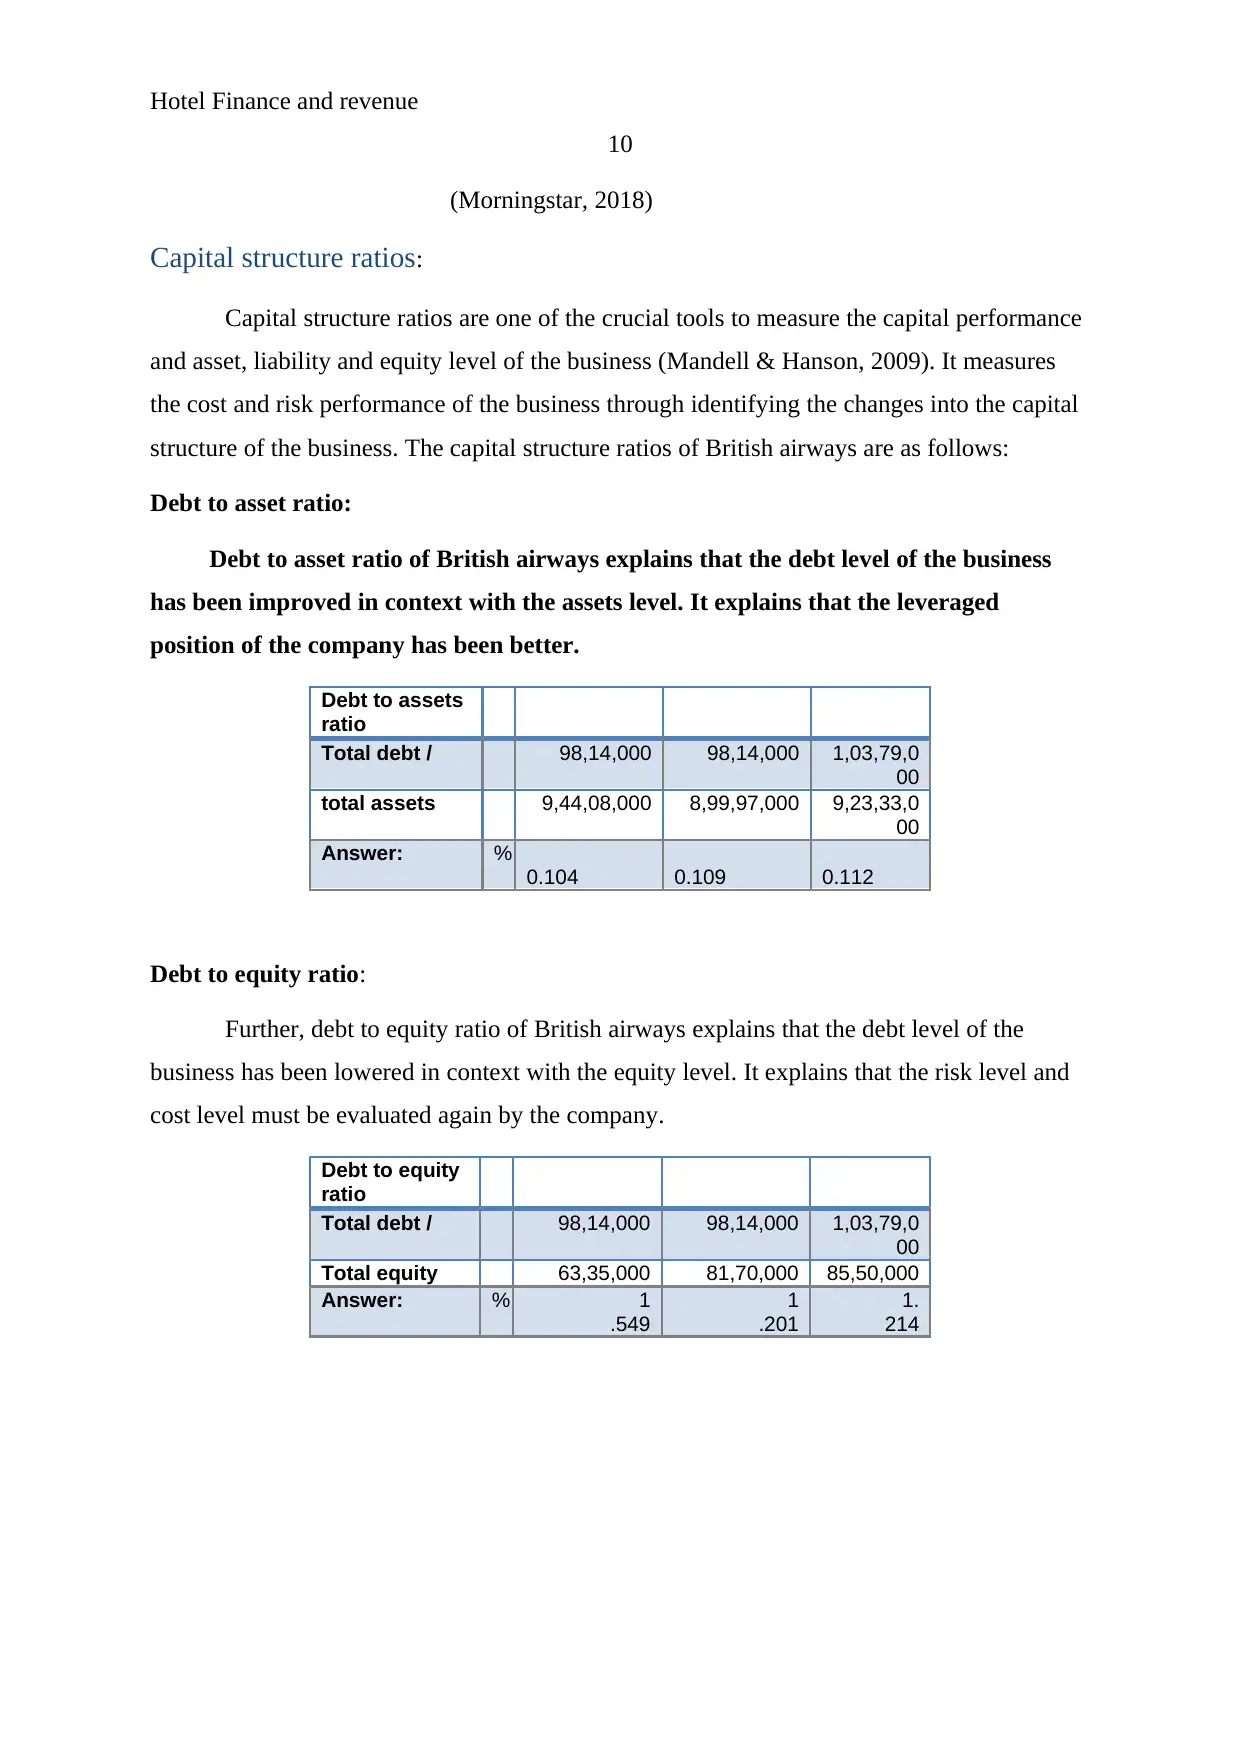
Capital structure ratios:
Capital structure ratios are one of the crucial tools to measure the capital performance
and asset, liability and equity level of the business (Mandell & Hanson, 2009). It measures
the cost and risk performance of the business through identifying the changes into the capital
structure of the business. The capital structure ratios of British airways are as follows:
Debt to asset ratio:
Debt to asset ratio of British airways explains that the debt level of the business
has been improved in context with the assets level. It explains that the leveraged
position of the company has been better.
Debt to assets
ratio
Total debt / 98,14,000 98,14,000 1,03,79,0
00
total assets 9,44,08,000 8,99,97,000 9,23,33,0
00
Answer: %
0.104 0.109 0.112
Debt to equity ratio:
Further, debt to equity ratio of British airways explains that the debt level of the
business has been lowered in context with the equity level. It explains that the risk level and
cost level must be evaluated again by the company.
Debt to equity
ratio
Total debt / 98,14,000 98,14,000 1,03,79,0
00
Total equity 63,35,000 81,70,000 85,50,000
Answer: % 1
.549
1
.201
1.
214
10
(Morningstar, 2018)
Capital structure ratios:
Capital structure ratios are one of the crucial tools to measure the capital performance
and asset, liability and equity level of the business (Mandell & Hanson, 2009). It measures
the cost and risk performance of the business through identifying the changes into the capital
structure of the business. The capital structure ratios of British airways are as follows:
Debt to asset ratio:
Debt to asset ratio of British airways explains that the debt level of the business
has been improved in context with the assets level. It explains that the leveraged
position of the company has been better.
Debt to assets
ratio
Total debt / 98,14,000 98,14,000 1,03,79,0
00
total assets 9,44,08,000 8,99,97,000 9,23,33,0
00
Answer: %
0.104 0.109 0.112
Debt to equity ratio:
Further, debt to equity ratio of British airways explains that the debt level of the
business has been lowered in context with the equity level. It explains that the risk level and
cost level must be evaluated again by the company.
Debt to equity
ratio
Total debt / 98,14,000 98,14,000 1,03,79,0
00
Total equity 63,35,000 81,70,000 85,50,000
Answer: % 1
.549
1
.201
1.
214
Secure Best Marks with AI Grader
Need help grading? Try our AI Grader for instant feedback on your assignments.
Hotel Finance and revenue
11
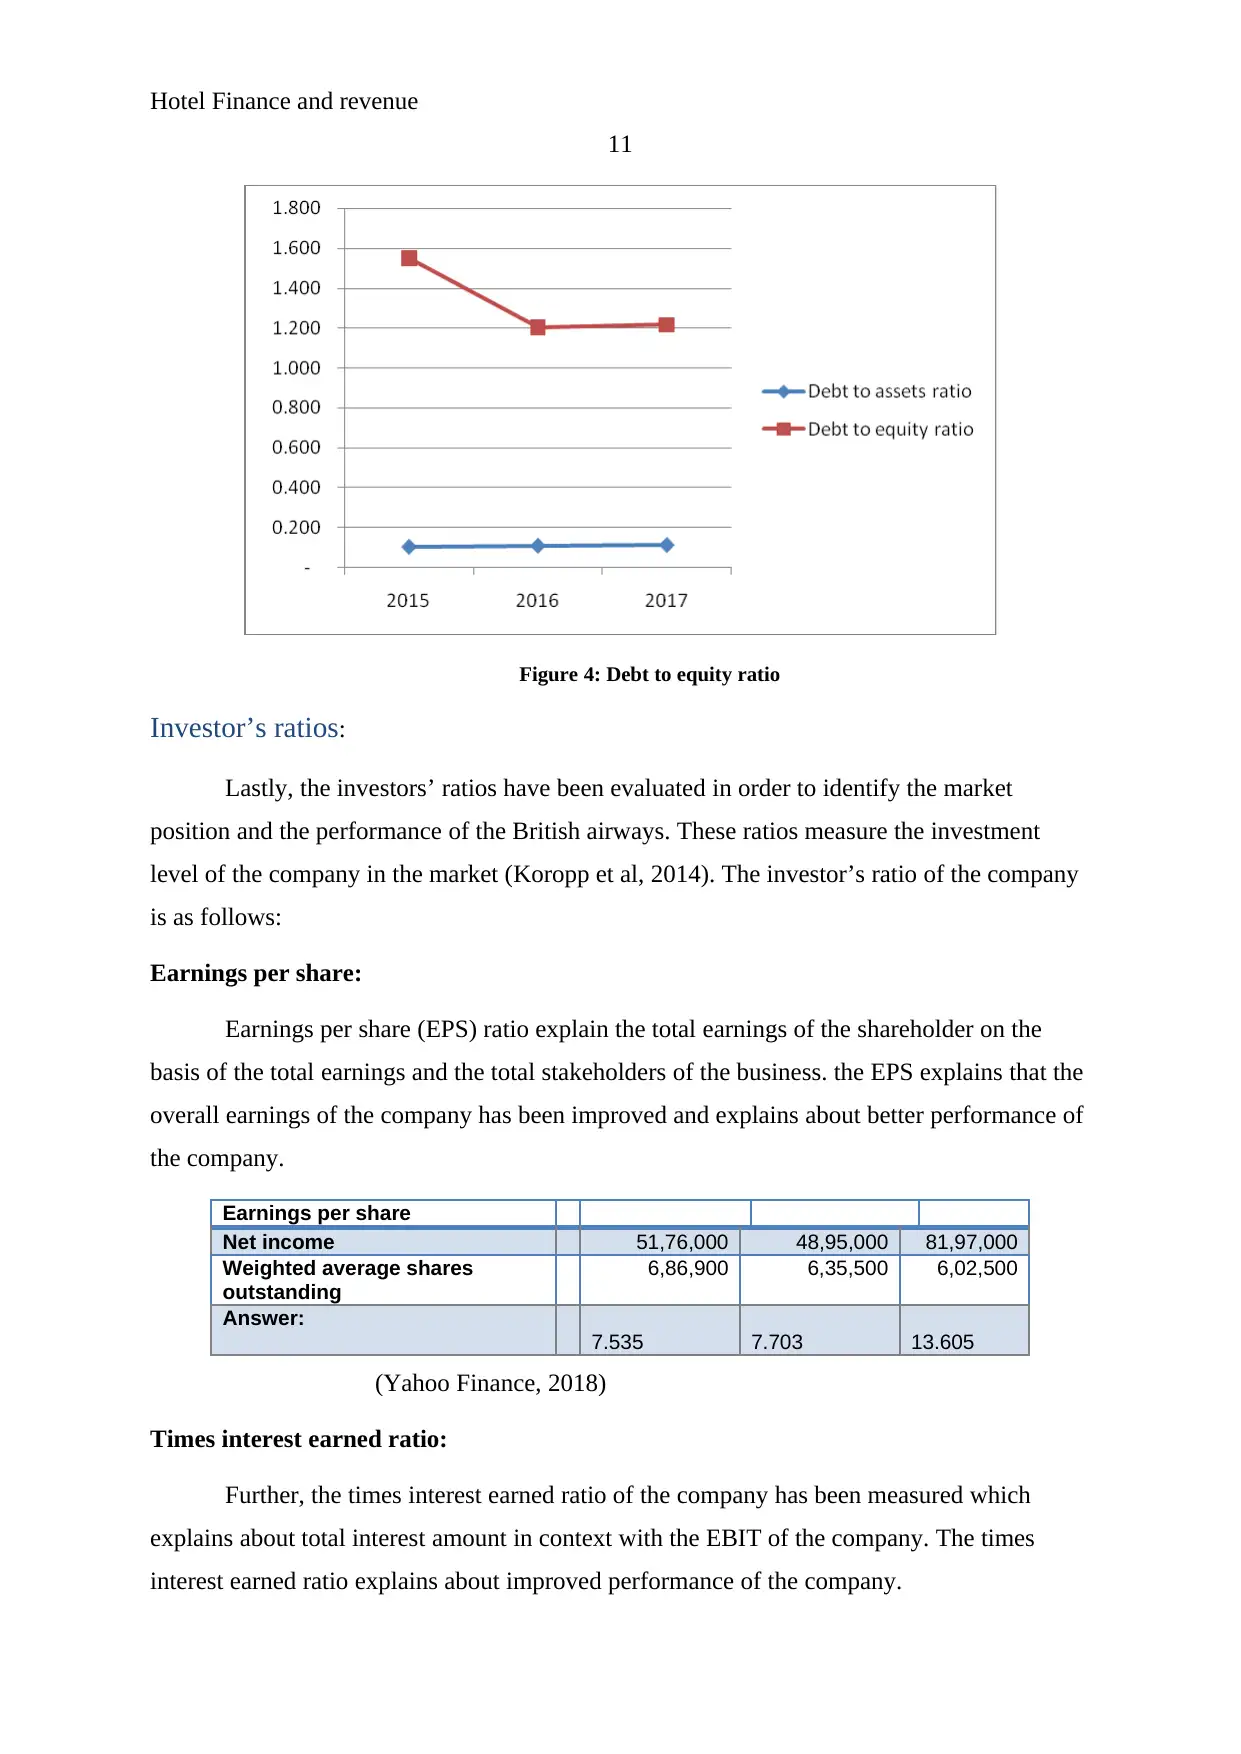
Figure 4: Debt to equity ratio
Investor’s ratios:
Lastly, the investors’ ratios have been evaluated in order to identify the market
position and the performance of the British airways. These ratios measure the investment
level of the company in the market (Koropp et al, 2014). The investor’s ratio of the company
is as follows:
Earnings per share:
Earnings per share (EPS) ratio explain the total earnings of the shareholder on the
basis of the total earnings and the total stakeholders of the business. the EPS explains that the
overall earnings of the company has been improved and explains about better performance of
the company.
Earnings per share
Net income 51,76,000 48,95,000 81,97,000
Weighted average shares
outstanding
6,86,900 6,35,500 6,02,500
Answer:
7.535 7.703 13.605
(Yahoo Finance, 2018)
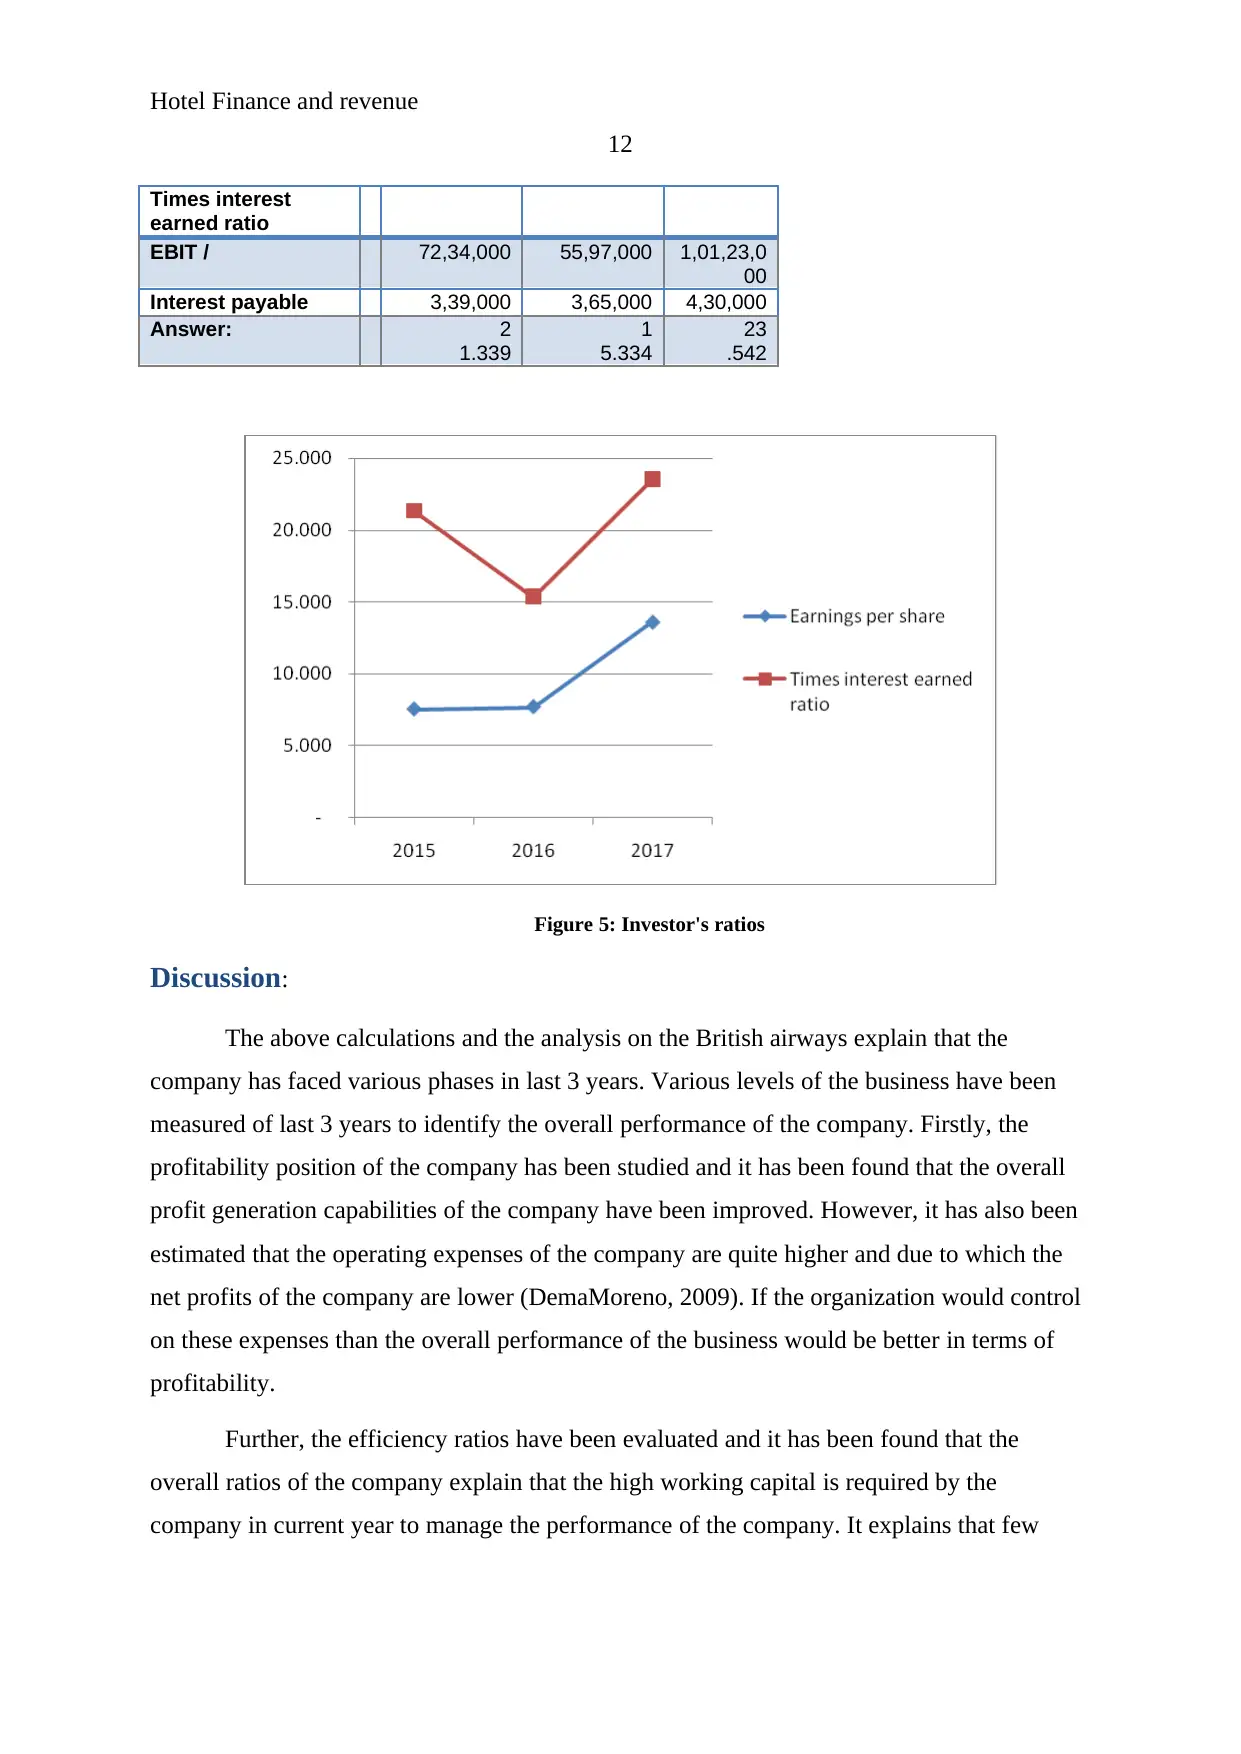
Times interest earned ratio:
Further, the times interest earned ratio of the company has been measured which
explains about total interest amount in context with the EBIT of the company. The times
interest earned ratio explains about improved performance of the company.
11
Figure 4: Debt to equity ratio
Investor’s ratios:
Lastly, the investors’ ratios have been evaluated in order to identify the market
position and the performance of the British airways. These ratios measure the investment
level of the company in the market (Koropp et al, 2014). The investor’s ratio of the company
is as follows:
Earnings per share:
Earnings per share (EPS) ratio explain the total earnings of the shareholder on the
basis of the total earnings and the total stakeholders of the business. the EPS explains that the
overall earnings of the company has been improved and explains about better performance of
the company.
Earnings per share
Net income 51,76,000 48,95,000 81,97,000
Weighted average shares
outstanding
6,86,900 6,35,500 6,02,500
Answer:
7.535 7.703 13.605
(Yahoo Finance, 2018)
Times interest earned ratio:
Further, the times interest earned ratio of the company has been measured which
explains about total interest amount in context with the EBIT of the company. The times
interest earned ratio explains about improved performance of the company.
Hotel Finance and revenue
12
Times interest
earned ratio
EBIT / 72,34,000 55,97,000 1,01,23,0
00
Interest payable 3,39,000 3,65,000 4,30,000
Answer: 2
1.339
1
5.334
23
.542
Figure 5: Investor's ratios
Discussion:
The above calculations and the analysis on the British airways explain that the
company has faced various phases in last 3 years. Various levels of the business have been
measured of last 3 years to identify the overall performance of the company. Firstly, the
profitability position of the company has been studied and it has been found that the overall
profit generation capabilities of the company have been improved. However, it has also been
estimated that the operating expenses of the company are quite higher and due to which the
net profits of the company are lower (DemaMoreno, 2009). If the organization would control
on these expenses than the overall performance of the business would be better in terms of
profitability.
Further, the efficiency ratios have been evaluated and it has been found that the
overall ratios of the company explain that the high working capital is required by the
company in current year to manage the performance of the company. It explains that few
Hotel Finance and revenue
13
changes into the inventory level would improve the performance of the company and the
requirement would also be lower.
Additionally, the liquidity ratios have been measured and it has been found that the
current and quick liquidity level of the company has been lower form 2015 in 2017. It
explains about lower cost of the company (Branes, 1987). However, it has been found that the
business is required to improve the asset level to reduce the cost level.
Capital structure ratios further explains that the debt level of the company is required
to be modified by the business on the basis of the risk and return of the business. the current
capital structure is not optimal and thus few changes would help the business to improve the
overall performance of the company.
Lastly, the investor ratios explain about overall investment position and the market
level of the company (Investors, 2018). On the basis of calculations, market position of the
company is quite better and thus if the investors would invest into the company than the
return would be higher. It further explains about better position of the company in the stock
market and non financial market.
Conclusion and recommendation:
To conclude, the financial performance of the company is average and thus few
changes are required to be done by the business to improve the overall position of the
company. The calculations and the findings on the British airways explain that the few
changes into the financial policies and strategies would make the better changes into the
overall financial level. The business is required to change the current assets, debt and equity
level, inventory level etc to improve the overall position of the business. These changes
would also reduce the financial risk of the company.
The analysis and the evaluation explain that the current financial performance and
position of the company is better than the previous year performance of the company.
Various positive changes and the better return level have taken place into the British airways’
performance in last 3 years. Due to which, the overall performance of the company have
become more attractive. Through the study, it is recommended to the investors to invest into
the firm for long term as it would offer higher return to the company.
Paraphrase This Document
Need a fresh take? Get an instant paraphrase of this document with our AI Paraphraser
Hotel Finance and revenue
14
References:
Barnes, P. (1987), The Analysis and Use of Financial Ratios: A Review Article, Journal of
Business Finance & Accounting, 14 (4), p. 449-461
Brigham, E. F., & Houston, J. F. (2012). Fundamentals of financial management. Cengage
Learning.
Chandra, P. (2011). Financial management. Tata McGraw-Hill Education.
DemaMoreno, S. (2009). Behind the negotiations: Financial decision-making processes in
Spanish dual-income couples. Feminist Economics, 15(1), 27-56.
Fridson, M. S., & Alvarez, F. (2011). Financial statement analysis: a practitioner's
guide (Vol. 597). John Wiley & Sons.
Gapenski, L. C., & Reiter, K. L. (2008). Healthcare finance: an introduction to accounting
and financial management. Chicago, IL: Health Administration Press.
Higgins, R. C. (2012). Analysis for financial management. McGraw-Hill/Irwin.
Home. (2018). British Airways limited. (online). Retrieved 30-07-2018, from
https://www.britishairways.com/travel/home/public/en_us
Investors. (2018). Boeing co. (online). Retrieved 30-07-2018, from
http://investors.boeing.com/investors/financial-reports/default.aspx.
Koropp, C., Kellermanns, F. W., Grichnik, D., & Stanley, L. (2014). Financial decision
making in family firms: An adaptation of the theory of planned behavior. Family
Business Review, 27(4), 307-327.
Madura, J. (2011). International financial management. Cengage Learning.
Mandell, L., & Hanson, K. O. (2009, January). The impact of financial education in high
school and college on financial literacy and subsequent financial decision making.
In American Economic Association Meetings (Vol. 4, p. 2009).
Morningstar. (2018). Boeing co. (online). Retrieved 30-07-2018, from
http://financials.morningstar.com/ratios/r.html?t=BA
Porcelli, A. J., & Delgado, M. R. (2009). Acute stress modulates risk taking in financial
decision making. Psychological Science, 20(3), 278-283.
Hotel Finance and revenue
15
Rabin, M. (2013). Risk aversion and expected-utility theory: A calibration theorem.
In Handbook of the Fundamentals of Financial Decision Making: Part I (pp. 241-252).
Rose, P. S., & Hudgins, S. C. (2012). Bank management & financial services. McGraw-Hill
Education.
Yahoo finance. (2018). Boeing co. (online). Retrieved 30-07-2018, from
https://finance.yahoo.com/quote/BA/
.
Hotel Finance and revenue
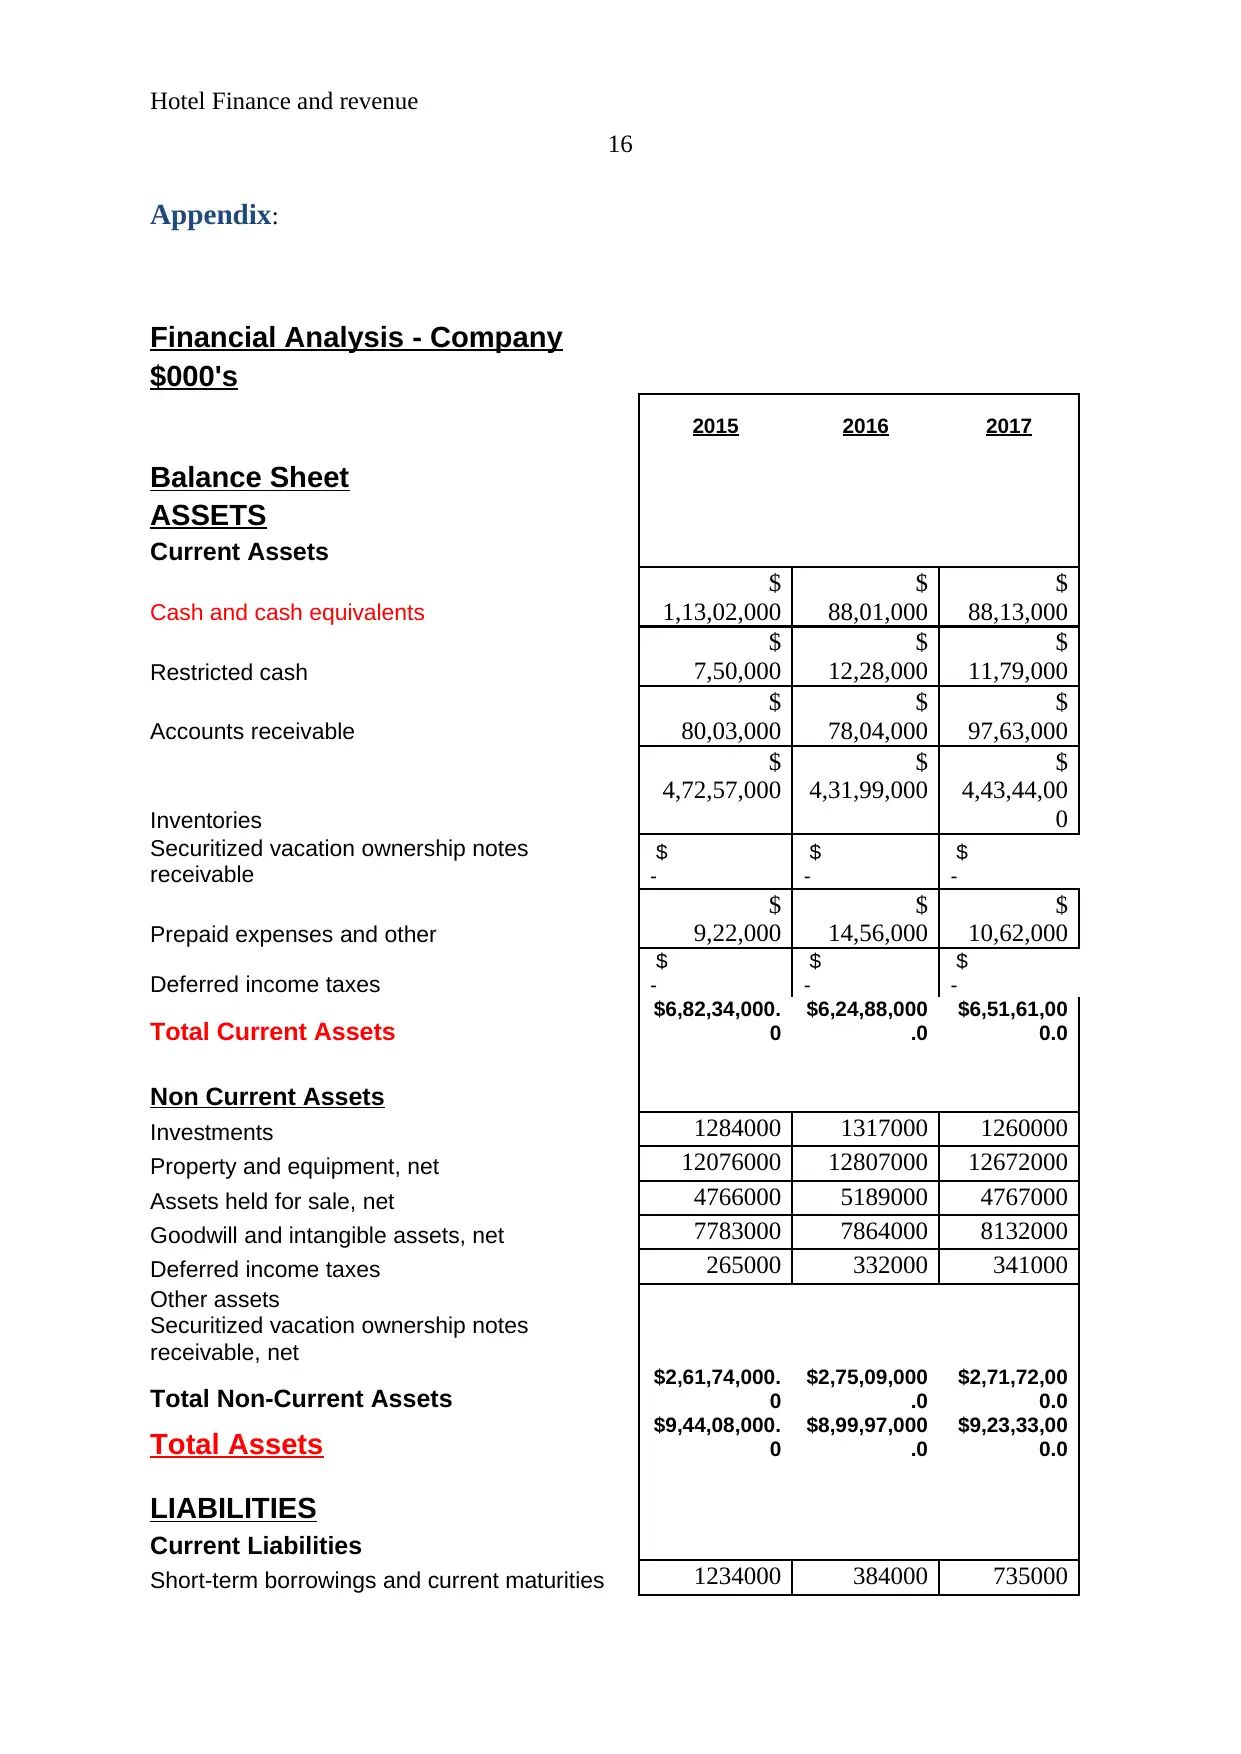
16
Appendix:
Financial Analysis - Company
$000's
2015 2016 2017
Balance Sheet
ASSETS
Current Assets
Cash and cash equivalents
$
1,13,02,000
$
88,01,000
$
88,13,000
Restricted cash
$
7,50,000
$
12,28,000
$
11,79,000
Accounts receivable
$
80,03,000
$
78,04,000
$
97,63,000
Inventories
$
4,72,57,000
$
4,31,99,000
$
4,43,44,00
0
Securitized vacation ownership notes
receivable
$
-
$
-
$
-
Prepaid expenses and other
$
9,22,000
$
14,56,000
$
10,62,000
Deferred income taxes
$
-
$
-
$
-
Total Current Assets $6,82,34,000.
0
$6,24,88,000
.0
$6,51,61,00
0.0
Non Current Assets
Investments 1284000 1317000 1260000
Property and equipment, net 12076000 12807000 12672000
Assets held for sale, net 4766000 5189000 4767000
Goodwill and intangible assets, net 7783000 7864000 8132000
Deferred income taxes 265000 332000 341000
Other assets
Securitized vacation ownership notes
receivable, net
Total Non-Current Assets $2,61,74,000.
0
$2,75,09,000
.0
$2,71,72,00
0.0
Total Assets $9,44,08,000.
0
$8,99,97,000
.0
$9,23,33,00
0.0
LIABILITIES
Current Liabilities
Short-term borrowings and current maturities 1234000 384000 735000
Secure Best Marks with AI Grader
Need help grading? Try our AI Grader for instant feedback on your assignments.
Hotel Finance and revenue
17
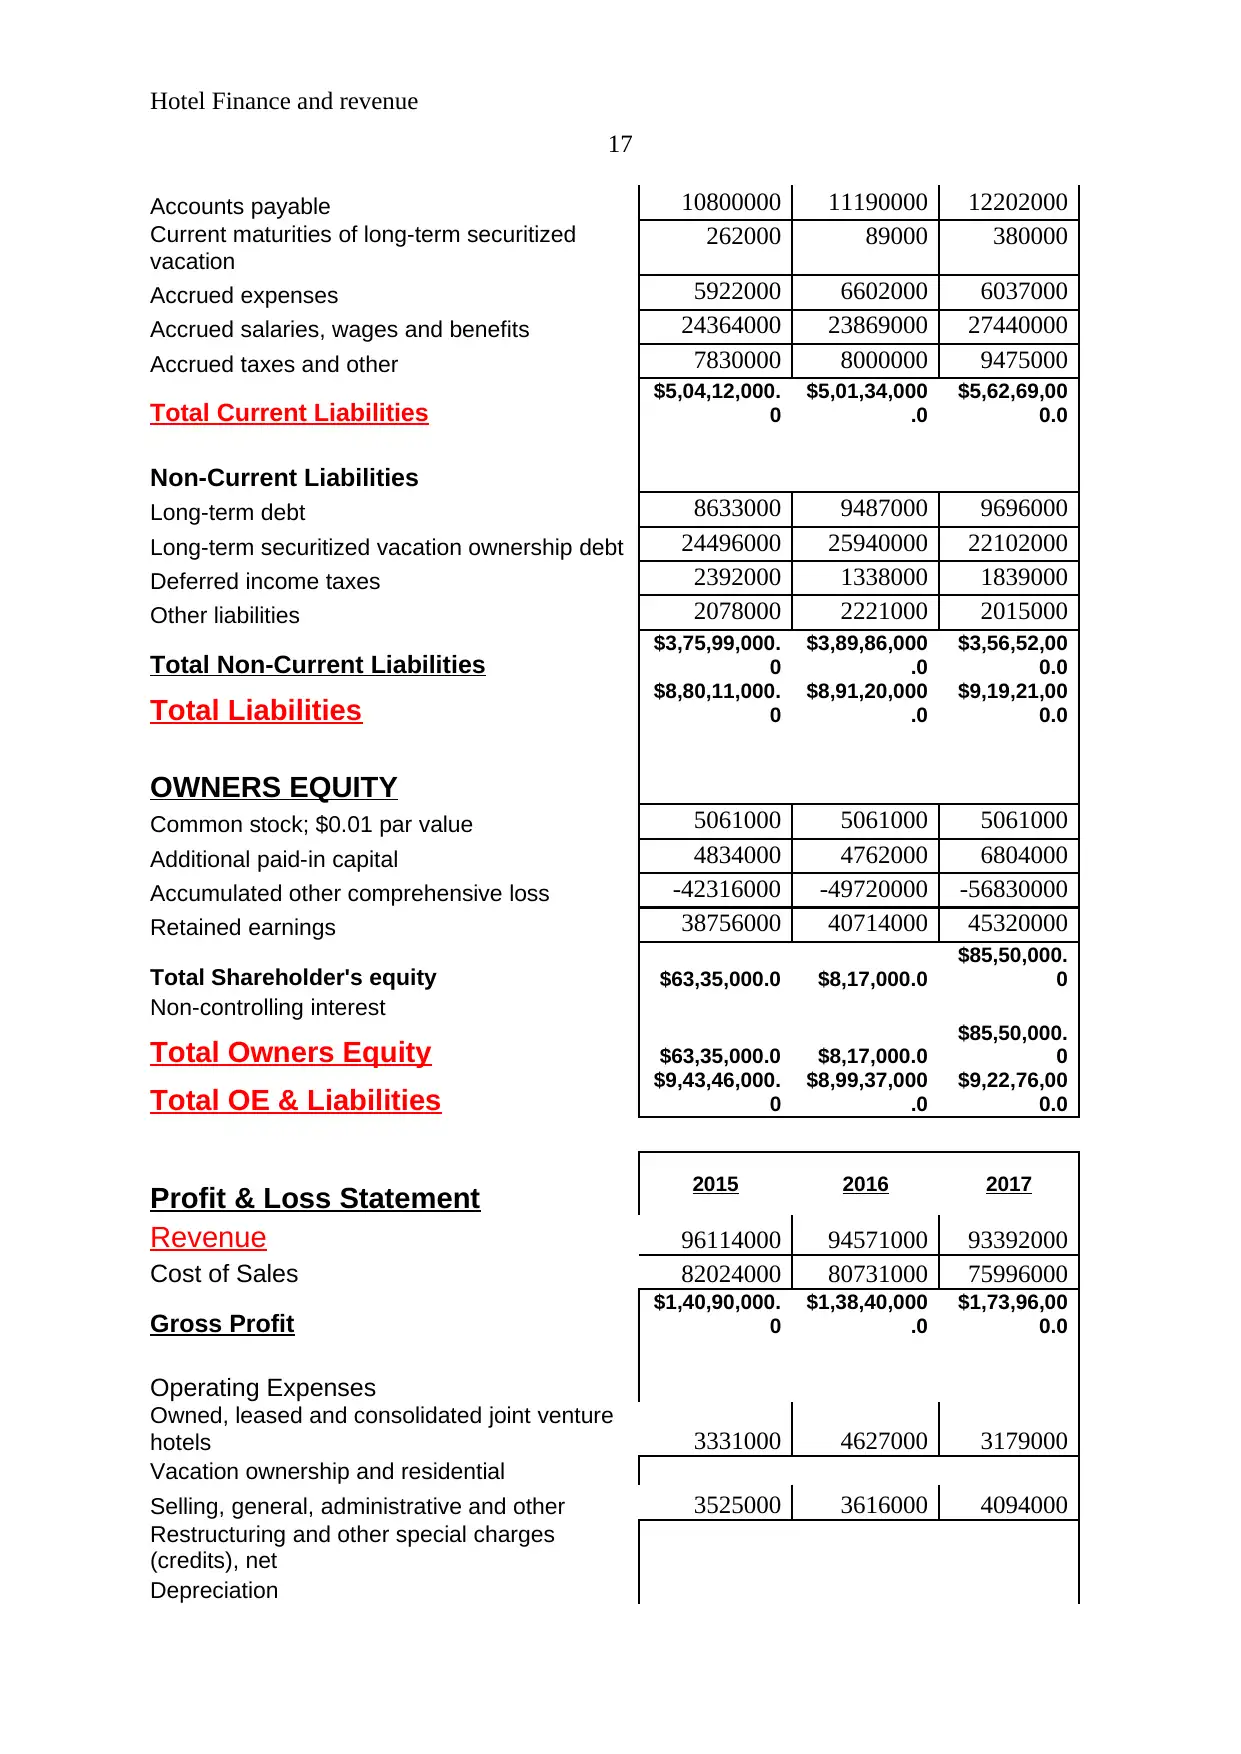
Accounts payable 10800000 11190000 12202000
Current maturities of long-term securitized
vacation
262000 89000 380000
Accrued expenses 5922000 6602000 6037000
Accrued salaries, wages and benefits 24364000 23869000 27440000
Accrued taxes and other 7830000 8000000 9475000
Total Current Liabilities $5,04,12,000.
0
$5,01,34,000
.0
$5,62,69,00
0.0
Non-Current Liabilities
Long-term debt 8633000 9487000 9696000
Long-term securitized vacation ownership debt 24496000 25940000 22102000
Deferred income taxes 2392000 1338000 1839000
Other liabilities 2078000 2221000 2015000
Total Non-Current Liabilities $3,75,99,000.
0
$3,89,86,000
.0
$3,56,52,00
0.0
Total Liabilities $8,80,11,000.
0
$8,91,20,000
.0
$9,19,21,00
0.0
OWNERS EQUITY
Common stock; $0.01 par value 5061000 5061000 5061000
Additional paid-in capital 4834000 4762000 6804000
Accumulated other comprehensive loss -42316000 -49720000 -56830000
Retained earnings 38756000 40714000 45320000
Total Shareholder's equity $63,35,000.0 $8,17,000.0
$85,50,000.
0
Non-controlling interest
Total Owners Equity $63,35,000.0 $8,17,000.0
$85,50,000.
0
Total OE & Liabilities $9,43,46,000.
0
$8,99,37,000
.0
$9,22,76,00
0.0
2015 2016 2017
Profit & Loss Statement
Revenue 96114000 94571000 93392000
Cost of Sales 82024000 80731000 75996000
Gross Profit $1,40,90,000.
0
$1,38,40,000
.0
$1,73,96,00
0.0
Operating Expenses
Owned, leased and consolidated joint venture
hotels 3331000 4627000 3179000
Vacation ownership and residential
Selling, general, administrative and other 3525000 3616000 4094000
Restructuring and other special charges
(credits), net
Depreciation
17
Accounts payable 10800000 11190000 12202000
Current maturities of long-term securitized
vacation
262000 89000 380000
Accrued expenses 5922000 6602000 6037000
Accrued salaries, wages and benefits 24364000 23869000 27440000
Accrued taxes and other 7830000 8000000 9475000
Total Current Liabilities $5,04,12,000.
0
$5,01,34,000
.0
$5,62,69,00
0.0
Non-Current Liabilities
Long-term debt 8633000 9487000 9696000
Long-term securitized vacation ownership debt 24496000 25940000 22102000
Deferred income taxes 2392000 1338000 1839000
Other liabilities 2078000 2221000 2015000
Total Non-Current Liabilities $3,75,99,000.
0
$3,89,86,000
.0
$3,56,52,00
0.0
Total Liabilities $8,80,11,000.
0
$8,91,20,000
.0
$9,19,21,00
0.0
OWNERS EQUITY
Common stock; $0.01 par value 5061000 5061000 5061000
Additional paid-in capital 4834000 4762000 6804000
Accumulated other comprehensive loss -42316000 -49720000 -56830000
Retained earnings 38756000 40714000 45320000
Total Shareholder's equity $63,35,000.0 $8,17,000.0
$85,50,000.
0
Non-controlling interest
Total Owners Equity $63,35,000.0 $8,17,000.0
$85,50,000.
0
Total OE & Liabilities $9,43,46,000.
0
$8,99,37,000
.0
$9,22,76,00
0.0
2015 2016 2017
Profit & Loss Statement
Revenue 96114000 94571000 93392000
Cost of Sales 82024000 80731000 75996000
Gross Profit $1,40,90,000.
0
$1,38,40,000
.0
$1,73,96,00
0.0
Operating Expenses
Owned, leased and consolidated joint venture
hotels 3331000 4627000 3179000
Vacation ownership and residential
Selling, general, administrative and other 3525000 3616000 4094000
Restructuring and other special charges
(credits), net
Depreciation
Hotel Finance and revenue
18
Amortization
Other expenses from managed and franchised
properties
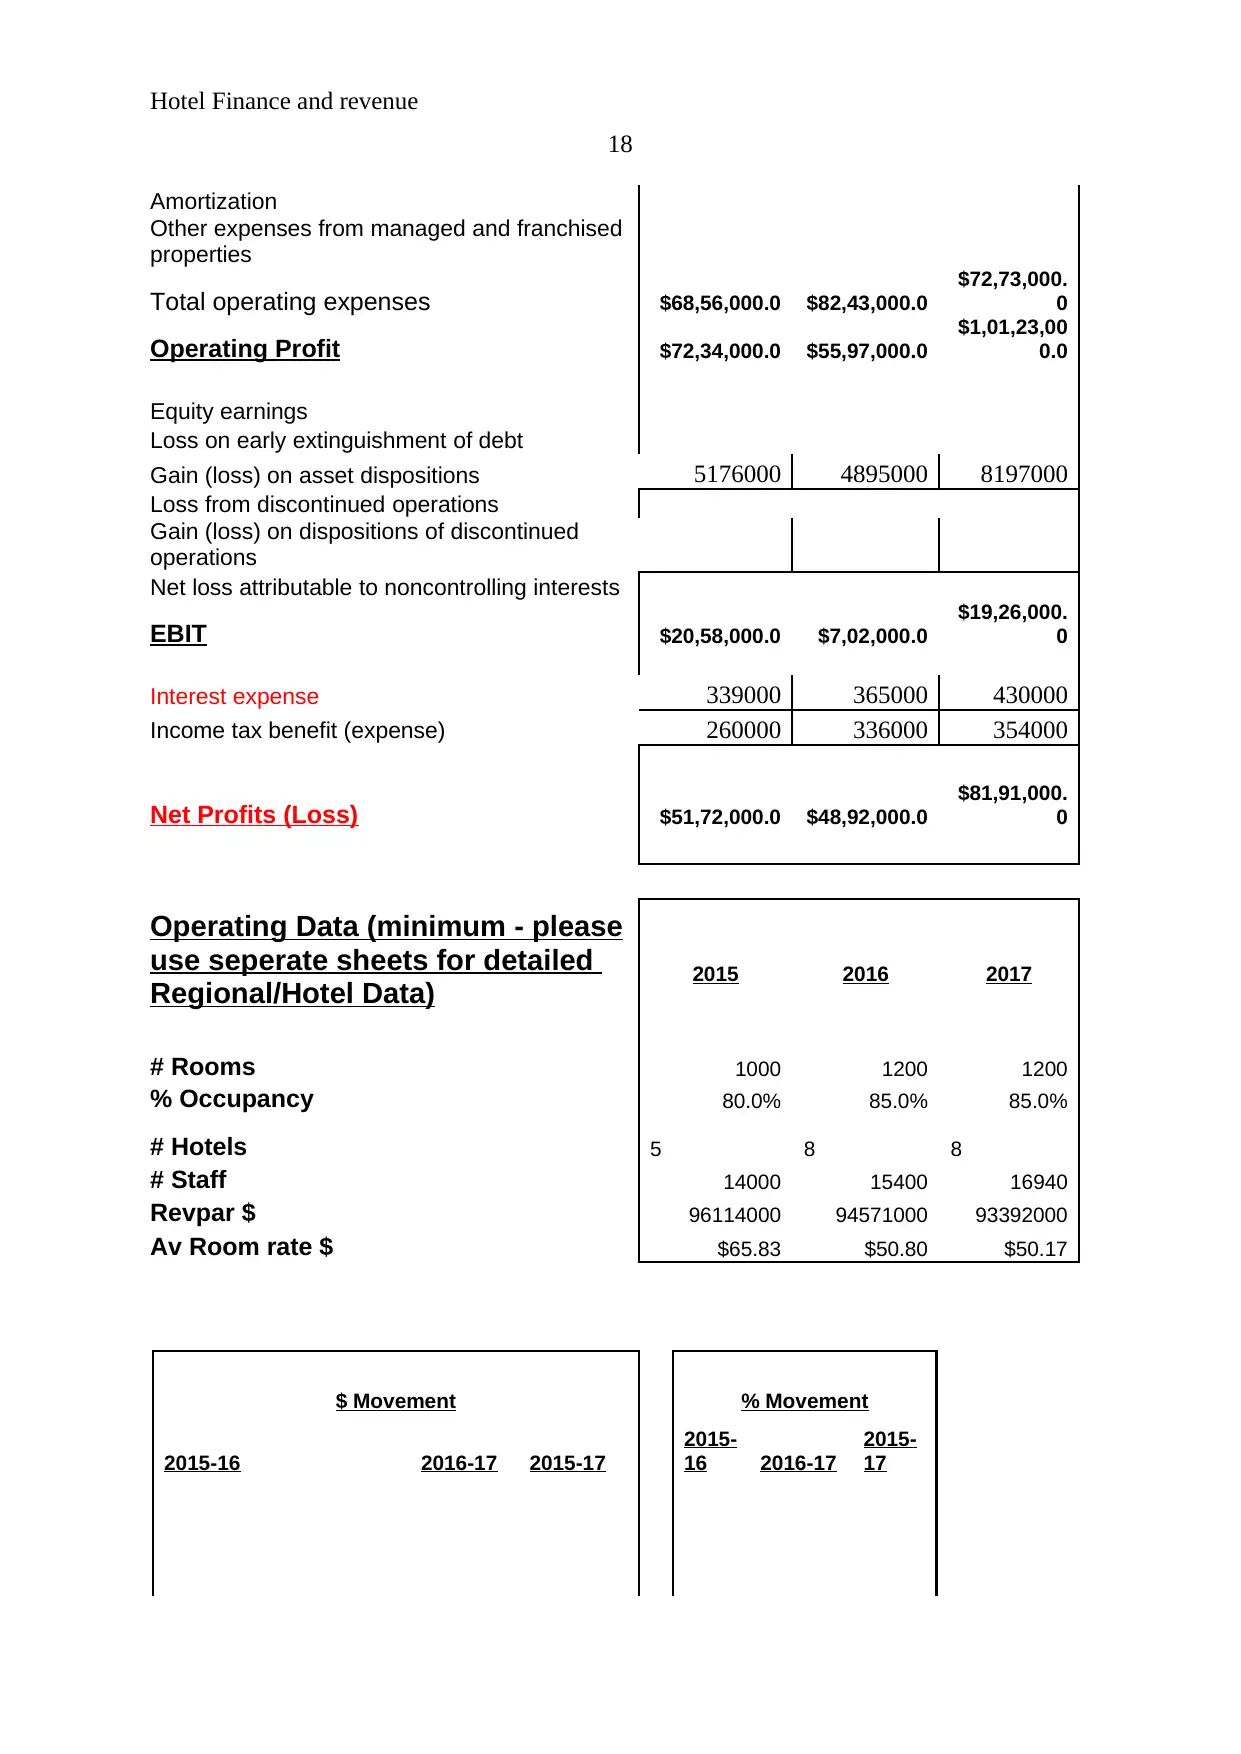
Total operating expenses $68,56,000.0 $82,43,000.0
$72,73,000.
0
Operating Profit $72,34,000.0 $55,97,000.0
$1,01,23,00
0.0
Equity earnings
Loss on early extinguishment of debt
Gain (loss) on asset dispositions 5176000 4895000 8197000
Loss from discontinued operations
Gain (loss) on dispositions of discontinued
operations
Net loss attributable to noncontrolling interests
EBIT $20,58,000.0 $7,02,000.0
$19,26,000.
0
Interest expense 339000 365000 430000
Income tax benefit (expense) 260000 336000 354000
Net Profits (Loss) $51,72,000.0 $48,92,000.0
$81,91,000.
0
Operating Data (minimum - please
use seperate sheets for detailed
Regional/Hotel Data) 2015 2016 2017
# Rooms 1000 1200 1200
% Occupancy 80.0% 85.0% 85.0%
# Hotels 5 8 8
# Staff 14000 15400 16940
Revpar $ 96114000 94571000 93392000
Av Room rate $ $65.83 $50.80 $50.17
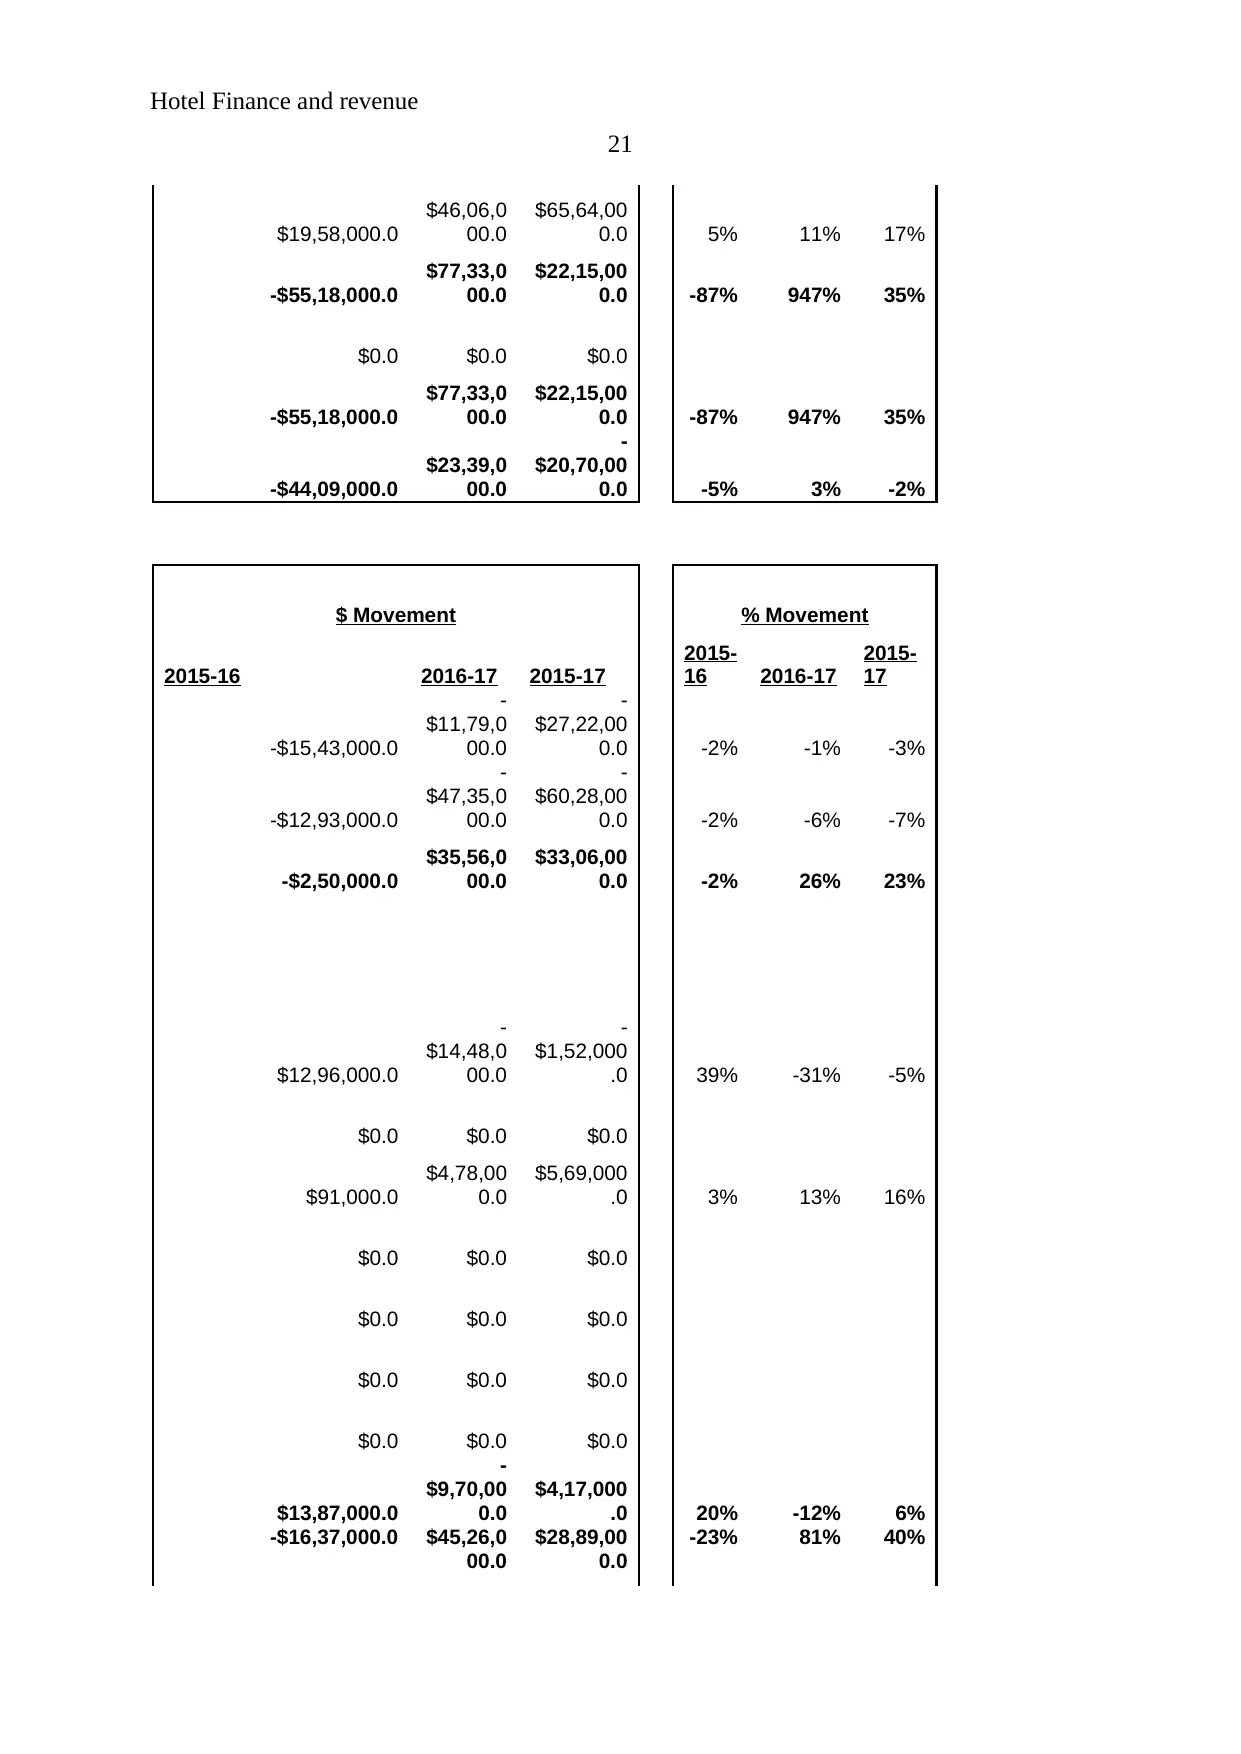
$ Movement % Movement
2015-16 2016-17 2015-17
2015-
16 2016-17
2015-
17
18
Amortization
Other expenses from managed and franchised
properties
Total operating expenses $68,56,000.0 $82,43,000.0
$72,73,000.
0
Operating Profit $72,34,000.0 $55,97,000.0
$1,01,23,00
0.0
Equity earnings
Loss on early extinguishment of debt
Gain (loss) on asset dispositions 5176000 4895000 8197000
Loss from discontinued operations
Gain (loss) on dispositions of discontinued
operations
Net loss attributable to noncontrolling interests
EBIT $20,58,000.0 $7,02,000.0
$19,26,000.
0
Interest expense 339000 365000 430000
Income tax benefit (expense) 260000 336000 354000
Net Profits (Loss) $51,72,000.0 $48,92,000.0
$81,91,000.
0
Operating Data (minimum - please
use seperate sheets for detailed
Regional/Hotel Data) 2015 2016 2017
# Rooms 1000 1200 1200
% Occupancy 80.0% 85.0% 85.0%
# Hotels 5 8 8
# Staff 14000 15400 16940
Revpar $ 96114000 94571000 93392000
Av Room rate $ $65.83 $50.80 $50.17
$ Movement % Movement
2015-16 2016-17 2015-17
2015-
16 2016-17
2015-
17
Hotel Finance and revenue
19
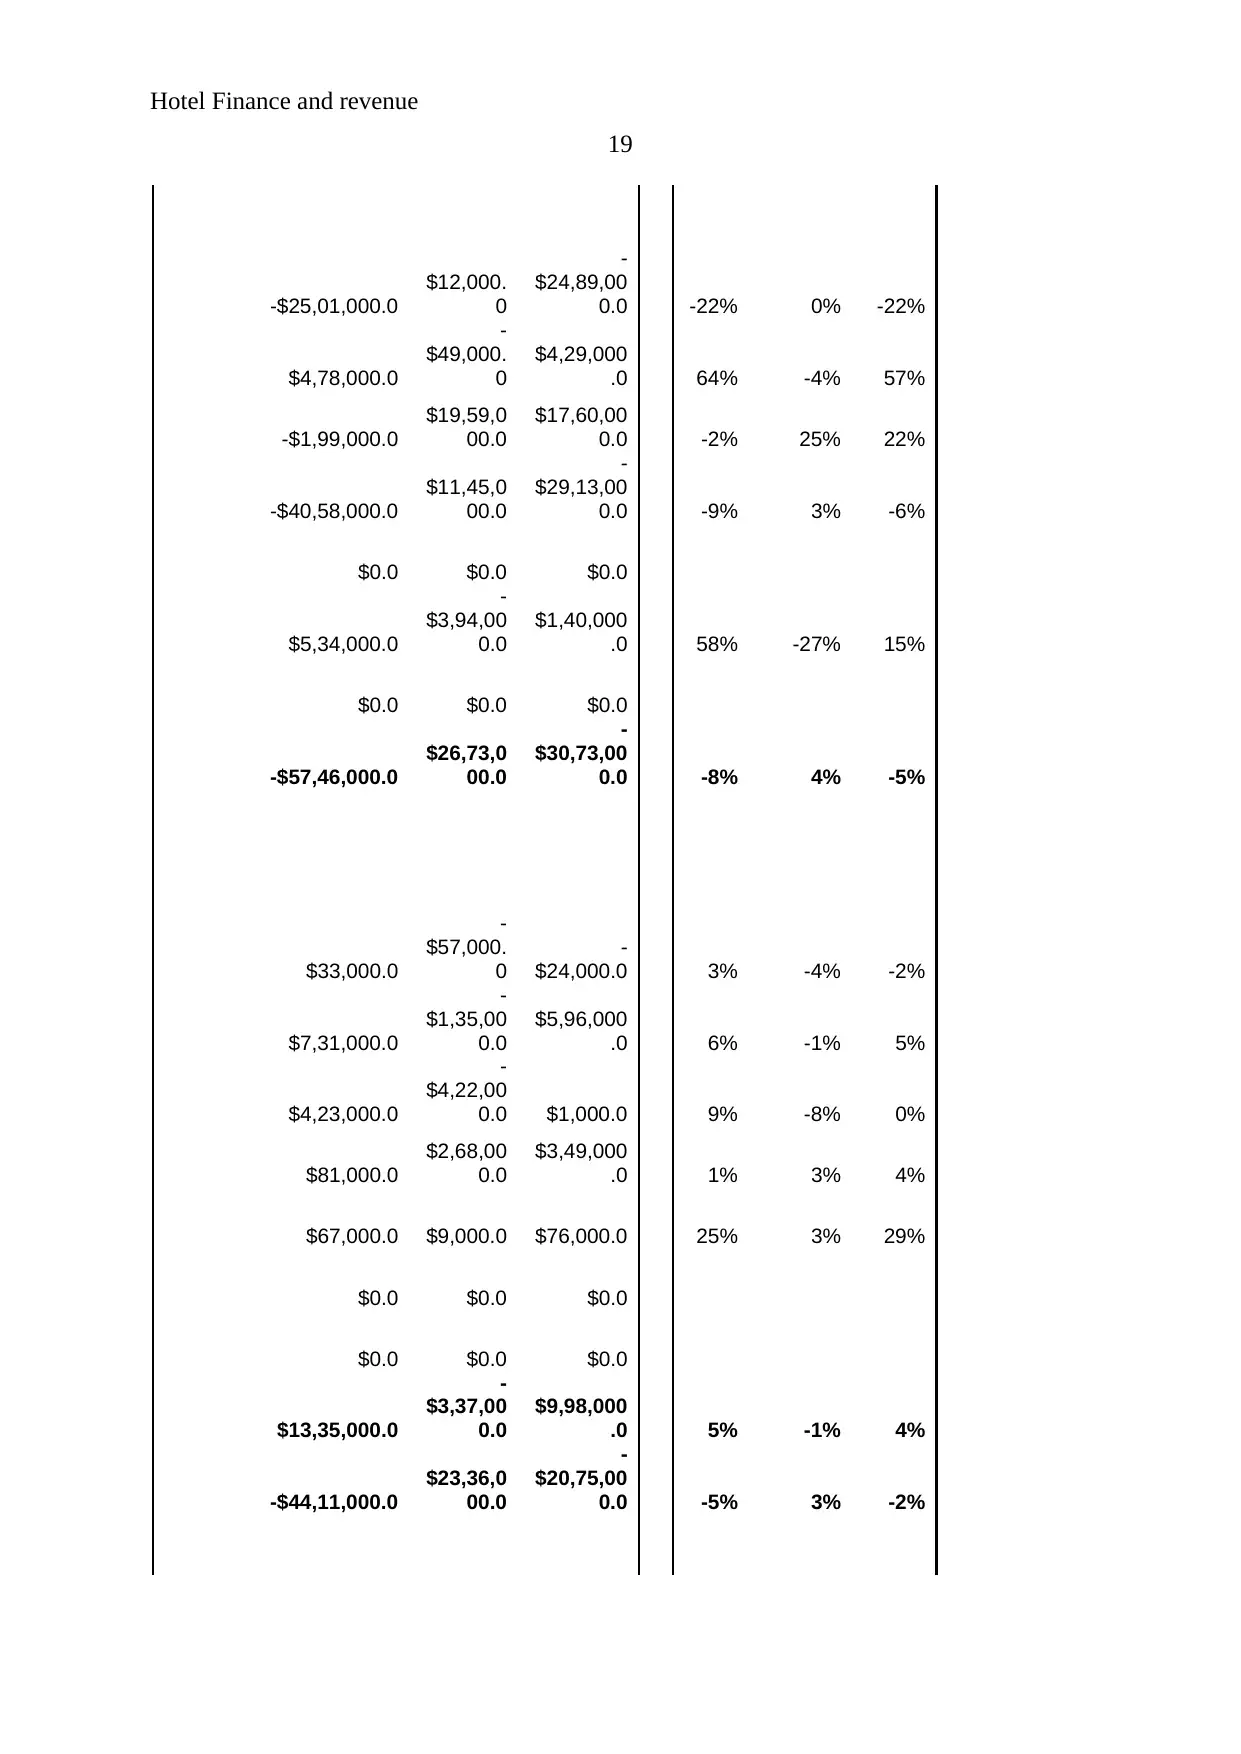
-$25,01,000.0
$12,000.
0
-
$24,89,00
0.0 -22% 0% -22%
$4,78,000.0
-
$49,000.
0
$4,29,000
.0 64% -4% 57%
-$1,99,000.0
$19,59,0
00.0
$17,60,00
0.0 -2% 25% 22%
-$40,58,000.0
$11,45,0
00.0
-
$29,13,00
0.0 -9% 3% -6%
$0.0 $0.0 $0.0
$5,34,000.0
-
$3,94,00
0.0
$1,40,000
.0 58% -27% 15%
$0.0 $0.0 $0.0
-$57,46,000.0
$26,73,0
00.0
-
$30,73,00
0.0 -8% 4% -5%
$33,000.0
-
$57,000.
0
-
$24,000.0 3% -4% -2%
$7,31,000.0
-
$1,35,00
0.0
$5,96,000
.0 6% -1% 5%
$4,23,000.0
-
$4,22,00
0.0 $1,000.0 9% -8% 0%
$81,000.0
$2,68,00
0.0
$3,49,000
.0 1% 3% 4%
$67,000.0 $9,000.0 $76,000.0 25% 3% 29%
$0.0 $0.0 $0.0
$0.0 $0.0 $0.0
$13,35,000.0
-
$3,37,00
0.0
$9,98,000
.0 5% -1% 4%
-$44,11,000.0
$23,36,0
00.0
-
$20,75,00
0.0 -5% 3% -2%
19
-$25,01,000.0
$12,000.
0
-
$24,89,00
0.0 -22% 0% -22%
$4,78,000.0
-
$49,000.
0
$4,29,000
.0 64% -4% 57%
-$1,99,000.0
$19,59,0
00.0
$17,60,00
0.0 -2% 25% 22%
-$40,58,000.0
$11,45,0
00.0
-
$29,13,00
0.0 -9% 3% -6%
$0.0 $0.0 $0.0
$5,34,000.0
-
$3,94,00
0.0
$1,40,000
.0 58% -27% 15%
$0.0 $0.0 $0.0
-$57,46,000.0
$26,73,0
00.0
-
$30,73,00
0.0 -8% 4% -5%
$33,000.0
-
$57,000.
0
-
$24,000.0 3% -4% -2%
$7,31,000.0
-
$1,35,00
0.0
$5,96,000
.0 6% -1% 5%
$4,23,000.0
-
$4,22,00
0.0 $1,000.0 9% -8% 0%
$81,000.0
$2,68,00
0.0
$3,49,000
.0 1% 3% 4%
$67,000.0 $9,000.0 $76,000.0 25% 3% 29%
$0.0 $0.0 $0.0
$0.0 $0.0 $0.0
$13,35,000.0
-
$3,37,00
0.0
$9,98,000
.0 5% -1% 4%
-$44,11,000.0
$23,36,0
00.0
-
$20,75,00
0.0 -5% 3% -2%
Paraphrase This Document
Need a fresh take? Get an instant paraphrase of this document with our AI Paraphraser
Hotel Finance and revenue
20
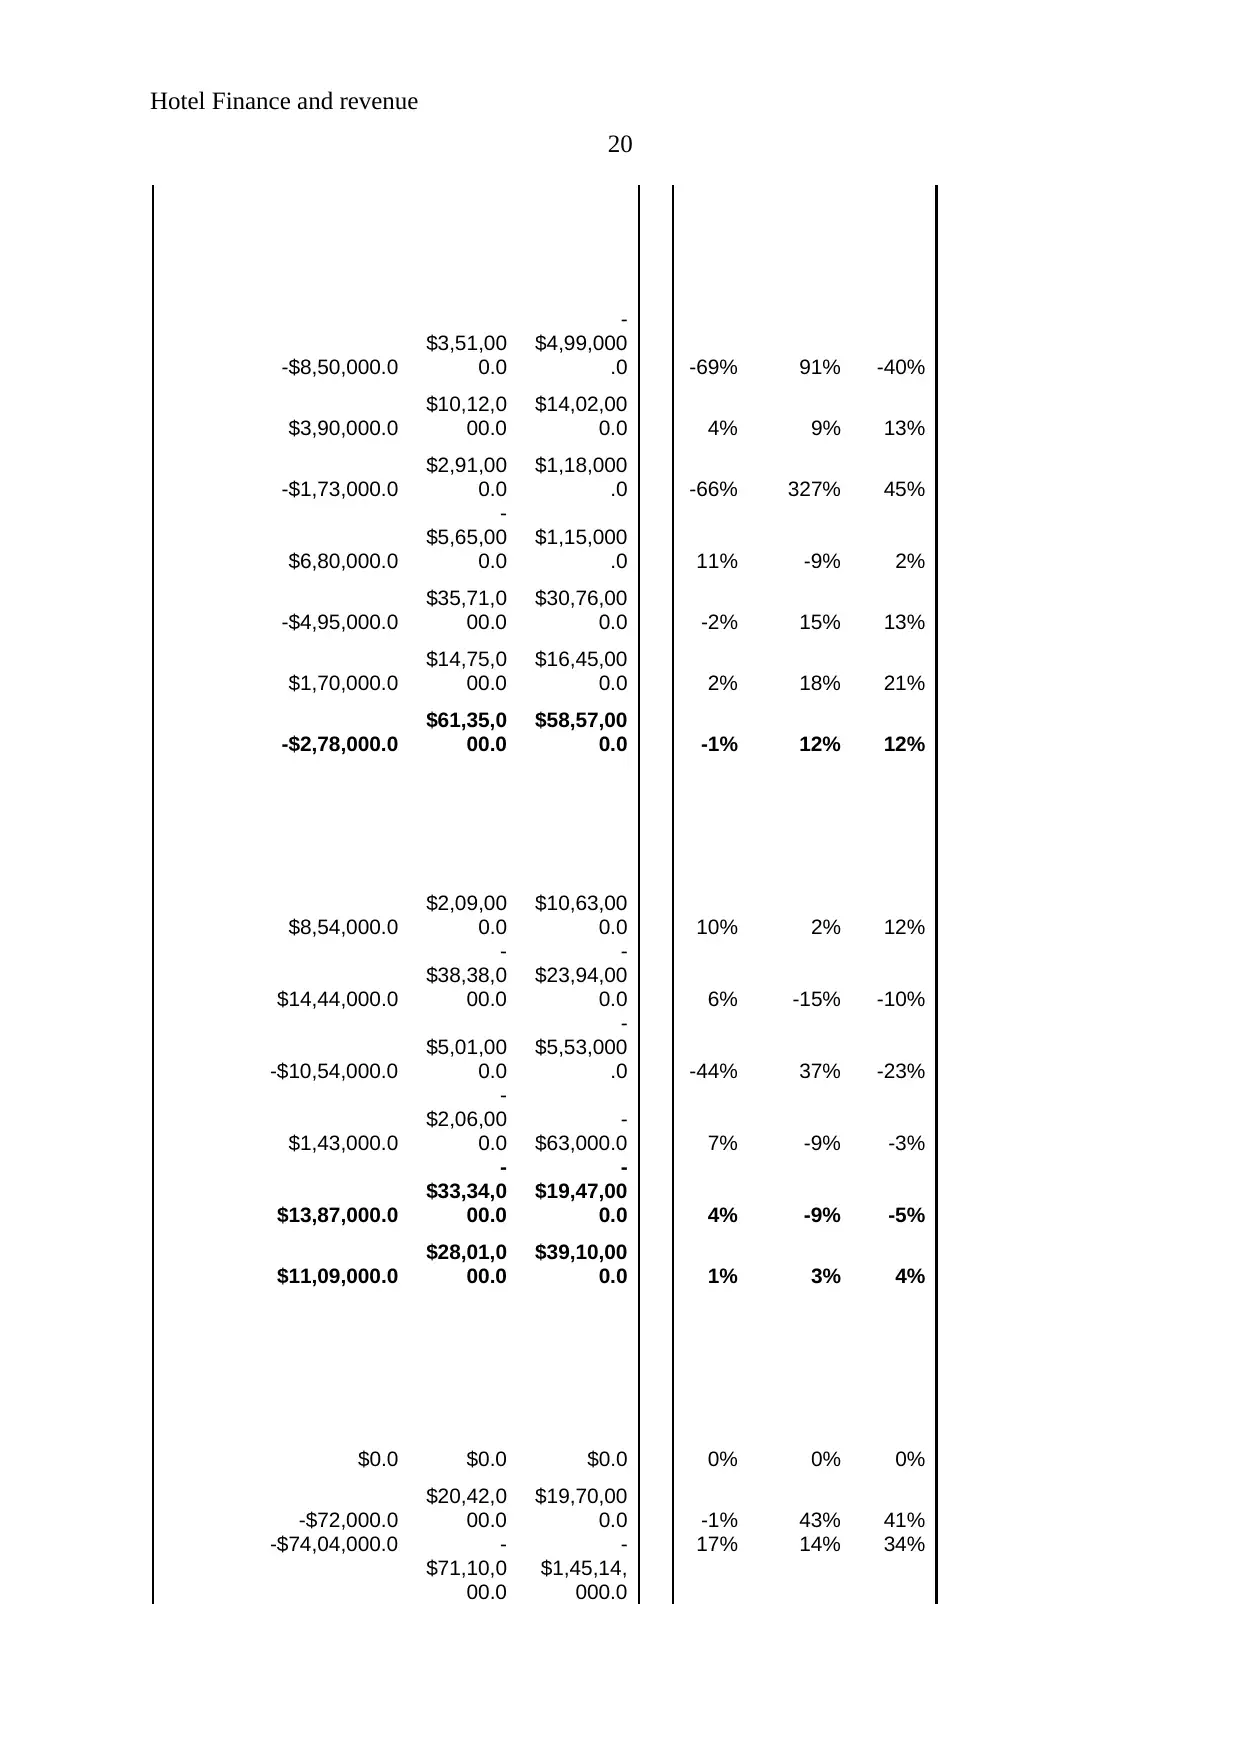
-$8,50,000.0
$3,51,00
0.0
-
$4,99,000
.0 -69% 91% -40%
$3,90,000.0
$10,12,0
00.0
$14,02,00
0.0 4% 9% 13%
-$1,73,000.0
$2,91,00
0.0
$1,18,000
.0 -66% 327% 45%
$6,80,000.0
-
$5,65,00
0.0
$1,15,000
.0 11% -9% 2%
-$4,95,000.0
$35,71,0
00.0
$30,76,00
0.0 -2% 15% 13%
$1,70,000.0
$14,75,0
00.0
$16,45,00
0.0 2% 18% 21%
-$2,78,000.0
$61,35,0
00.0
$58,57,00
0.0 -1% 12% 12%
$8,54,000.0
$2,09,00
0.0
$10,63,00
0.0 10% 2% 12%
$14,44,000.0
-
$38,38,0
00.0
-
$23,94,00
0.0 6% -15% -10%
-$10,54,000.0
$5,01,00
0.0
-
$5,53,000
.0 -44% 37% -23%
$1,43,000.0
-
$2,06,00
0.0
-
$63,000.0 7% -9% -3%
$13,87,000.0
-
$33,34,0
00.0
-
$19,47,00
0.0 4% -9% -5%
$11,09,000.0
$28,01,0
00.0
$39,10,00
0.0 1% 3% 4%
$0.0 $0.0 $0.0 0% 0% 0%
-$72,000.0
$20,42,0
00.0
$19,70,00
0.0 -1% 43% 41%
-$74,04,000.0 -
$71,10,0
00.0
-
$1,45,14,
000.0
17% 14% 34%
20
-$8,50,000.0
$3,51,00
0.0
-
$4,99,000
.0 -69% 91% -40%
$3,90,000.0
$10,12,0
00.0
$14,02,00
0.0 4% 9% 13%
-$1,73,000.0
$2,91,00
0.0
$1,18,000
.0 -66% 327% 45%
$6,80,000.0
-
$5,65,00
0.0
$1,15,000
.0 11% -9% 2%
-$4,95,000.0
$35,71,0
00.0
$30,76,00
0.0 -2% 15% 13%
$1,70,000.0
$14,75,0
00.0
$16,45,00
0.0 2% 18% 21%
-$2,78,000.0
$61,35,0
00.0
$58,57,00
0.0 -1% 12% 12%
$8,54,000.0
$2,09,00
0.0
$10,63,00
0.0 10% 2% 12%
$14,44,000.0
-
$38,38,0
00.0
-
$23,94,00
0.0 6% -15% -10%
-$10,54,000.0
$5,01,00
0.0
-
$5,53,000
.0 -44% 37% -23%
$1,43,000.0
-
$2,06,00
0.0
-
$63,000.0 7% -9% -3%
$13,87,000.0
-
$33,34,0
00.0
-
$19,47,00
0.0 4% -9% -5%
$11,09,000.0
$28,01,0
00.0
$39,10,00
0.0 1% 3% 4%
$0.0 $0.0 $0.0 0% 0% 0%
-$72,000.0
$20,42,0
00.0
$19,70,00
0.0 -1% 43% 41%
-$74,04,000.0 -
$71,10,0
00.0
-
$1,45,14,
000.0
17% 14% 34%
Hotel Finance and revenue
21
$19,58,000.0
$46,06,0
00.0
$65,64,00
0.0 5% 11% 17%
-$55,18,000.0
$77,33,0
00.0
$22,15,00
0.0 -87% 947% 35%
$0.0 $0.0 $0.0
-$55,18,000.0
$77,33,0
00.0
$22,15,00
0.0 -87% 947% 35%
-$44,09,000.0
$23,39,0
00.0
-
$20,70,00
0.0 -5% 3% -2%
$ Movement % Movement
2015-16 2016-17 2015-17
2015-
16 2016-17
2015-
17
-$15,43,000.0
-
$11,79,0
00.0
-
$27,22,00
0.0 -2% -1% -3%
-$12,93,000.0
-
$47,35,0
00.0
-
$60,28,00
0.0 -2% -6% -7%
-$2,50,000.0
$35,56,0
00.0
$33,06,00
0.0 -2% 26% 23%
$12,96,000.0
-
$14,48,0
00.0
-
$1,52,000
.0 39% -31% -5%
$0.0 $0.0 $0.0
$91,000.0
$4,78,00
0.0
$5,69,000
.0 3% 13% 16%
$0.0 $0.0 $0.0
$0.0 $0.0 $0.0
$0.0 $0.0 $0.0
$0.0 $0.0 $0.0
$13,87,000.0
-
$9,70,00
0.0
$4,17,000
.0 20% -12% 6%
-$16,37,000.0 $45,26,0
00.0
$28,89,00
0.0
-23% 81% 40%
Hotel Finance and revenue
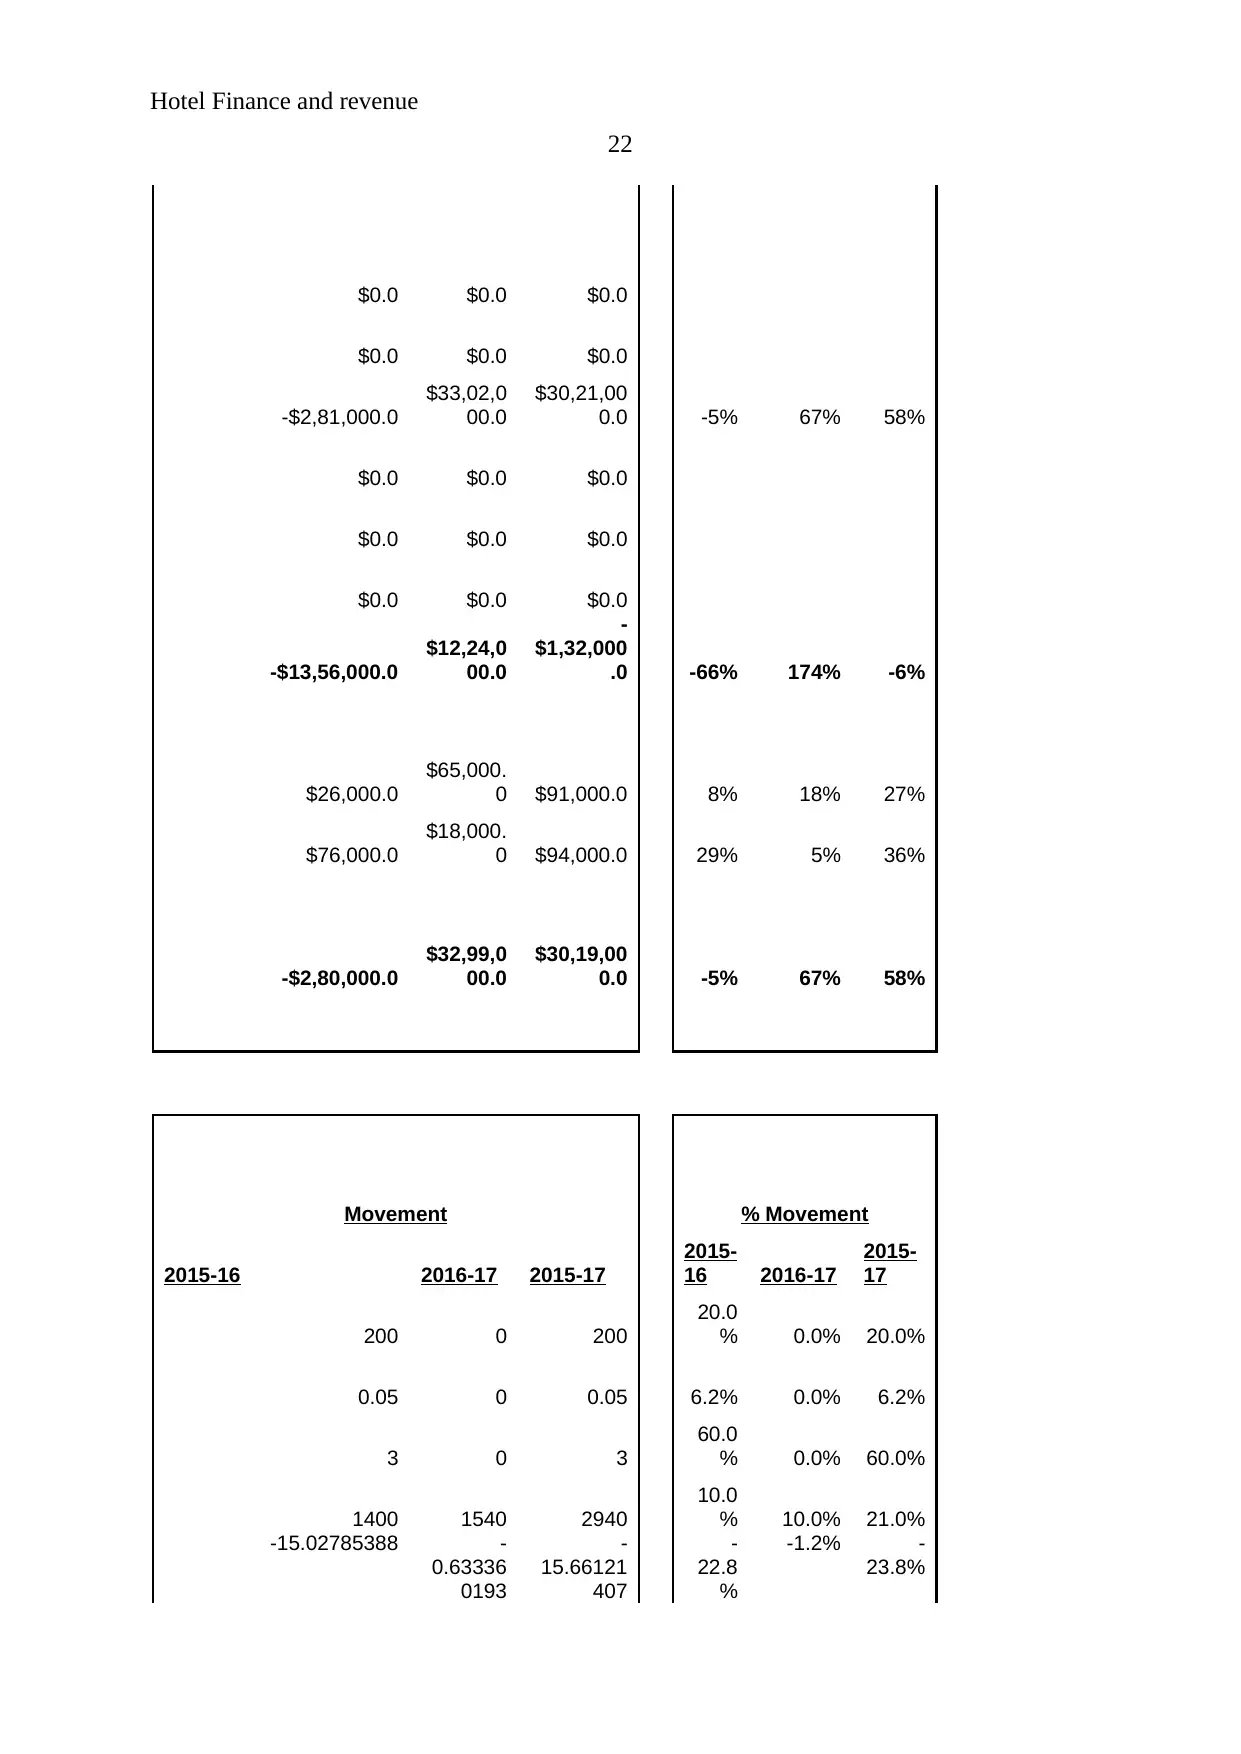
22
$0.0 $0.0 $0.0
$0.0 $0.0 $0.0
-$2,81,000.0
$33,02,0
00.0
$30,21,00
0.0 -5% 67% 58%
$0.0 $0.0 $0.0
$0.0 $0.0 $0.0
$0.0 $0.0 $0.0
-$13,56,000.0
$12,24,0
00.0
-
$1,32,000
.0 -66% 174% -6%
$26,000.0
$65,000.
0 $91,000.0 8% 18% 27%
$76,000.0
$18,000.
0 $94,000.0 29% 5% 36%
-$2,80,000.0
$32,99,0
00.0
$30,19,00
0.0 -5% 67% 58%
Movement % Movement
2015-16 2016-17 2015-17
2015-
16 2016-17
2015-
17
200 0 200
20.0
% 0.0% 20.0%
0.05 0 0.05 6.2% 0.0% 6.2%
3 0 3
60.0
% 0.0% 60.0%
1400 1540 2940
10.0
% 10.0% 21.0%
-15.02785388 -
0.63336
0193
-
15.66121
407
-
22.8
%
-1.2% -
23.8%
Secure Best Marks with AI Grader
Need help grading? Try our AI Grader for instant feedback on your assignments.

Hotel Finance and revenue
23
0 0 0
23
0 0 0
Hotel Finance and revenue
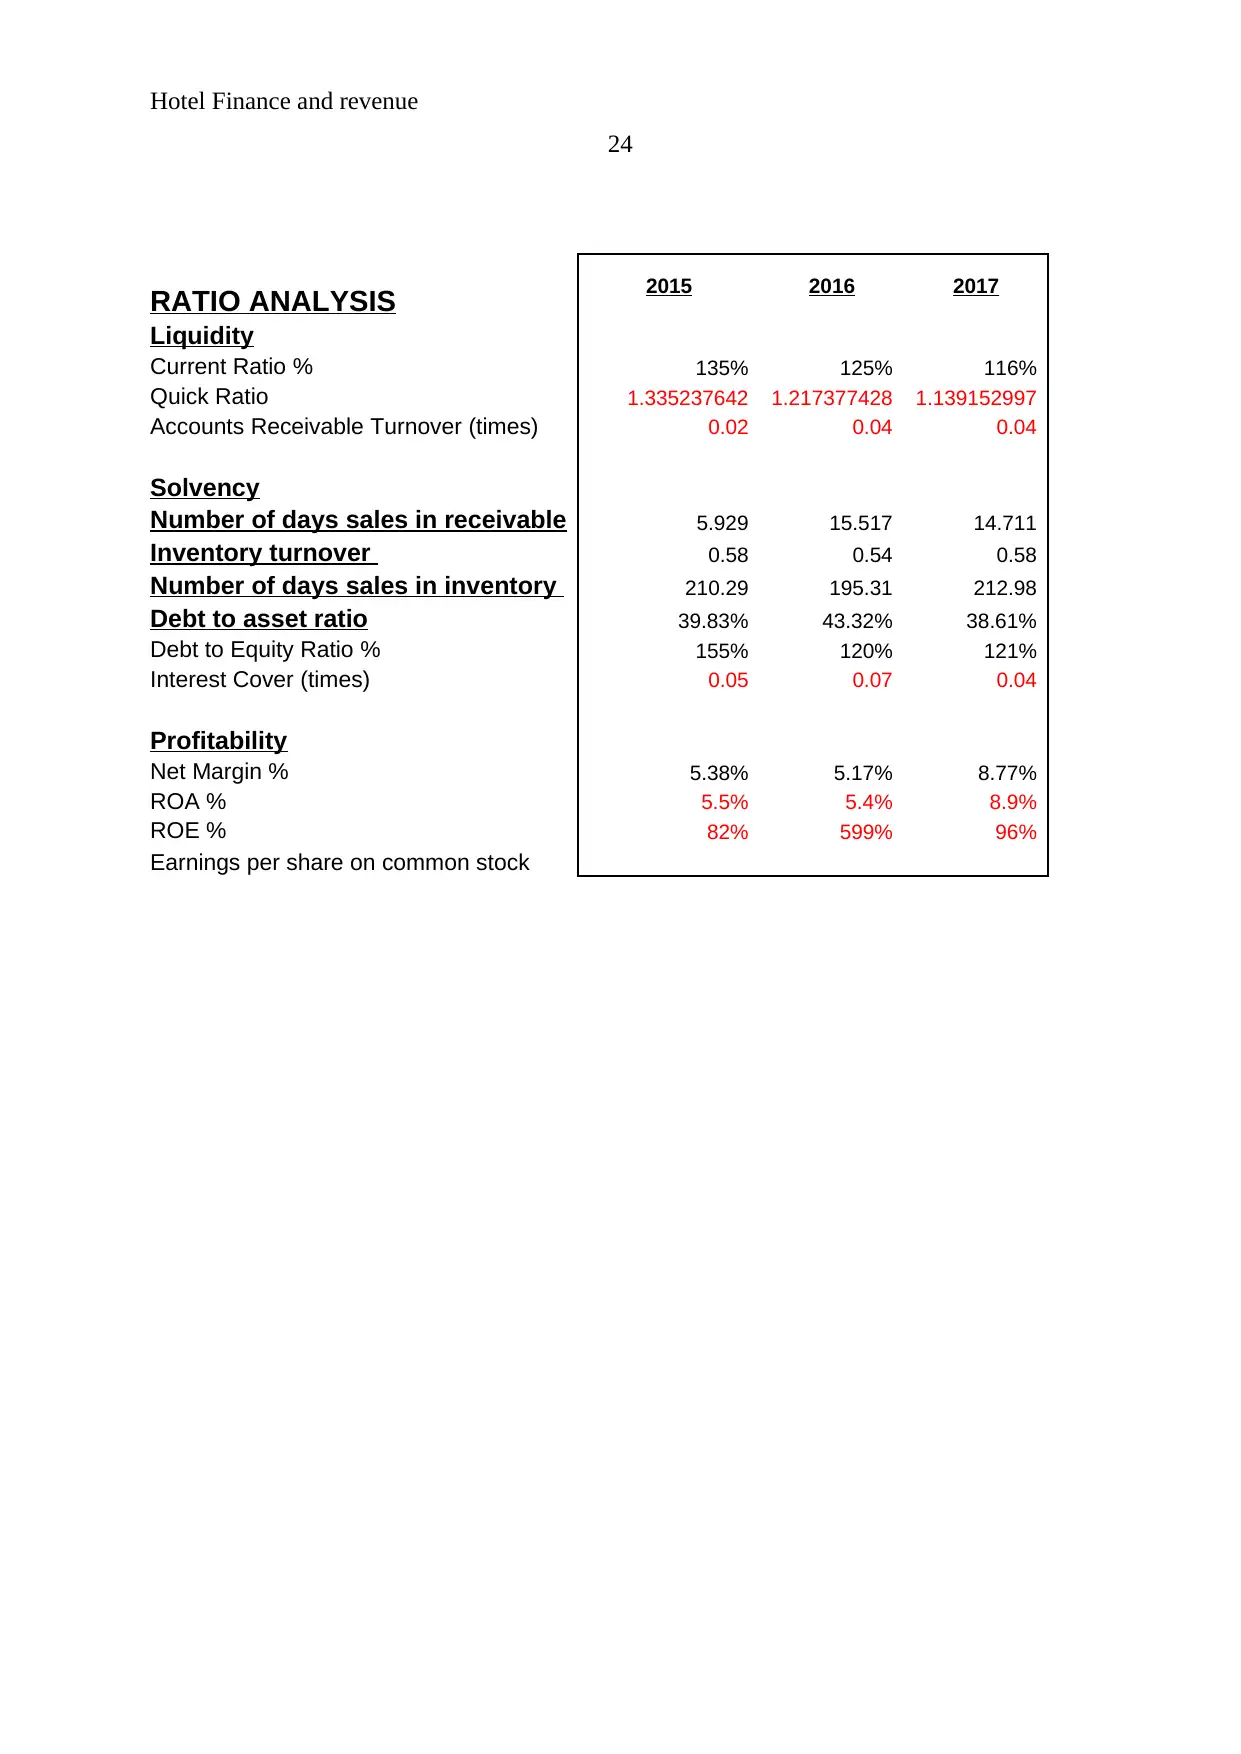
24
2015 2016 2017
RATIO ANALYSIS
Liquidity
Current Ratio % 135% 125% 116%
Quick Ratio 1.335237642 1.217377428 1.139152997
Accounts Receivable Turnover (times) 0.02 0.04 0.04
Solvency
Number of days sales in receivable 5.929 15.517 14.711
Inventory turnover 0.58 0.54 0.58
Number of days sales in inventory 210.29 195.31 212.98
Debt to asset ratio 39.83% 43.32% 38.61%
Debt to Equity Ratio % 155% 120% 121%
Interest Cover (times) 0.05 0.07 0.04
Profitability
Net Margin % 5.38% 5.17% 8.77%
ROA % 5.5% 5.4% 8.9%
ROE % 82% 599% 96%
Earnings per share on common stock
1 out of 24
Related Documents

![[FINANCIAL ANALYSIS] Ratio Analysis of AA, BA, and CA Companies](/_next/image/?url=https%3A%2F%2Fdesklib.com%2Fmedia%2Fimages%2Fme%2F7ec77c9779a64d0faedda6aed8107017.jpg&w=256&q=75)


Your All-in-One AI-Powered Toolkit for Academic Success.
+13062052269
info@desklib.com
Available 24*7 on WhatsApp / Email
![[object Object]](/_next/static/media/star-bottom.7253800d.svg)
Unlock your academic potential
© 2024 | Zucol Services PVT LTD | All rights reserved.