Hypothesis testing Assignment PDF
Added on 2020-12-29
29 Pages2607 Words112 Views
SPSS

TABLE OF CONTENTS
TASK 1............................................................................................................................................1
A Determination of outlier by ID number and presenting valid justification..............................1
b. Hypothesis testing on variables and summary analysis over the outcomes............................1
c. Hypothesis testing on the caffeine consumption and age........................................................1
D. Alternative analytical approach..............................................................................................2
TASK 2............................................................................................................................................2
A Determining the hypothesis for moderation analysis over the variables.................................2
B Analysing outcomes with the influences of Mediated effects.................................................3
C Using advance statistical technique for evaluating the outcomes from the variables..............3
TASK 3............................................................................................................................................3
A..................................................................................................................................................3
B...................................................................................................................................................4
C...................................................................................................................................................4
D Drafting a conclusion on findings............................................................................................4
E Critical determination of used models.....................................................................................4
TASK 4............................................................................................................................................4
REFERENCES................................................................................................................................5
APPENDIX......................................................................................................................................6
A..................................................................................................................................................6
B.................................................................................................................................................12
A................................................................................................................................................13
B.................................................................................................................................................15
C.................................................................................................................................................20
TASK 3..........................................................................................................................................23
C.................................................................................................................................................23
TASK 1
A Determination of outlier by ID number and presenting valid justification
As listed in Appendix on which it can be said that, there have been ascertainment of data base
which were being analysed on the basis of selecting outliers of the analysis. Thus, in respect with
linear regression analysis there have been examination over all the variables (Okada, T. and
et.al., 2018). Among which, age of respondents and the heart beat rate after and before stressful
events have been selected for the further examination thus, selection of such variables based on a
reason that there are interconnected and will bring the appropriate outcomes.
b. Hypothesis testing on variables and summary analysis over the outcomes
Null hypothesis: There is no mean significance difference between controlling age and
changes in heart rate after stressful event
Alternative Hypothesis: There is a mean significance difference between controlling age
and changes in heart rate after stressful event
Summary: On the basis of above listed analysis on which there have been ascertainment
of the relationship between age, after and before heartbeat of stressful event have been analysed.
However, in relation with the model summary of the data base which respect the R value as
0.227 while R square as 0.052 which insist that there is 5.2% of relevance in bases between the
variables. Moreover, F value of the outcomes had been determined here is 2.498 and the
significant analysis over the data base is 0.088. therefore, in respect with such outcomes it can eb
said that the significant value is comparatively higher than the P value of 0.05. Thus, in respect
with this there will be acceptance to the Null hypothesis which states that, there is no mean
significance difference between controlling age and changes in heart rate after stressful event
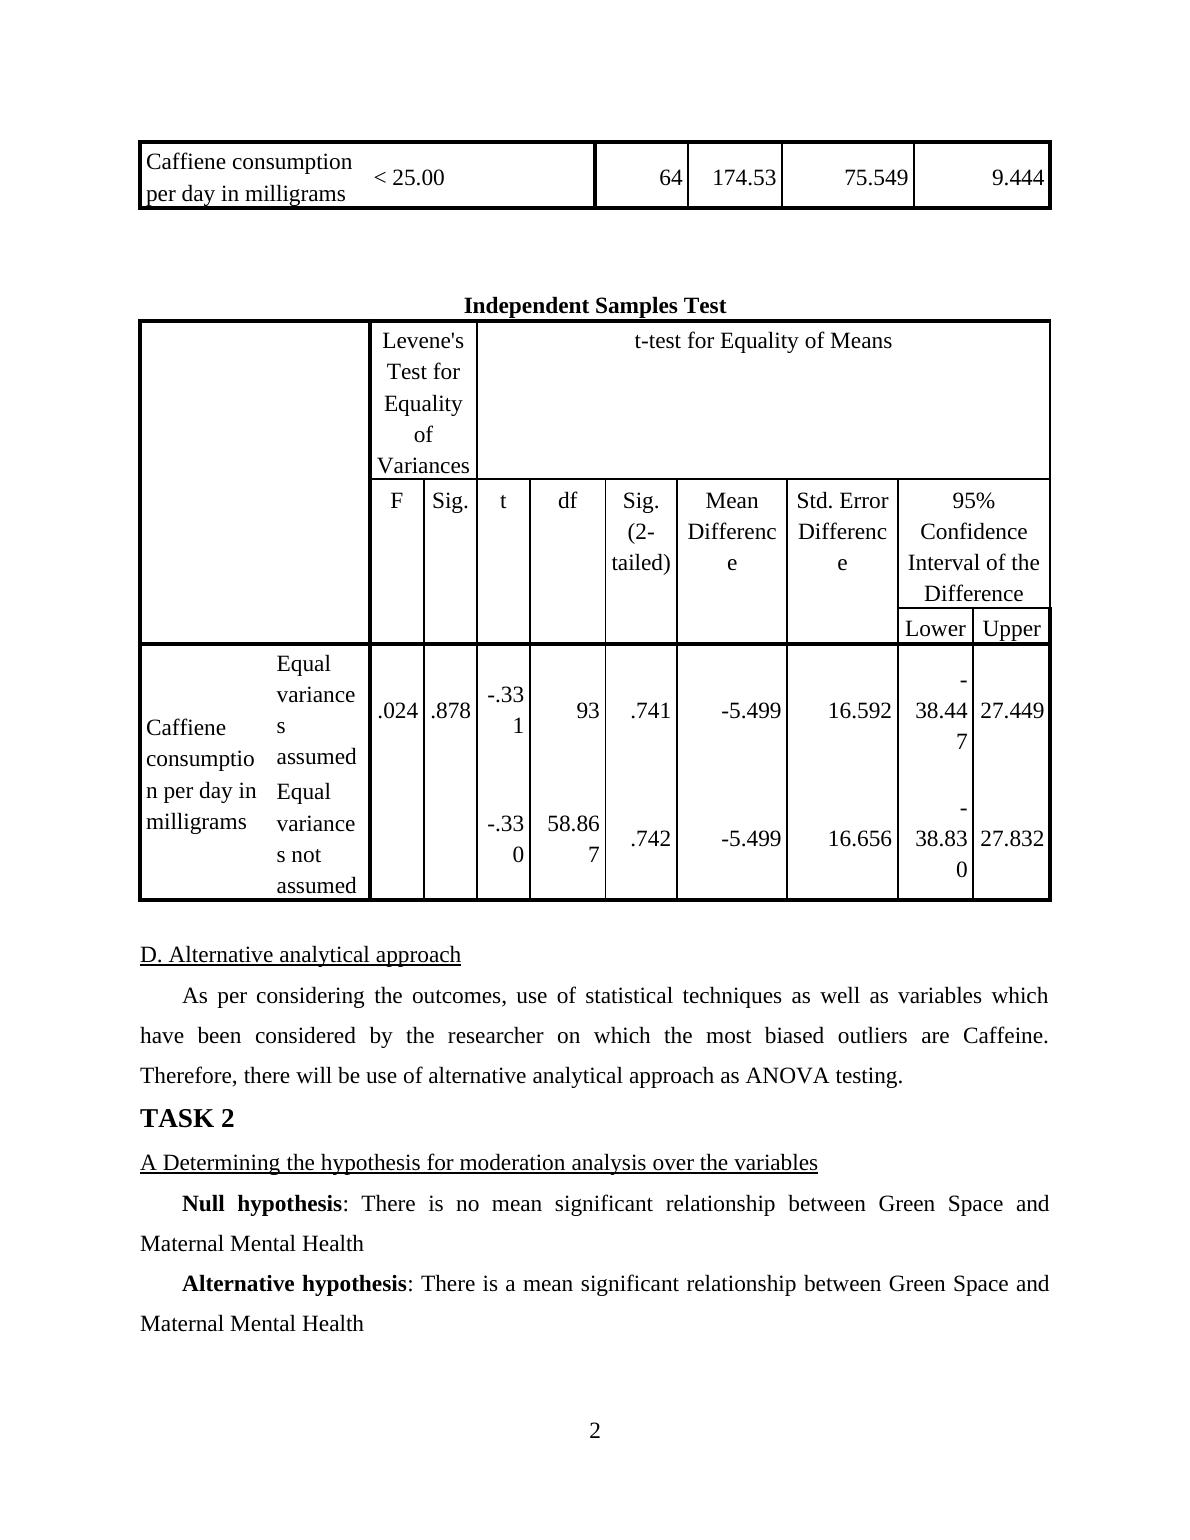
c. Hypothesis testing on the caffeine consumption and age.
Null hypothesis: There is no mean significance difference between controlling age and daily
caffeine consumption
Alternative Hypothesis: There is a mean significance difference between controlling age and
daily caffeine consumption.
Group Statistics
Age of participant in
(decimal) years
N Mean Std.
Deviation
Std. Error
Mean
>= 25.00 31 169.03 76.392 13.720
1
A Determination of outlier by ID number and presenting valid justification
As listed in Appendix on which it can be said that, there have been ascertainment of data base
which were being analysed on the basis of selecting outliers of the analysis. Thus, in respect with
linear regression analysis there have been examination over all the variables (Okada, T. and
et.al., 2018). Among which, age of respondents and the heart beat rate after and before stressful
events have been selected for the further examination thus, selection of such variables based on a
reason that there are interconnected and will bring the appropriate outcomes.
b. Hypothesis testing on variables and summary analysis over the outcomes
Null hypothesis: There is no mean significance difference between controlling age and
changes in heart rate after stressful event
Alternative Hypothesis: There is a mean significance difference between controlling age
and changes in heart rate after stressful event
Summary: On the basis of above listed analysis on which there have been ascertainment
of the relationship between age, after and before heartbeat of stressful event have been analysed.
However, in relation with the model summary of the data base which respect the R value as
0.227 while R square as 0.052 which insist that there is 5.2% of relevance in bases between the
variables. Moreover, F value of the outcomes had been determined here is 2.498 and the
significant analysis over the data base is 0.088. therefore, in respect with such outcomes it can eb
said that the significant value is comparatively higher than the P value of 0.05. Thus, in respect
with this there will be acceptance to the Null hypothesis which states that, there is no mean
significance difference between controlling age and changes in heart rate after stressful event
c. Hypothesis testing on the caffeine consumption and age.
Null hypothesis: There is no mean significance difference between controlling age and daily
caffeine consumption
Alternative Hypothesis: There is a mean significance difference between controlling age and
daily caffeine consumption.
Group Statistics
Age of participant in
(decimal) years
N Mean Std.
Deviation
Std. Error
Mean
>= 25.00 31 169.03 76.392 13.720
1
Caffiene consumption
per day in milligrams < 25.00 64 174.53 75.549 9.444
Independent Samples Test
Levene's
Test for
Equality
of
Variances
t-test for Equality of Means
F Sig. t df Sig.
(2-
tailed
)
Mean
Differenc
e
Std. Error
Differenc
e
95%
Confidence
Interval of the
Difference
Lower Upper
Caffiene
consumptio
n per day in
milligrams
Equal
variance
s
assumed
.024 .878 -.33
1 93 .741 -5.499 16.592
-
38.44
7
27.449
Equal
variance
s not
assumed
-.33
0
58.86
7 .742 -5.499 16.656
-
38.83
0
27.832
D. Alternative analytical approach
As per considering the outcomes, use of statistical techniques as well as variables which
have been considered by the researcher on which the most biased outliers are Caffeine.
Therefore, there will be use of alternative analytical approach as ANOVA testing.
TASK 2
A Determining the hypothesis for moderation analysis over the variables
Null hypothesis: There is no mean significant relationship between Green Space and
Maternal Mental Health
Alternative hypothesis: There is a mean significant relationship between Green Space and
Maternal Mental Health
2
Summary: As per analysing the hypothesis the results listed in Appendix have reflected
several outcomes. However, as per analysing the model summary of the data base on which it
can be said that, R value of variables as 0.118 while R square as 0.014 that is 1.4%. therefore, it
has been analysed here that the data base has 1.4% of relevance with each other. Moreover, in
relation with the significance value, which is analysed as 0.013 is lower than the p value scale
such as 0.05. therefore, in relation with such aspect it can be said that there is strong evidence
against Alternative hypothesis so, there is no mean significant relationship between Green Space
and Maternal Mental Health
B Analysing outcomes with the influences of Mediated effects
Null hypothesis: There is no mean significant relationship between time spend in Green
Space and walk at three times a week
Alternative hypothesis: There is a mean significant relationship between time spend in
Green Space and walk at three times a week.
Summary: In respect with mediated analysis over the data base on which outcomes have
been determined as listed in Appendix. On which time have been considered in the analysis the
relation between time for walking in a week and green space health benefits have been measured.
C Using advance statistical technique for evaluating the outcomes from the variables.
In appendix.
Summary: In respect with analysing the relationship between the variables there have been
consideration over the data set which had been analysed by researchers Model summary of the
data set had been ascertained here which states that R value will be 0.280 and R square as 0.078
that id 7.8%. Therefore, there will be 7.8% of relation had been stated among the variables the
significant value is determined as 0.000. It defines the acceptance to the alternative hypothesis.
Thus, there is a mean significant relationship among the variables.
TASK 3
A.
Oneway
ANOVA
Sum of Squares df Mean Square F Sig.
3
several outcomes. However, as per analysing the model summary of the data base on which it
can be said that, R value of variables as 0.118 while R square as 0.014 that is 1.4%. therefore, it
has been analysed here that the data base has 1.4% of relevance with each other. Moreover, in
relation with the significance value, which is analysed as 0.013 is lower than the p value scale
such as 0.05. therefore, in relation with such aspect it can be said that there is strong evidence
against Alternative hypothesis so, there is no mean significant relationship between Green Space
and Maternal Mental Health
B Analysing outcomes with the influences of Mediated effects
Null hypothesis: There is no mean significant relationship between time spend in Green
Space and walk at three times a week
Alternative hypothesis: There is a mean significant relationship between time spend in
Green Space and walk at three times a week.
Summary: In respect with mediated analysis over the data base on which outcomes have
been determined as listed in Appendix. On which time have been considered in the analysis the
relation between time for walking in a week and green space health benefits have been measured.
C Using advance statistical technique for evaluating the outcomes from the variables.
In appendix.
Summary: In respect with analysing the relationship between the variables there have been
consideration over the data set which had been analysed by researchers Model summary of the
data set had been ascertained here which states that R value will be 0.280 and R square as 0.078
that id 7.8%. Therefore, there will be 7.8% of relation had been stated among the variables the
significant value is determined as 0.000. It defines the acceptance to the alternative hypothesis.
Thus, there is a mean significant relationship among the variables.
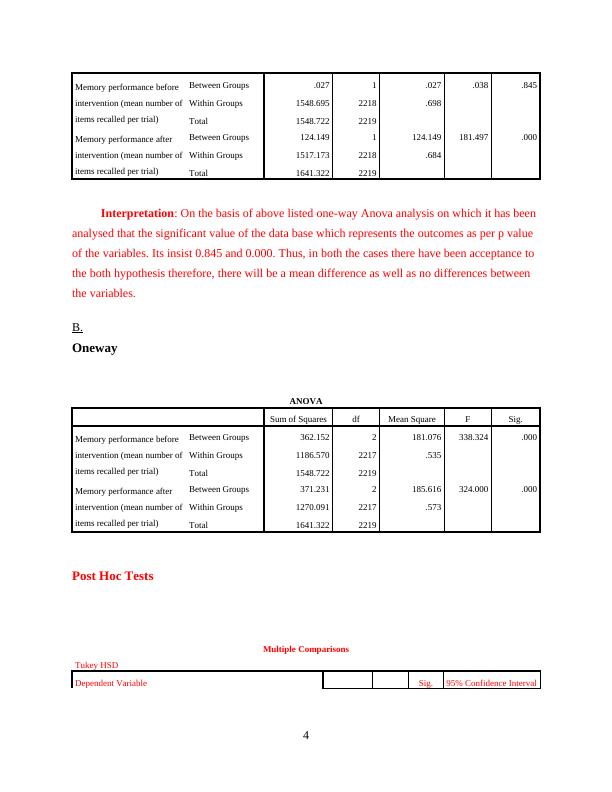
TASK 3
A.
Oneway
ANOVA
Sum of Squares df Mean Square F Sig.
3
Memory performance before
intervention (mean number of
items recalled per trial)
Between Groups .027 1 .027 .038 .845
Within Groups 1548.695 2218 .698
Total 1548.722 2219
Memory performance after
intervention (mean number of
items recalled per trial)
Between Groups 124.149 1 124.149 181.497 .000
Within Groups 1517.173 2218 .684
Total 1641.322 2219
Interpretation: On the basis of above listed one-way Anova analysis on which it has been
analysed that the significant value of the data base which represents the outcomes as per p value
of the variables. Its insist 0.845 and 0.000. Thus, in both the cases there have been acceptance to
the both hypothesis therefore, there will be a mean difference as well as no differences between
the variables.
B.
Oneway
ANOVA
Sum of Squares df Mean Square F Sig.
Memory performance before
intervention (mean number of
items recalled per trial)
Between Groups 362.152 2 181.076 338.324 .000
Within Groups 1186.570 2217 .535
Total 1548.722 2219
Memory performance after
intervention (mean number of
items recalled per trial)
Between Groups 371.231 2 185.616 324.000 .000
Within Groups 1270.091 2217 .573
Total 1641.322 2219
Post Hoc Tests
Multiple Comparisons
Tukey HSD
Dependent Variable Sig. 95% Confidence Interval
4
intervention (mean number of
items recalled per trial)
Between Groups .027 1 .027 .038 .845
Within Groups 1548.695 2218 .698
Total 1548.722 2219
Memory performance after
intervention (mean number of
items recalled per trial)
Between Groups 124.149 1 124.149 181.497 .000
Within Groups 1517.173 2218 .684
Total 1641.322 2219
Interpretation: On the basis of above listed one-way Anova analysis on which it has been
analysed that the significant value of the data base which represents the outcomes as per p value
of the variables. Its insist 0.845 and 0.000. Thus, in both the cases there have been acceptance to
the both hypothesis therefore, there will be a mean difference as well as no differences between
the variables.
B.
Oneway
ANOVA
Sum of Squares df Mean Square F Sig.
Memory performance before
intervention (mean number of
items recalled per trial)
Between Groups 362.152 2 181.076 338.324 .000
Within Groups 1186.570 2217 .535
Total 1548.722 2219
Memory performance after
intervention (mean number of
items recalled per trial)
Between Groups 371.231 2 185.616 324.000 .000
Within Groups 1270.091 2217 .573
Total 1641.322 2219
Post Hoc Tests
Multiple Comparisons
Tukey HSD
Dependent Variable Sig. 95% Confidence Interval
4
End of preview
Want to access all the pages? Upload your documents or become a member.
Related Documents
Analysing data using SPSSlg...
|28
|3295
|64
Impact of Occupation, Education Level, Alcohol Consumption, Glucose Intake, Age, and Weight on Diabetes Diagnosislg...
|7
|1724
|98
Statistics - Assignment (Solution)lg...
|7
|703
|137
SPSS Data Analysis: Pearson’s Correlation, Chi-square and Two-way ANOVA Testinglg...
|11
|1739
|93
ESSC11002 Measurement and Evaluation in Health Sciencelg...
|12
|1990
|57
SPSS Analysis for Deskliblg...
|10
|1741
|292