Business Modeling and Analysis: Initiative Impact Report - FIN60003
VerifiedAdded on 2023/06/03
|24
|2779
|56
Report
AI Summary
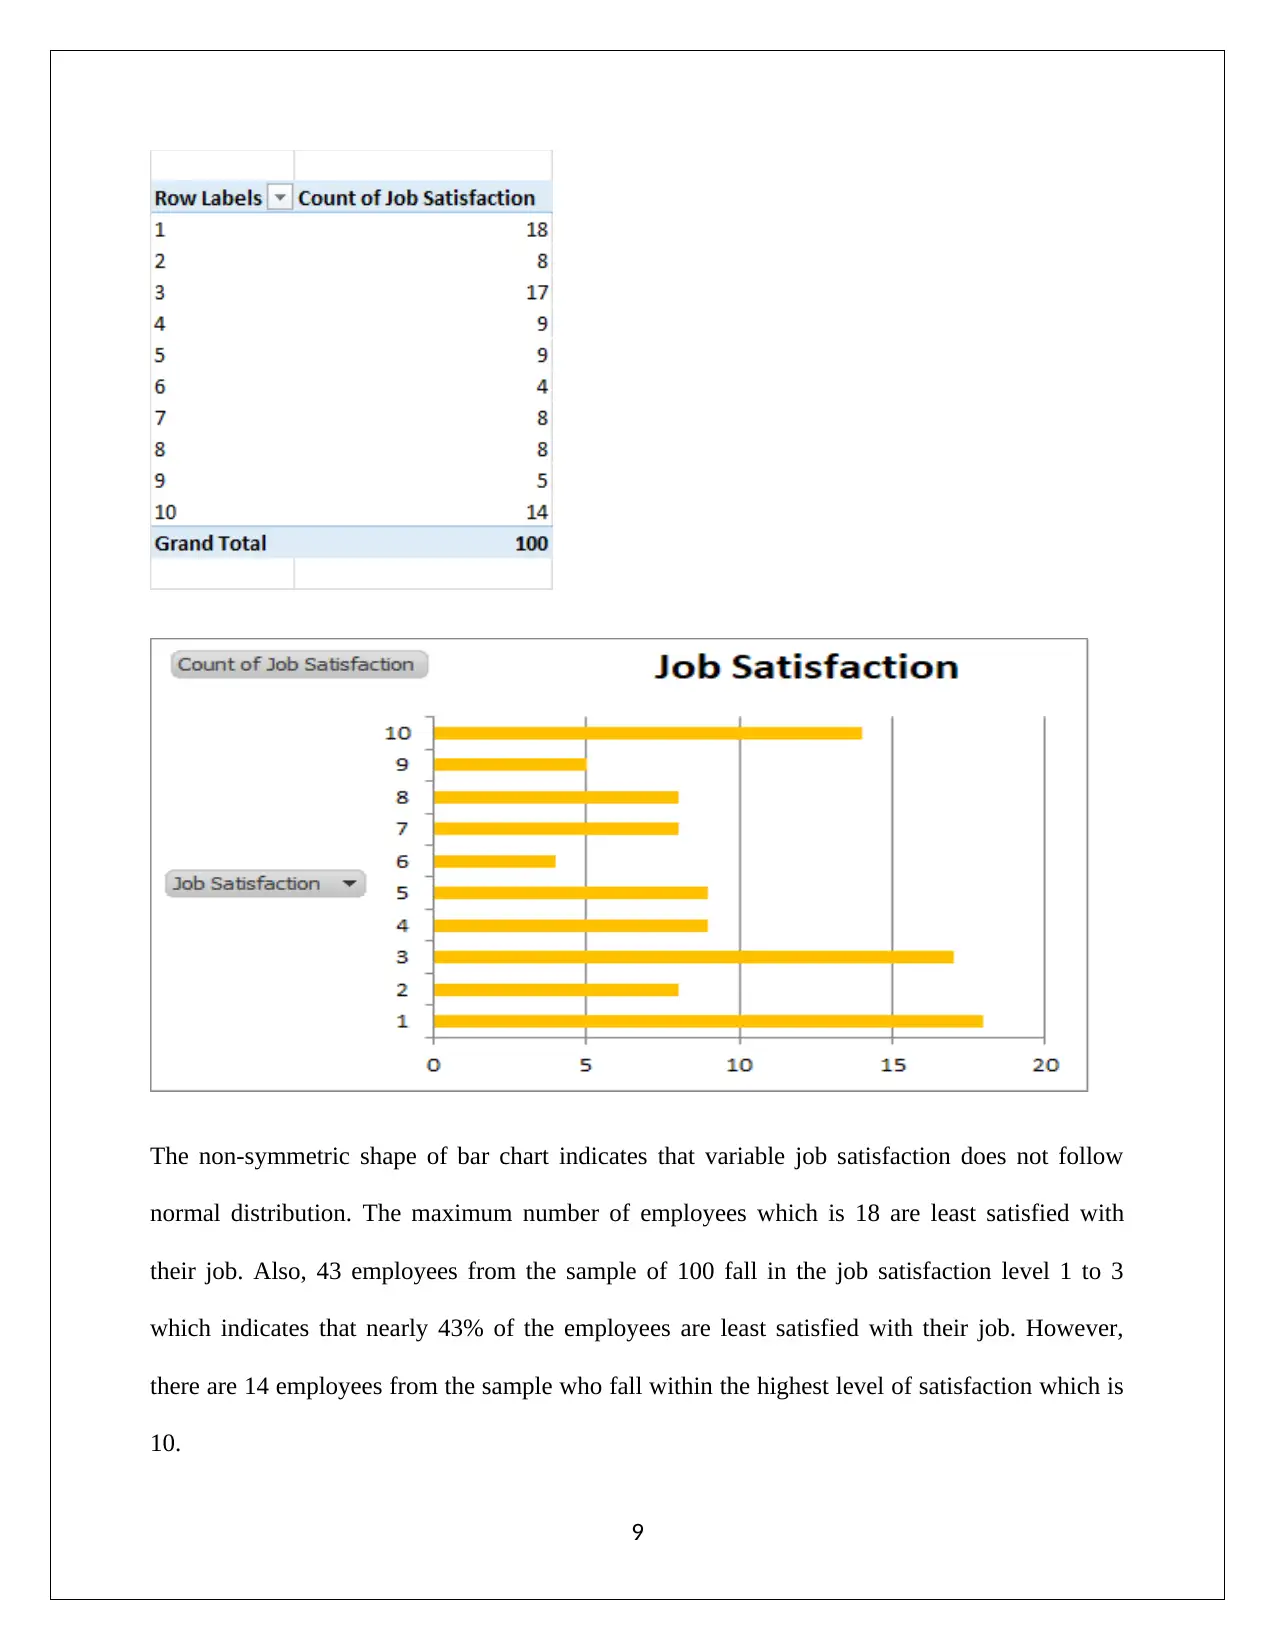
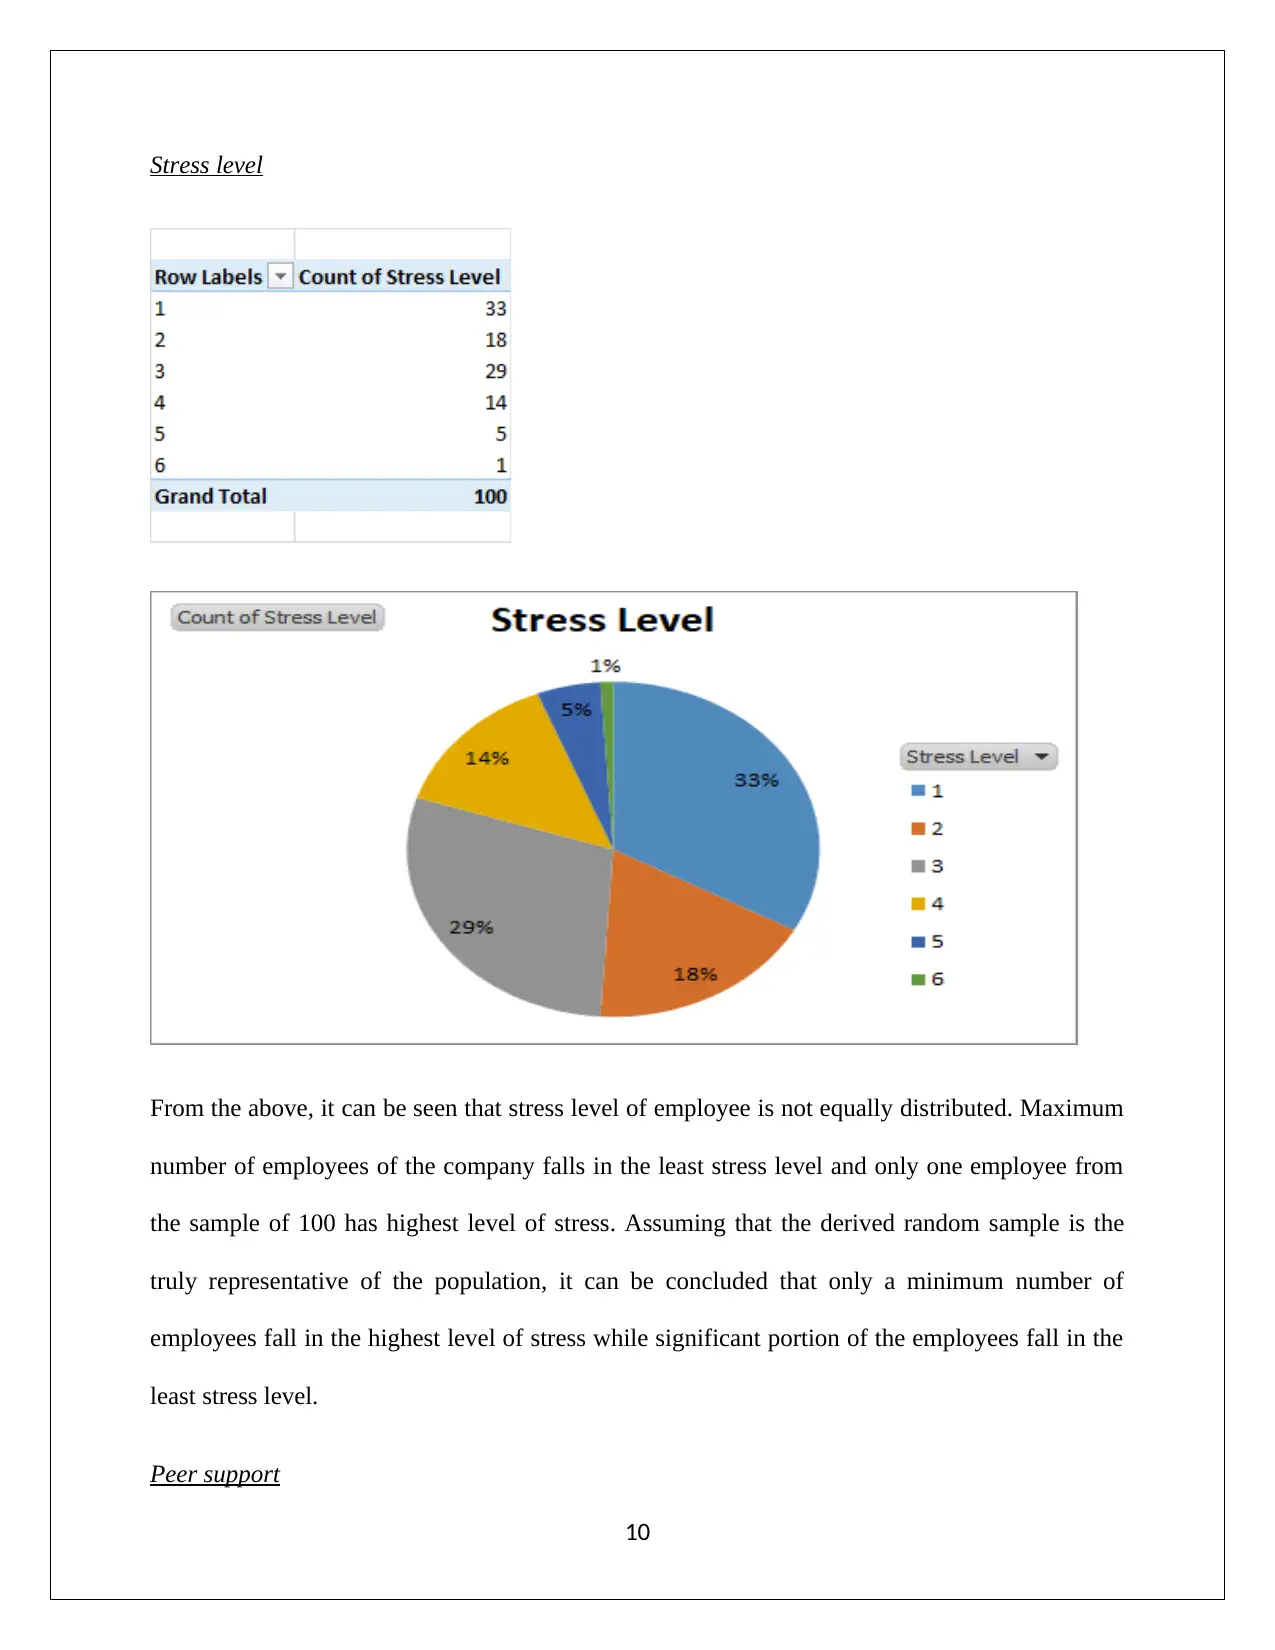
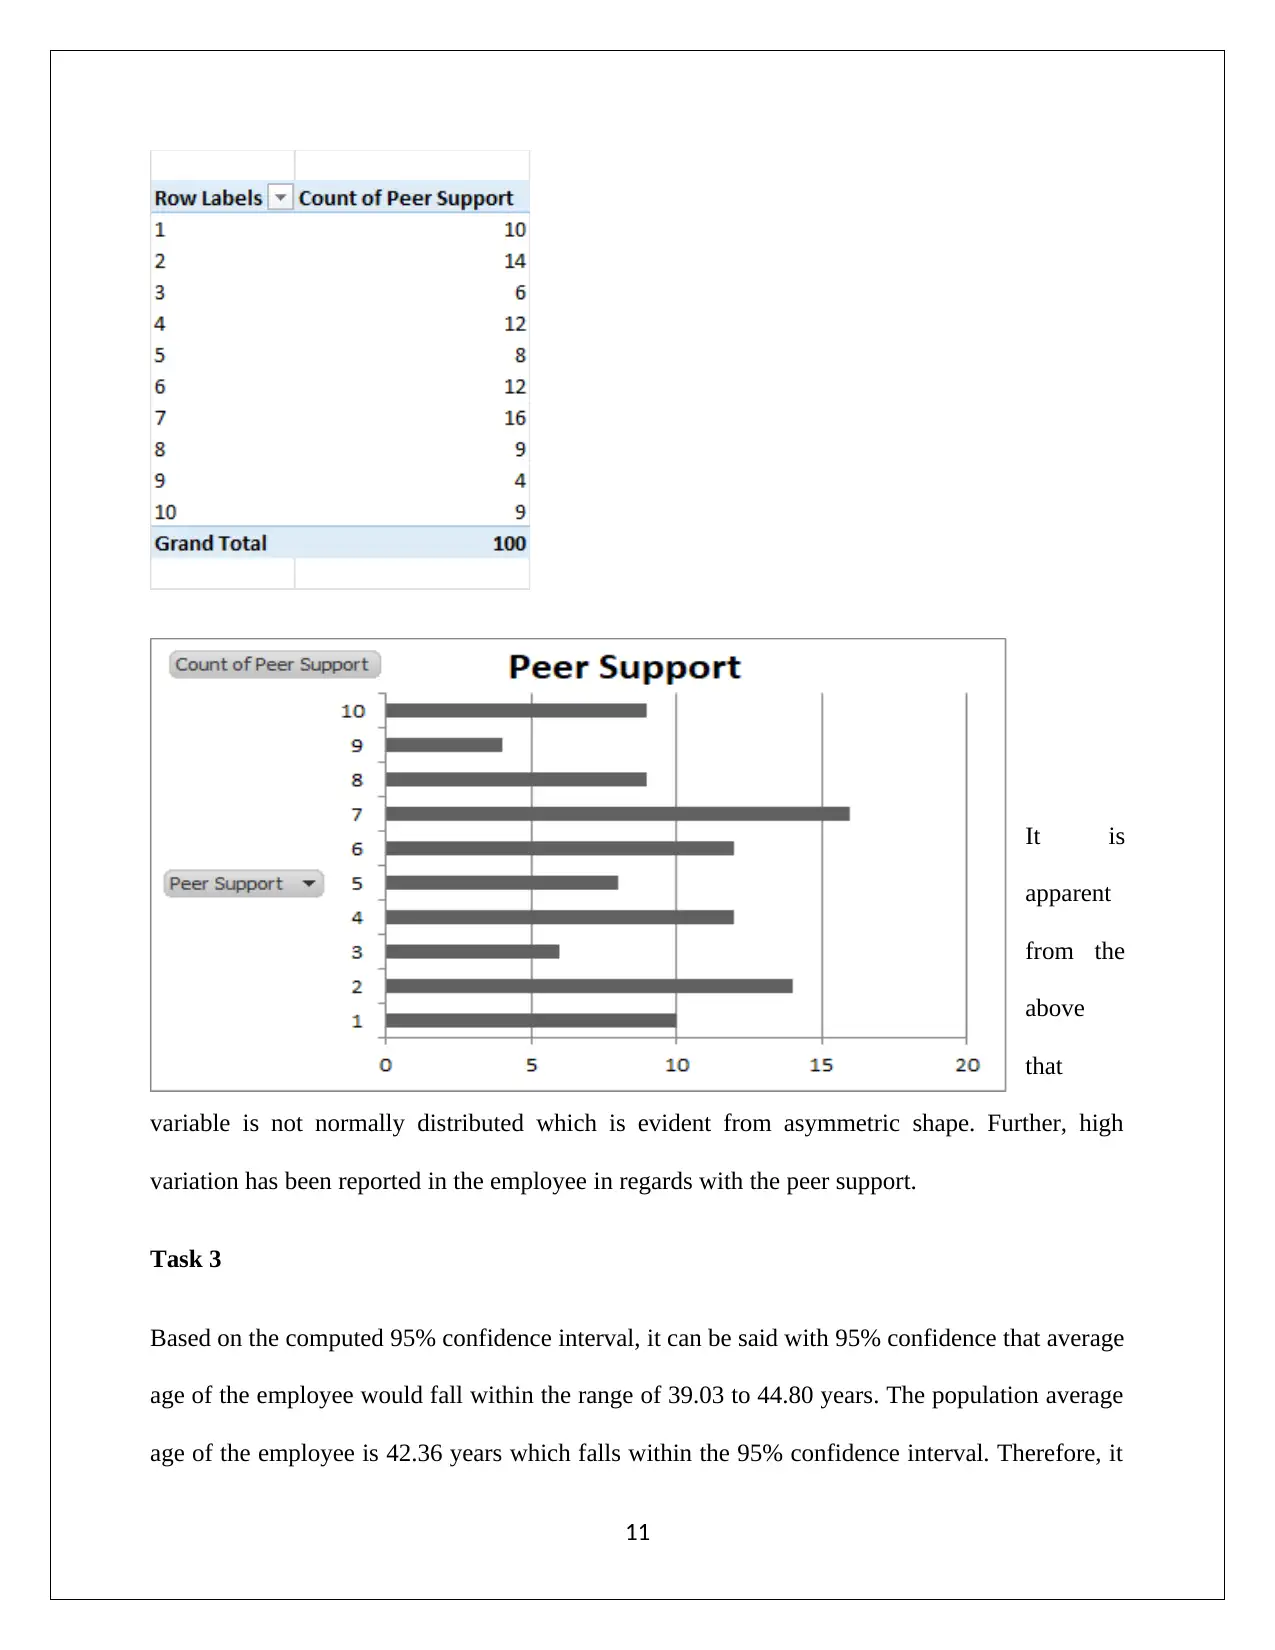
This report analyzes the effectiveness of initiatives undertaken by Margaret, using descriptive and inferential statistics on a sample of 100 employees from a population of 810. The analysis includes confidence interval estimation for average employee age and social media usage, indicating the sample's representativeness. Hypothesis testing suggests social media usage is independent of gender and new initiatives increased peer support without significantly altering stress levels. Regression analysis reveals a negative correlation between social media time and productivity, but no significant relationship with job satisfaction. The report concludes with limitations regarding sampling techniques, data accuracy, and ethical considerations, such as informed consent.
1 out of 24
Related Documents


Your All-in-One AI-Powered Toolkit for Academic Success.
+13062052269
info@desklib.com
Available 24*7 on WhatsApp / Email
![[object Object]](/_next/static/media/star-bottom.7253800d.svg)
Copyright © 2020–2026 A2Z Services. All Rights Reserved. Developed and managed by ZUCOL.