Work Aspect Preference Scale Survey Result Report
Added on 2020-05-11
7 Pages1740 Words236 Views
Work Aspect Preference Scale Survey Result ReportIntroductionThe survey was designed to asses work aspect preferences and job satisfaction in All in Your Mind company (AYM).AYM was established in 1994 to manufacture variety of stress-relieving squeezy toys which are readily available in retail outlets globally. AYM has three sites in different countries Melbourne Australia, Mumbia India and Queenstown New Zealand. It has 319 employees in total.Table 1. AYM employees’ distribution AustraliaIndiaNew ZealandMale Female Male Female Male FemaleManagement17295626Factory workers00006243Customer care2613713900The survey was conducted on 194 employees working for All in Your Mind, the respondent of the survey were chosen at random to answer some set of questions. Factors that were being checked are work aspect preference to determine the qualities of work that different employees considered important. Business problem being solved was how to reduce staff turnover and identify which kinds of employee the company should employ.MethodThis section discusses the procedure and approach in which the survey used to collect data and analyze and report.Participants The respondents used in the survey were employees from AYM from the three sites that is Melbourne, Mumbai and Queenstown. They composed of both gender, male and female. The task force includes 319 employees in different level that is management, factory works and customer care. Mumbai and Melbourne mostly employed customer care and management employees while in Queenstown majority are factory work.Materials and ProcedureA sample of 194 employees was selected to be in survey. Stratified sampling method was used to select the sample, this first subdivide the task forces into three groups depending on site and level of employee and select each employee at random. This method of sampling ensures that the sample is representative and each employee has equal chance to be in the sample. The survey utilized questionnaires as research tools. Each respondent was asked to answer some set of questions concerning job satisfaction, which was self administered. Job satisfaction scale ranged from 18-90 with high score showing greater job satisfaction. Each aspect of job was rated as 1 was jobaspect totally unimportant, 2 job aspect little important, 3 job aspect moderately important and 4 job aspect extremely important. Data analysis The report made use of inferential and descriptive statistics. Descriptive statistics are mainly used to describe the distribution of the data and visualize the data. Inferential statistics used were t-test and analysis of variance (ANOVA) and regression analysis. They are used to check significance between variables.Results
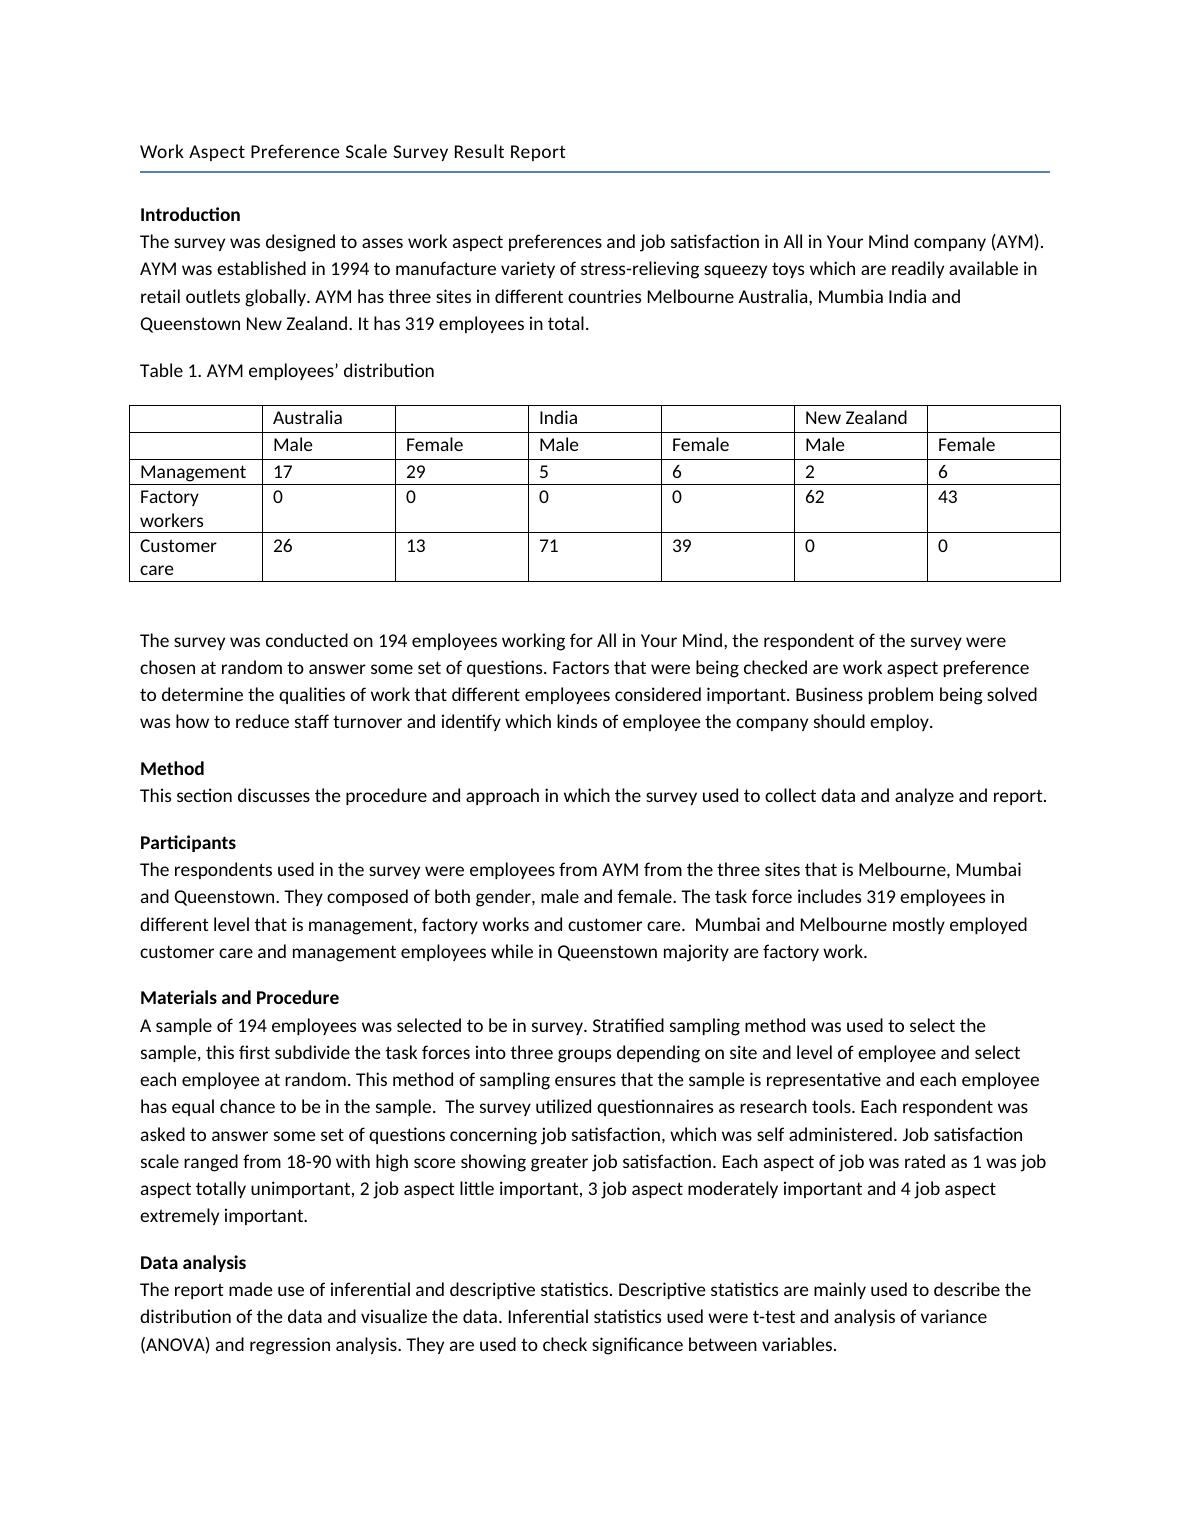
Description of the SampleThe data was cleaned and analyzed using IBM SPSS version 22. All variables were scale expect gender, position, location and team which were nominal variables. As shown by screenshot belowThe distribution of gender was 31.44% male and 68.56% female. There was high proportion of male in the sample as compared to female. This is representation of population of employees in AYM; female employees are more compared to females.The distribution of respondents with location is shown below
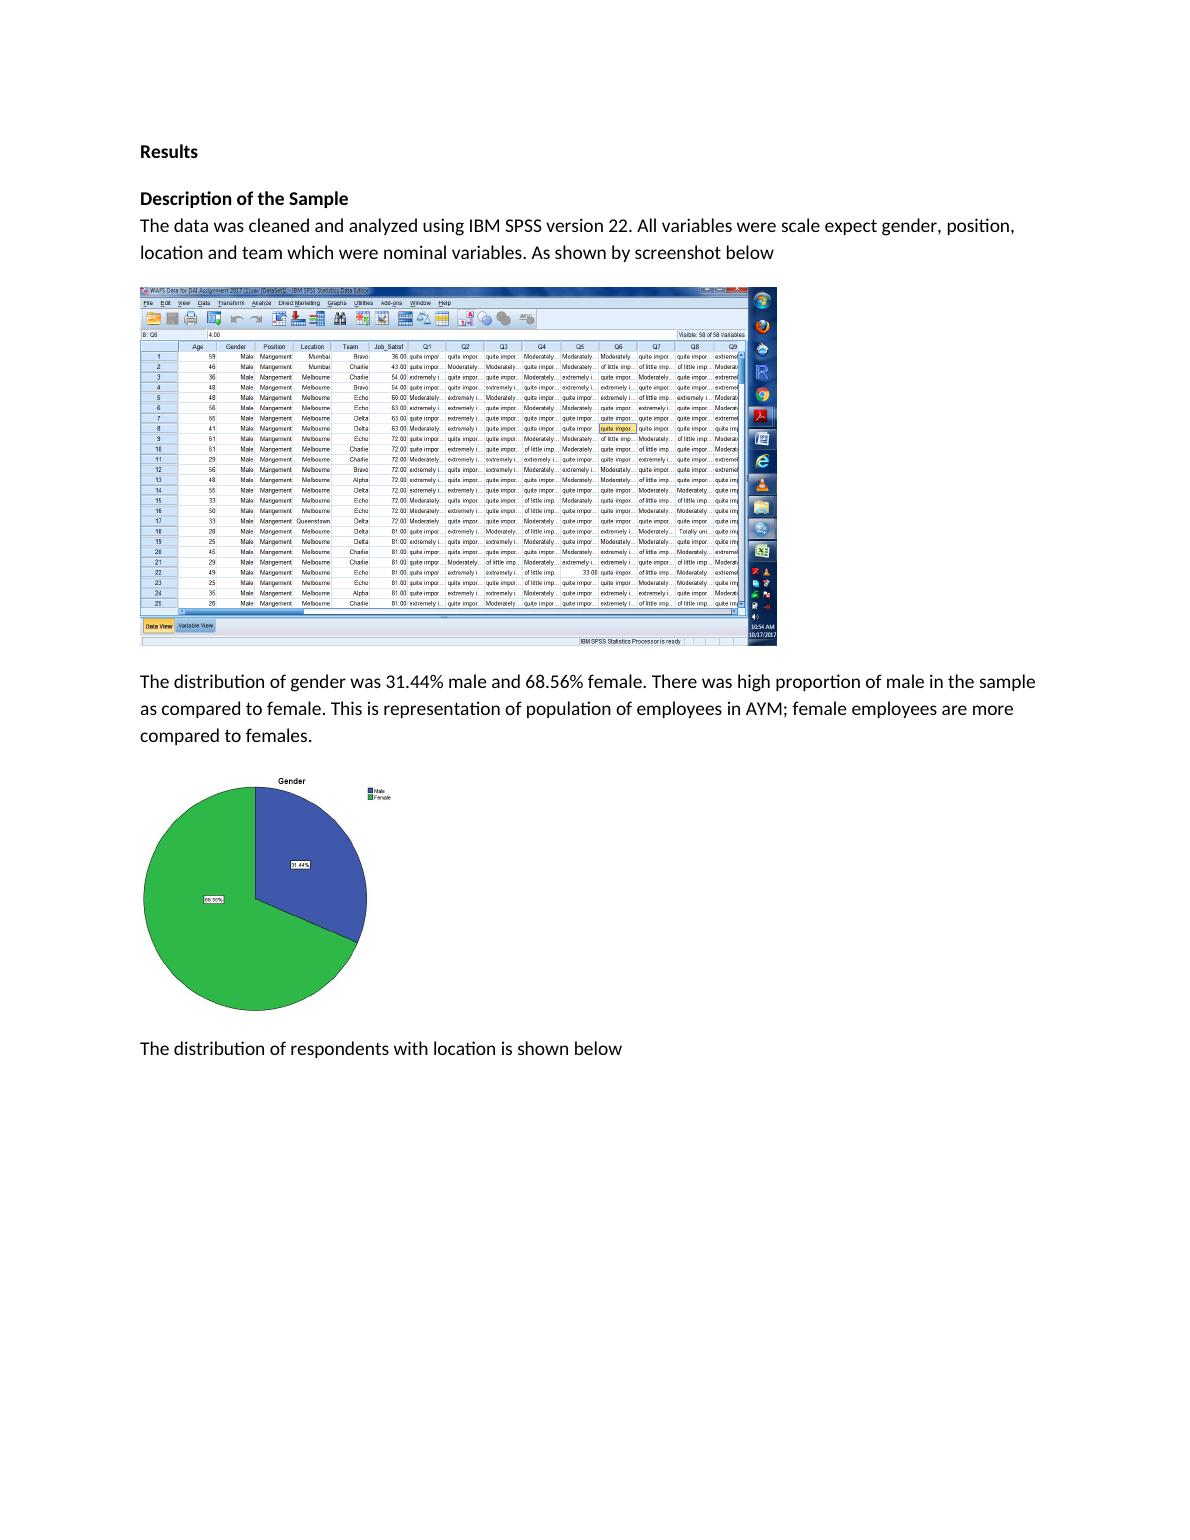
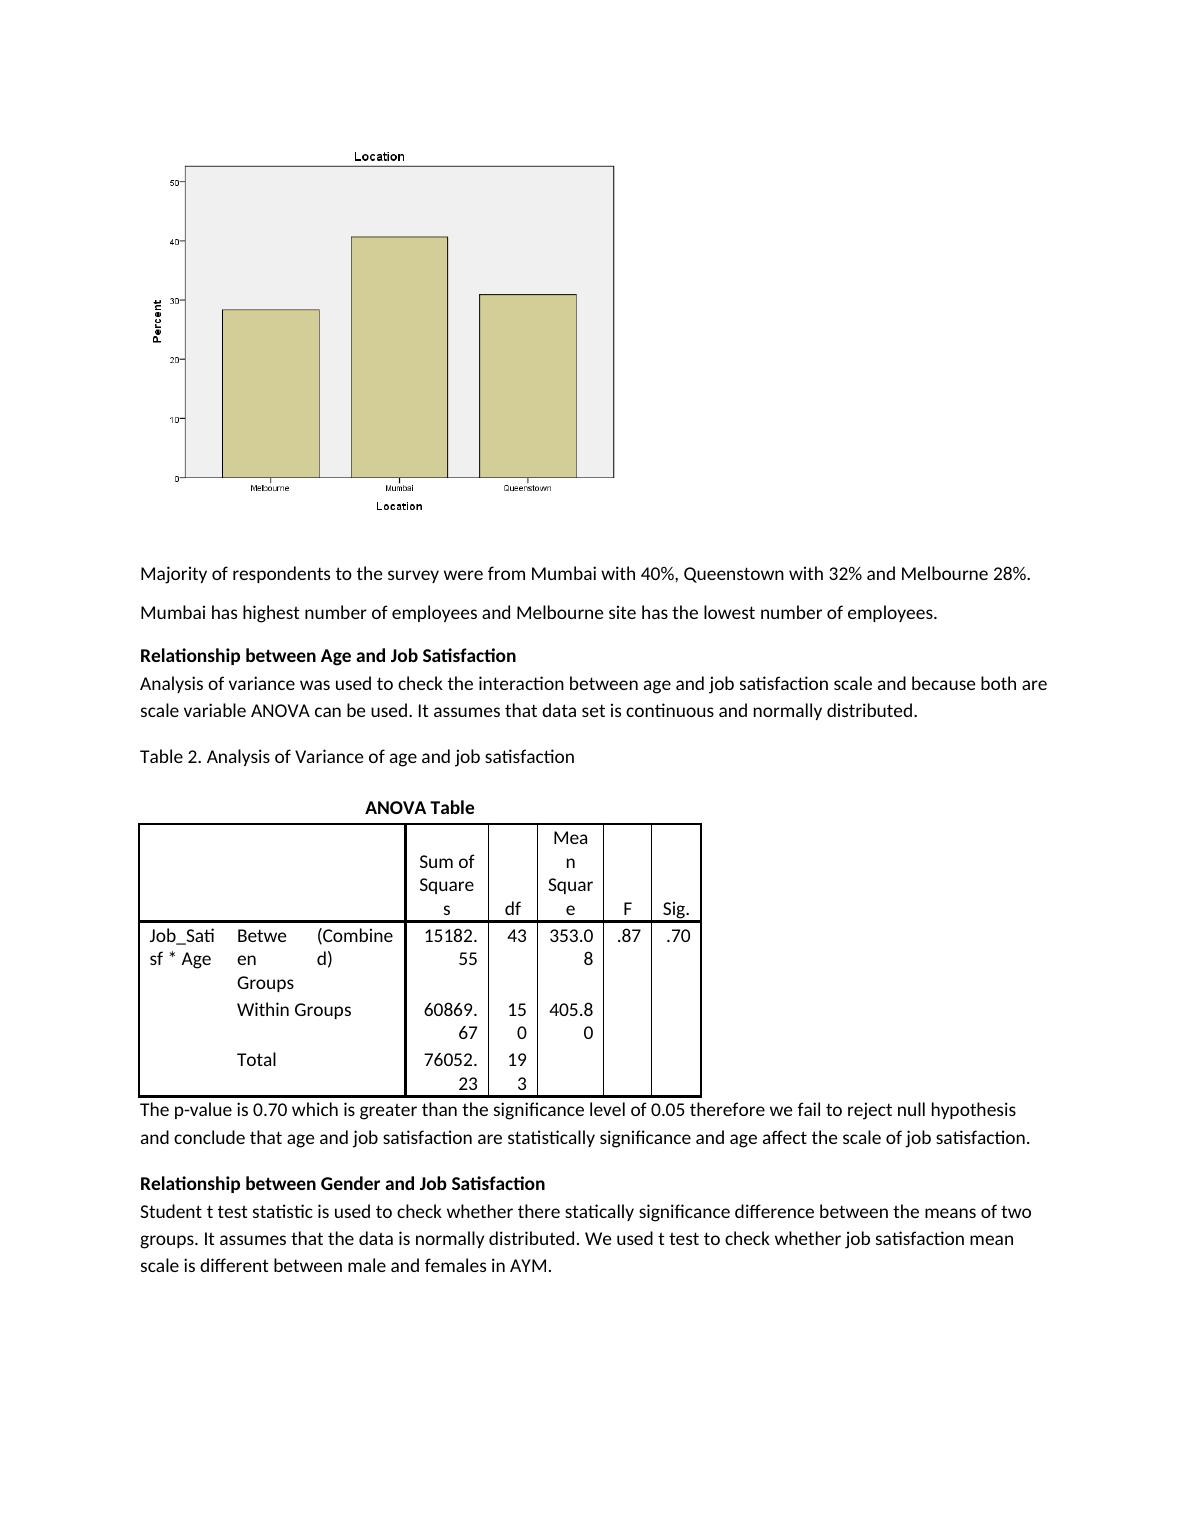
Majority of respondents to the survey were from Mumbai with 40%, Queenstown with 32% and Melbourne 28%. Mumbai has highest number of employees and Melbourne site has the lowest number of employees. Relationship between Age and Job SatisfactionAnalysis of variance was used to check the interaction between age and job satisfaction scale and because both arescale variable ANOVA can be used. It assumes that data set is continuous and normally distributed. Table 2. Analysis of Variance of age and job satisfactionANOVA TableSum ofSquaresdfMeanSquareFSig.Job_Satisf * AgeBetween Groups(Combined)15182.5543353.08.87.70Within Groups60869.67150405.80Total76052.23193The p-value is 0.70 which is greater than the significance level of 0.05 therefore we fail to reject null hypothesis and conclude that age and job satisfaction are statistically significance and age affect the scale of job satisfaction.Relationship between Gender and Job SatisfactionStudent t test statistic is used to check whether there statically significance difference between the means of two groups. It assumes that the data is normally distributed. We used t test to check whether job satisfaction mean scale is different between male and females in AYM.Independent Samples TestLevene'sTest forEquality ofVariancest-test for Equality of MeansFSig.tdfSig.(2-tailed)MeanDifferenceStd.ErrorDifference95%ConfidenceInterval of theDifferenceLowerUpperJob_SatisfEqual variances .59.44-1.76192.000.08-5.383.05-11.40.64
End of preview
Want to access all the pages? Upload your documents or become a member.
Related Documents
Statistics: Analysis of Gender Gap in Salarylg...
|12
|2238
|347
Exploratory Data Analysis and Factorial ANOVAlg...
|11
|1959
|216
Gender Differences in Salary - PDFlg...
|11
|1984
|130
A Study of Salary and Occupation Relationship in Australialg...
|11
|1942
|358
Impact of Initiatives on Employees: Statistical Analysislg...
|24
|2779
|56
Statistical Modelling Assignment Samplelg...
|9
|1909
|34