Cardiff Fertility Study: Examining Socioeconomic Factors of LBW
VerifiedAdded on 2023/05/28
|11
|3743
|481
Report
AI Summary
This report investigates the socioeconomic factors associated with low birth weight (LBW) using data from the Cardiff Fertility Study (1970-1979). The study analyzes deliveries to residents of Cardiff and Southern Glamorgan, focusing on mothers with pregnancies of at least 37 weeks. Logistic regression and Chi-square statistics were used to assess the relationship between explanatory variables and LBW. Key findings indicate that smoking habits, maternal socioeconomic status, and blood pressure are significant predictors of LBW. The study highlights the importance of interventions targeting these risk factors to reduce LBW incidence. The report includes descriptive statistics, categorical associations, and results of binomial logistic regression, providing a comprehensive analysis of the factors influencing infant birth weight.
Infant Mortality and Lower Birth Rate – A Cross-sectional
Study with Socioeconomic Factors
Abstract
The main goal was to identify risk factors, in particular, low birth weight, to prove the nature of
interventions in order to reduce socio-economic inequalities and factors that can bring the child's
low birth weight. According to the study, all deliveries to residents of Cardiff and Southern Glam
were analyzed. This subset of the total election data represents mothers with simple birth
estimates that have at least 37 weeks’ of pregnancy. The multidimensional relationships between
the explanatory and LBW variables were computed using logistic regression. The description of
the relationship between low birth weight and other variables was examined with the percentage
and Pearson Chi-square stats. The study found that when analyzing several LBW risk factors,
some variable risk factors would intervene to reduce LBW results. This study shows that the
lower increase in maternal dependence and smoking, along with blood pressure were essential
predictors of LBW. Looking at character behavior, as mentioned above, it would be advisable to
take steps to reduce LBW risk. The study showed that over 98% of this group has a socio-
economic impact on the correct birth weight. More than 70 percent of non-smokers related to
their children's healthy weight.
1
Paraphrase This Document
Need a fresh take? Get an instant paraphrase of this document with our AI Paraphraser
Introduction
Low birth weight (LBW) is one of the biggest predictors of infant mortality. The global
incidence of LBW is around 17%, although estimates range from 19% in developing countries to
5-7% in developed countries (Demelash, Motbainor, Nigatu, Gashaw, & Melese, 2015). LBW is
usually associated with situations where uterine malnutrition is produced due to changes in
placental blood circulation. There are many known risk factors, the most important of which are
socio-economic factors, medical risks before or during ingestion and the mother's lifestyle.
However, although interventions exist to prevent many of these factors before and during
pregnancy, the incidence of LBW has not decreased (Broman, Nichols, & Kennedy, 2017; Doyle
et al., 2015).
The main objective was to identify the risk factors, particularly of low birth weight, in order to
revise the nature of interventions to reduce socioeconomic inequality, and factors that may risk
for a child with a low birth weight. The data set to be used in the evaluation is derived from the
Cardiff fertility study, which was collected in 1970 to 79 years and recorded in 1994. The study
included all deliveries to residents of Cardiff and southern Glam bodies. This subset of full
election data represents mothers with simple birth estimates that are at least 37 weeks in the tidal
age during childbirth. There are only over 4700 mothers and their birth results, along with
demographic and other data.
Methods
The study variables brief description of the categorical variables were made in the study of
the relationship between each explanatory variable and low birth weight, especially in the
context of low and significant variable weights at birth. The string variables were converted
in numerical and categorical variables for this purpose.
The explanatory memorandum was examined and for the categorical variables their
frequency with percentages have presented in Table 1. Mean and standard deviation were
not the appropriate measures here.
2
The LBW frequency was calculated for each category of explanatory variables and the one
to one association was evaluated with Chi-square test. The multidimensional relationships
between the explanatory and LBW variables were calculated by means of logistic
regression.
Custom model behavior and LBW were calculated using the Multi-variable logistic
adjustment of the explanatory factors and statistically.
The main interactions were noted in the logistic modeling, and two way and more than two
interactions were not observed. The one way associations were confounded by the chi square
analysis, due to the categorical nature of the variables. The coefficients of the regression
models were not represented as we were not interested particularly in the equation form.
The results are presented in the form of odds ratio, especially with 95% of confidence
intervals and values of significance level. The analysis made assumptions, including the
manipulation of missing values, in which the state's environment was programmed to bypass
the analysis of the missing value.
The chi square frequency values with percentage representation and the logistic regression
analyses have presented in Table 2. The odds in favor of both the scenarios for lower birth
weight have been provided with adjusted odd ratios from multiple logistic models.
Results
Descriptive Summary
A summary of the study sample has been provided with a description of the relationship between
low birth weight and socioeconomic status. Overall out of the study subjects of 4781 infants,
2450 (P = 51.24%) males and 2331 (P = 48.76%) females had an LBW outcome prior to 1979.
The modal age group in the sample was 30 - 39 years (N =1802, P = 37.69%).The study sample
was evenly split between subjects with a low socioeconomic behaviour status (N = 2419, P =
50.6%) and high socioeconomic status (N =2362, P = 49.4%). Just above half of the study
mothers were in between 155 and 165 centimeters. Current smokers and ex-smokers were less
than 30% (N = 1349, P = 28.22%) and rest were found to be non-smokers (N = 3432, N =
71.78%). Considering the blood pressure readings indicated that most of the participants had
normal blood pressure (N = 4399, P = 92.01%) and rest of them were diagnosed with
hypertension (N = 382, P = 7.99%). More than half of the proportion of subjects (N = 2458, P =
3
⊘ This is a preview!⊘
Do you want full access?
Subscribe today to unlock all pages.
Trusted by 1+ million students worldwide
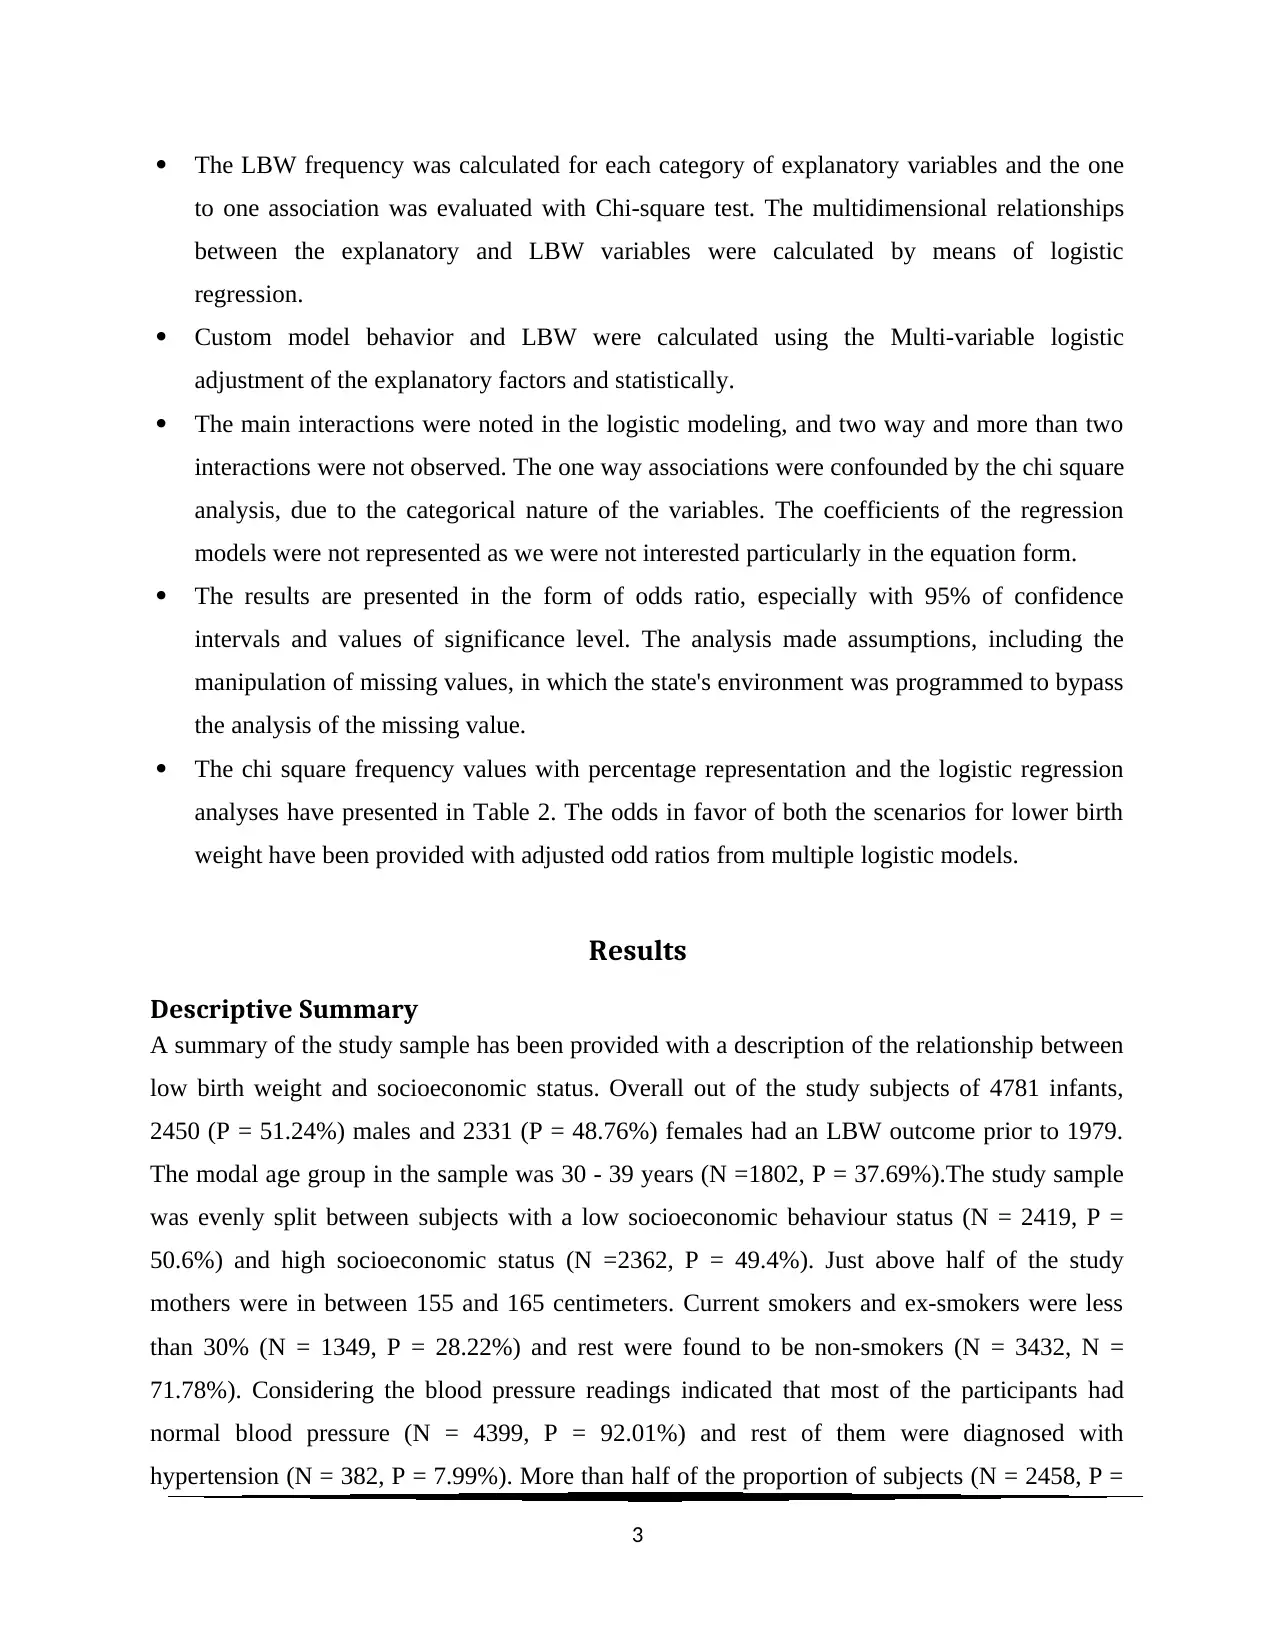
51.41%) had BMI scores between 18.5 and 25. Some of them had a height reading above the 165
centimetres (N = 1689, P = 37.02%).
1.706
1.501
0 .5 1 1.5 2
A verg e S ocioe con om ic S ta tu s
LBW Normal
Birth Weight Category
Relation of Socioeconomic Status with LBW
Figure 1: Lower Birth Weight Percentage Distribution
Source: Cardiff fertility study, which was collected in 1970 to 79 years and recorded in 1994
Categorical Association
A description of the relationship between low birth weight and other variables was investigated
with the proportion of subjects and Pearson’s Chi-square statistic. The proportion of marital
status was found to behave no statistically significant association with LBW (p>0.05) at 5%
level. Unemployment ratio was found to be lower in those subjects who had normal weight child
(N = 4606, P = 96.68%). The mothers with hypertension ailments (N = 382, P = 7.99%) were
found to have a significant association with the lower birth weight of their child. The smoking
habit of mothers and subjects diagnosed with infant mortality (N = 1349, P = 28.22%) was
strongly associated. As expected, the proportion of subjects with a healthy weight at 20 weeks of
pregnancy had significantly fewer LBW outcomes. There was a decreasing trend observed in
increasing body mass index, but the relationship was not statistically significant. The
predominance of white peoples was noted in the sample and they were found to be giving birth
to healthy babies (N = 4158, N = 91.1%).
4
Paraphrase This Document
Need a fresh take? Get an instant paraphrase of this document with our AI Paraphraser
Missing information for various variables was observed. The ethnicity of 217 subjects was
missing, whereas, 5 subjects did not provide their age group. Where 41 mothers did not reveal
their marital status, 218 failed to provide the details about their height. Information on mothers'
weight was unavailable for 716 mothers. Birth weights of every infant were available to us. The
missing values were coded in STATA environment for exclusion purpose.
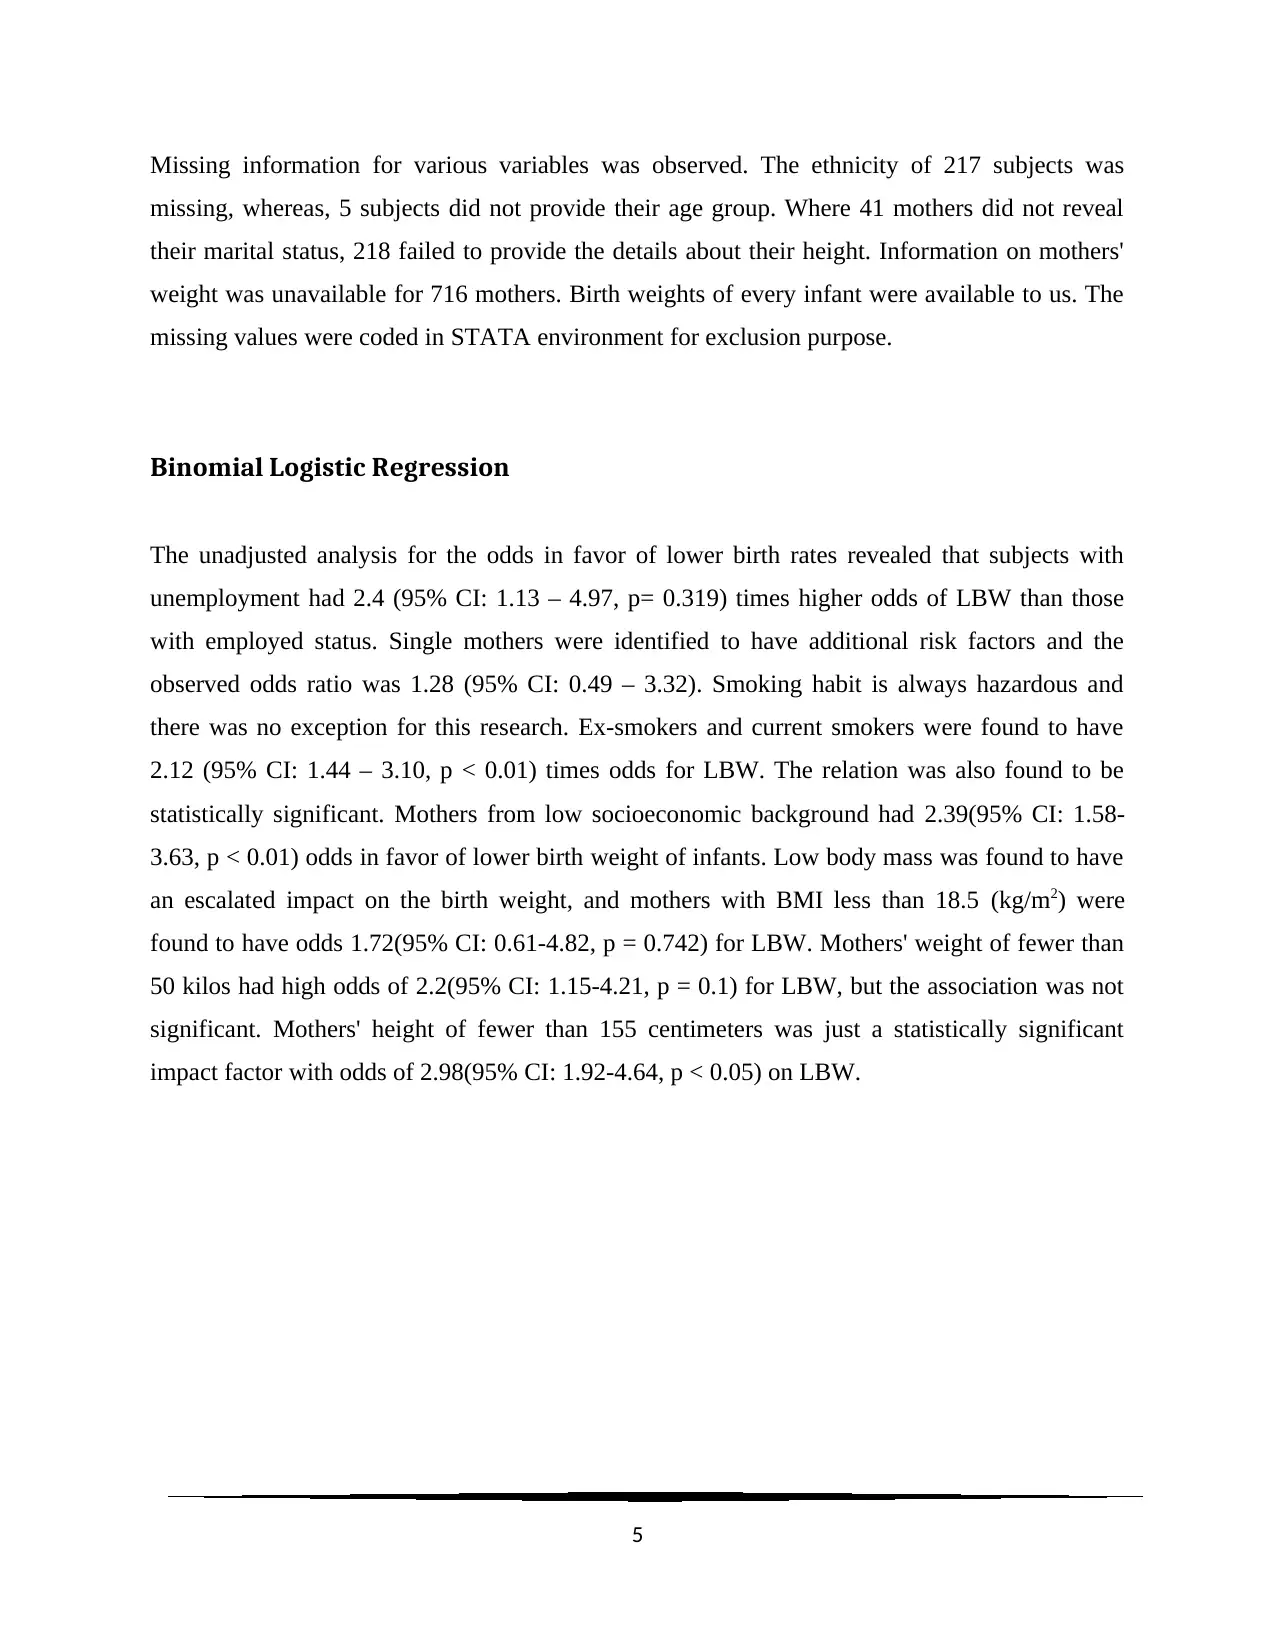
Binomial Logistic Regression
The unadjusted analysis for the odds in favor of lower birth rates revealed that subjects with
unemployment had 2.4 (95% CI: 1.13 – 4.97, p= 0.319) times higher odds of LBW than those
with employed status. Single mothers were identified to have additional risk factors and the
observed odds ratio was 1.28 (95% CI: 0.49 – 3.32). Smoking habit is always hazardous and
there was no exception for this research. Ex-smokers and current smokers were found to have
2.12 (95% CI: 1.44 – 3.10, p < 0.01) times odds for LBW. The relation was also found to be
statistically significant. Mothers from low socioeconomic background had 2.39(95% CI: 1.58-
3.63, p < 0.01) odds in favor of lower birth weight of infants. Low body mass was found to have
an escalated impact on the birth weight, and mothers with BMI less than 18.5 (kg/m2) were
found to have odds 1.72(95% CI: 0.61-4.82, p = 0.742) for LBW. Mothers' weight of fewer than
50 kilos had high odds of 2.2(95% CI: 1.15-4.21, p = 0.1) for LBW, but the association was not
significant. Mothers' height of fewer than 155 centimeters was just a statistically significant
impact factor with odds of 2.98(95% CI: 1.92-4.64, p < 0.05) on LBW.
5
missing, whereas, 5 subjects did not provide their age group. Where 41 mothers did not reveal
their marital status, 218 failed to provide the details about their height. Information on mothers'
weight was unavailable for 716 mothers. Birth weights of every infant were available to us. The
missing values were coded in STATA environment for exclusion purpose.
Binomial Logistic Regression
The unadjusted analysis for the odds in favor of lower birth rates revealed that subjects with
unemployment had 2.4 (95% CI: 1.13 – 4.97, p= 0.319) times higher odds of LBW than those
with employed status. Single mothers were identified to have additional risk factors and the
observed odds ratio was 1.28 (95% CI: 0.49 – 3.32). Smoking habit is always hazardous and
there was no exception for this research. Ex-smokers and current smokers were found to have
2.12 (95% CI: 1.44 – 3.10, p < 0.01) times odds for LBW. The relation was also found to be
statistically significant. Mothers from low socioeconomic background had 2.39(95% CI: 1.58-
3.63, p < 0.01) odds in favor of lower birth weight of infants. Low body mass was found to have
an escalated impact on the birth weight, and mothers with BMI less than 18.5 (kg/m2) were
found to have odds 1.72(95% CI: 0.61-4.82, p = 0.742) for LBW. Mothers' weight of fewer than
50 kilos had high odds of 2.2(95% CI: 1.15-4.21, p = 0.1) for LBW, but the association was not
significant. Mothers' height of fewer than 155 centimeters was just a statistically significant
impact factor with odds of 2.98(95% CI: 1.92-4.64, p < 0.05) on LBW.
5
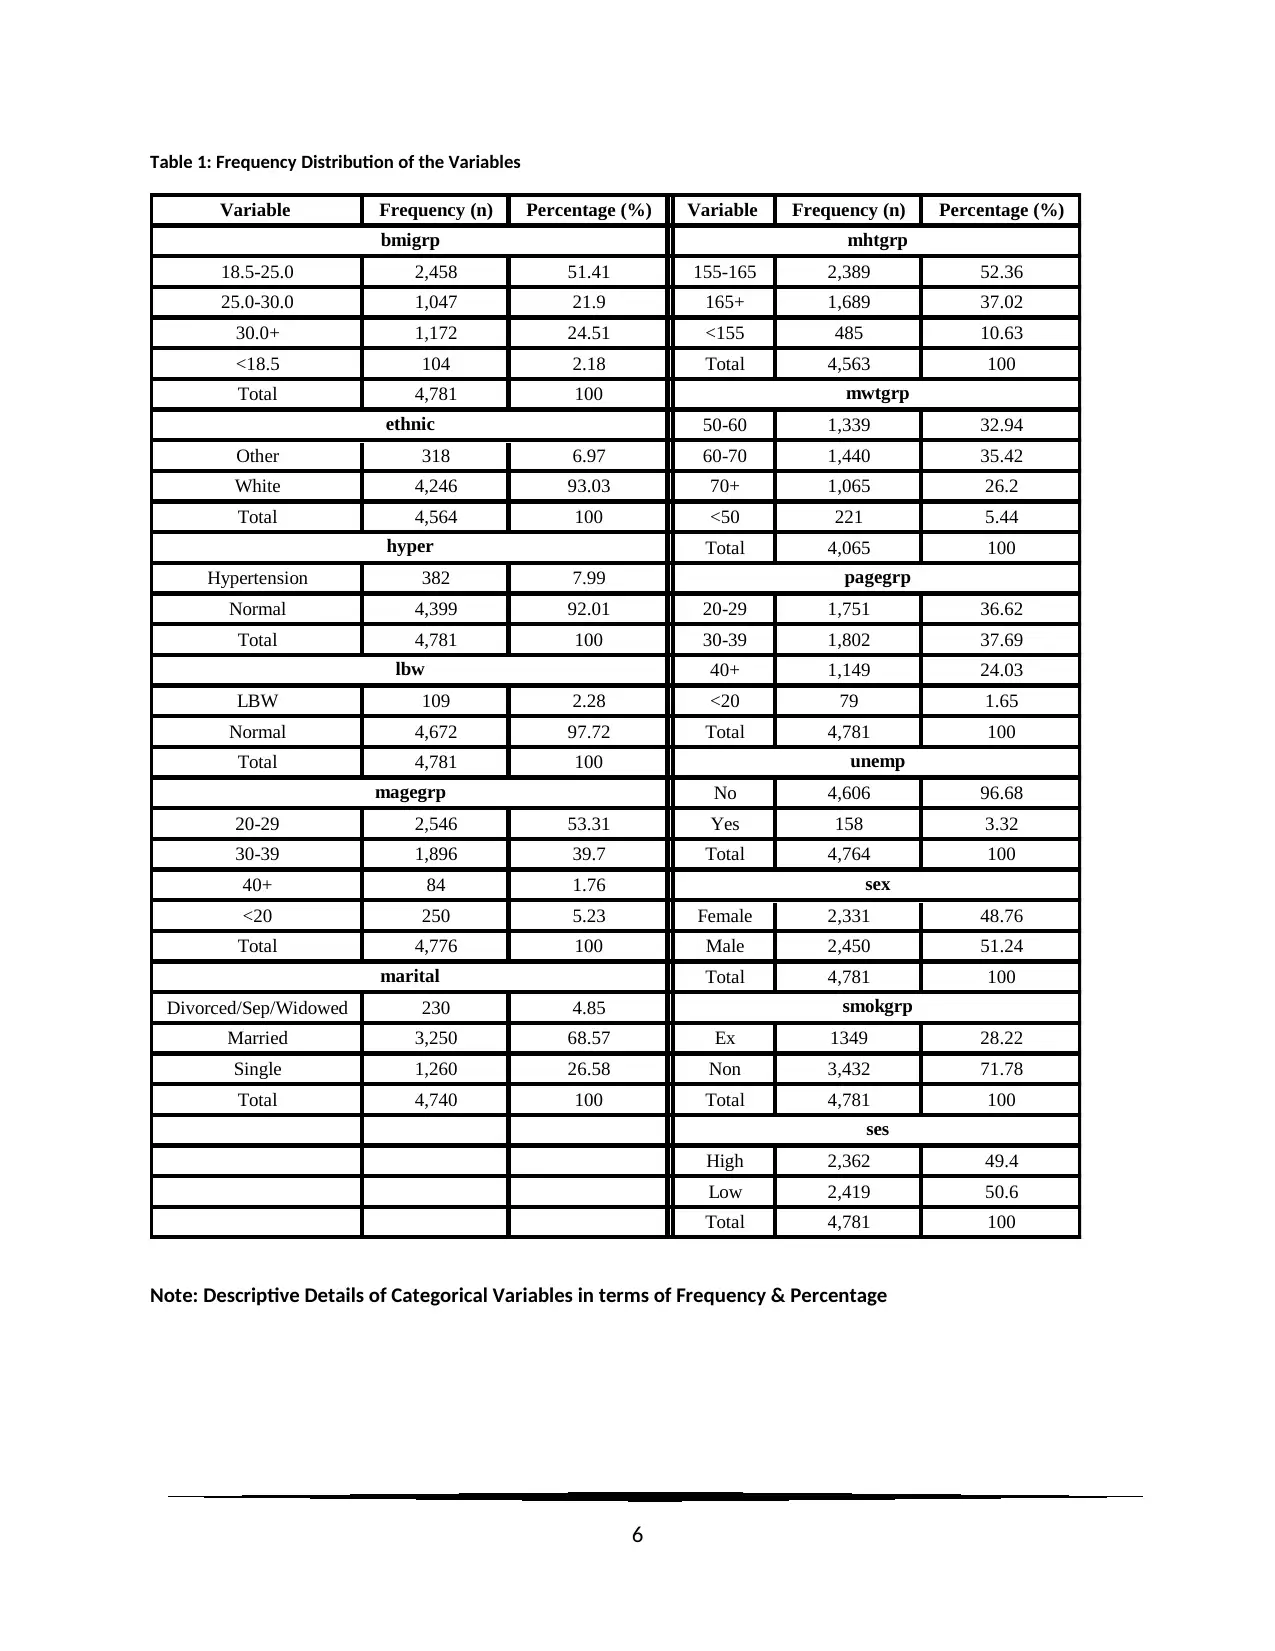
Table 1: Frequency Distribution of the Variables
Variable Frequency (n) Percentage (%) Variable Frequency (n) Percentage (%)
18.5-25.0 2,458 51.41 155-165 2,389 52.36
25.0-30.0 1,047 21.9 165+ 1,689 37.02
30.0+ 1,172 24.51 <155 485 10.63
<18.5 104 2.18 Total 4,563 100
Total 4,781 100
50-60 1,339 32.94
Other 318 6.97 60-70 1,440 35.42
White 4,246 93.03 70+ 1,065 26.2
Total 4,564 100 <50 221 5.44
Total 4,065 100
Hypertension 382 7.99
Normal 4,399 92.01 20-29 1,751 36.62
Total 4,781 100 30-39 1,802 37.69
40+ 1,149 24.03
LBW 109 2.28 <20 79 1.65
Normal 4,672 97.72 Total 4,781 100
Total 4,781 100
No 4,606 96.68
20-29 2,546 53.31 Yes 158 3.32
30-39 1,896 39.7 Total 4,764 100
40+ 84 1.76
<20 250 5.23 Female 2,331 48.76
Total 4,776 100 Male 2,450 51.24
Total 4,781 100
Divorced/Sep/Widowed 230 4.85
Married 3,250 68.57 Ex 1349 28.22
Single 1,260 26.58 Non 3,432 71.78
Total 4,740 100 Total 4,781 100
High 2,362 49.4
Low 2,419 50.6
Total 4,781 100
ses
lbw
unemp
magegrp
sex
marital
smokgrp
bmigrp mhtgrp
mwtgrp
ethnic
hyper
pagegrp
Note: Descriptive Details of Categorical Variables in terms of Frequency & Percentage
6
⊘ This is a preview!⊘
Do you want full access?
Subscribe today to unlock all pages.
Trusted by 1+ million students worldwide
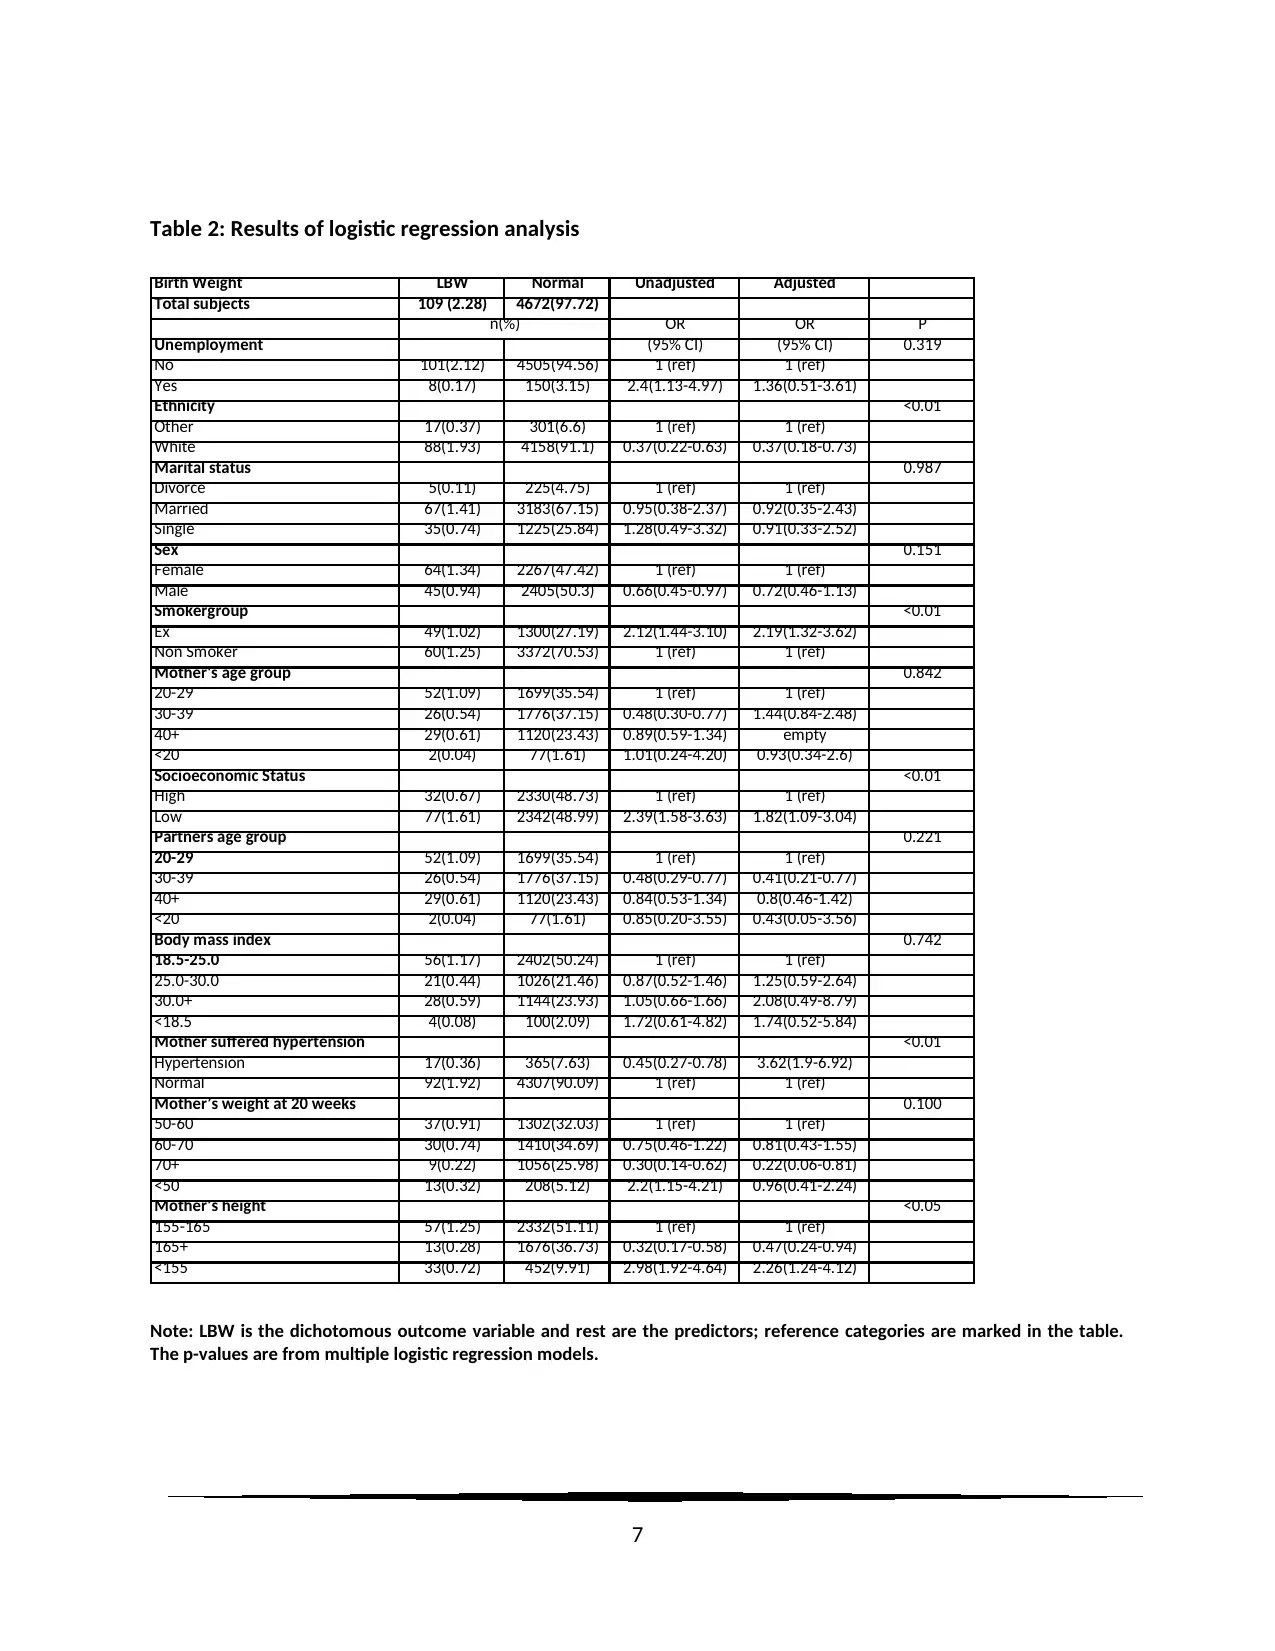
Table 2: Results of logistic regression analysis
Birth Weight LBW Normal Unadjusted Adjusted
Total subjects 109 (2.28) 4672(97.72)
OR OR P
Unemployment (95% CI) (95% CI) 0.319
No 101(2.12) 4505(94.56) 1 (ref) 1 (ref)
Yes 8(0.17) 150(3.15) 2.4(1.13-4.97) 1.36(0.51-3.61)
Ethnicity <0.01
Other 17(0.37) 301(6.6) 1 (ref) 1 (ref)
White 88(1.93) 4158(91.1) 0.37(0.22-0.63) 0.37(0.18-0.73)
Marital status 0.987
Divorce 5(0.11) 225(4.75) 1 (ref) 1 (ref)
Married 67(1.41) 3183(67.15) 0.95(0.38-2.37) 0.92(0.35-2.43)
Single 35(0.74) 1225(25.84) 1.28(0.49-3.32) 0.91(0.33-2.52)
Sex 0.151
Female 64(1.34) 2267(47.42) 1 (ref) 1 (ref)
Male 45(0.94) 2405(50.3) 0.66(0.45-0.97) 0.72(0.46-1.13)
Smokergroup <0.01
Ex 49(1.02) 1300(27.19) 2.12(1.44-3.10) 2.19(1.32-3.62)
Non Smoker 60(1.25) 3372(70.53) 1 (ref) 1 (ref)
Mother's age group 0.842
20-29 52(1.09) 1699(35.54) 1 (ref) 1 (ref)
30-39 26(0.54) 1776(37.15) 0.48(0.30-0.77) 1.44(0.84-2.48)
40+ 29(0.61) 1120(23.43) 0.89(0.59-1.34) empty
<20 2(0.04) 77(1.61) 1.01(0.24-4.20) 0.93(0.34-2.6)
Socioeconomic Status <0.01
High 32(0.67) 2330(48.73) 1 (ref) 1 (ref)
Low 77(1.61) 2342(48.99) 2.39(1.58-3.63) 1.82(1.09-3.04)
Partners age group 0.221
20-29 52(1.09) 1699(35.54) 1 (ref) 1 (ref)
30-39 26(0.54) 1776(37.15) 0.48(0.29-0.77) 0.41(0.21-0.77)
40+ 29(0.61) 1120(23.43) 0.84(0.53-1.34) 0.8(0.46-1.42)
<20 2(0.04) 77(1.61) 0.85(0.20-3.55) 0.43(0.05-3.56)
Body mass index 0.742
18.5-25.0 56(1.17) 2402(50.24) 1 (ref) 1 (ref)
25.0-30.0 21(0.44) 1026(21.46) 0.87(0.52-1.46) 1.25(0.59-2.64)
30.0+ 28(0.59) 1144(23.93) 1.05(0.66-1.66) 2.08(0.49-8.79)
<18.5 4(0.08) 100(2.09) 1.72(0.61-4.82) 1.74(0.52-5.84)
Mother suffered hypertension <0.01
Hypertension 17(0.36) 365(7.63) 0.45(0.27-0.78) 3.62(1.9-6.92)
Normal 92(1.92) 4307(90.09) 1 (ref) 1 (ref)
Mother’s weight at 20 weeks 0.100
50-60 37(0.91) 1302(32.03) 1 (ref) 1 (ref)
60-70 30(0.74) 1410(34.69) 0.75(0.46-1.22) 0.81(0.43-1.55)
70+ 9(0.22) 1056(25.98) 0.30(0.14-0.62) 0.22(0.06-0.81)
<50 13(0.32) 208(5.12) 2.2(1.15-4.21) 0.96(0.41-2.24)
Mother’s height <0.05
155-165 57(1.25) 2332(51.11) 1 (ref) 1 (ref)
165+ 13(0.28) 1676(36.73) 0.32(0.17-0.58) 0.47(0.24-0.94)
<155 33(0.72) 452(9.91) 2.98(1.92-4.64) 2.26(1.24-4.12)
n(%)
Note: LBW is the dichotomous outcome variable and rest are the predictors; reference categories are marked in the table.
The p-values are from multiple logistic regression models.
7
Paraphrase This Document
Need a fresh take? Get an instant paraphrase of this document with our AI Paraphraser
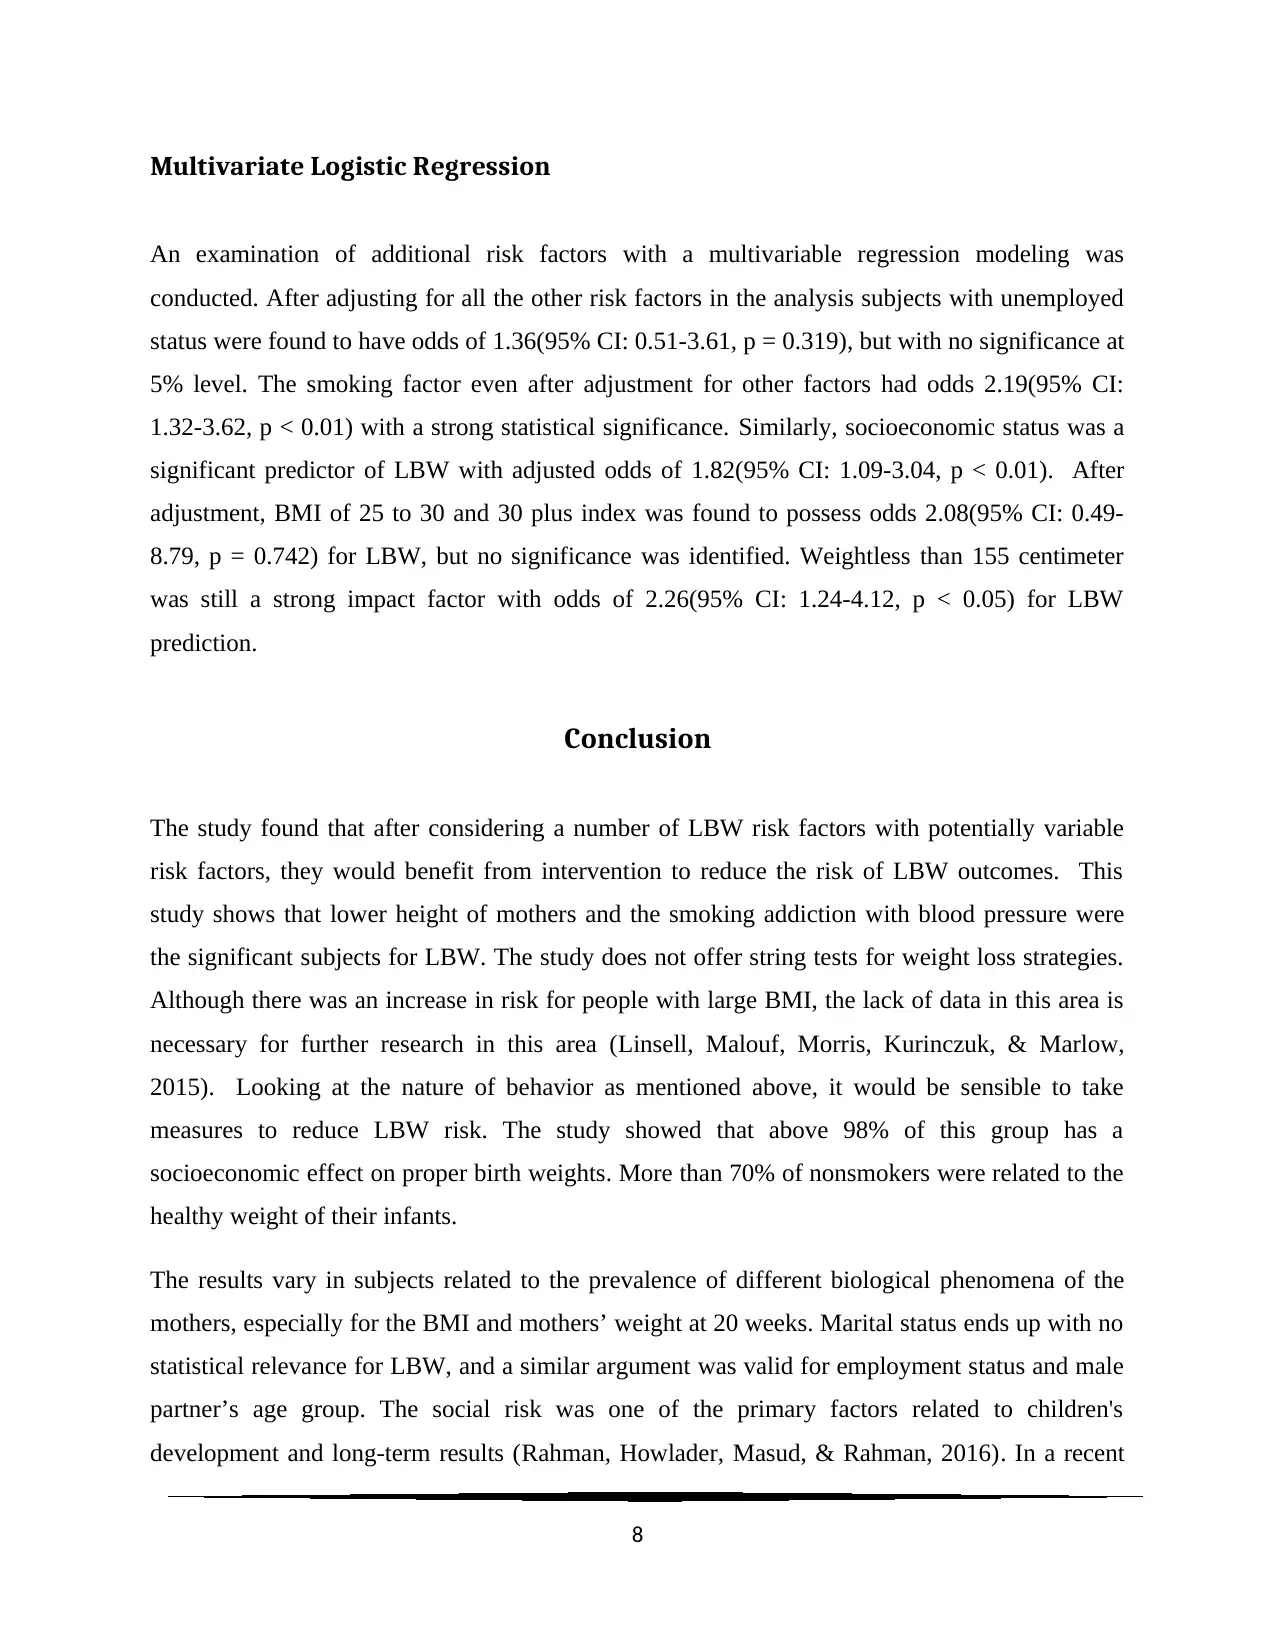
Multivariate Logistic Regression
An examination of additional risk factors with a multivariable regression modeling was
conducted. After adjusting for all the other risk factors in the analysis subjects with unemployed
status were found to have odds of 1.36(95% CI: 0.51-3.61, p = 0.319), but with no significance at
5% level. The smoking factor even after adjustment for other factors had odds 2.19(95% CI:
1.32-3.62, p < 0.01) with a strong statistical significance. Similarly, socioeconomic status was a
significant predictor of LBW with adjusted odds of 1.82(95% CI: 1.09-3.04, p < 0.01). After
adjustment, BMI of 25 to 30 and 30 plus index was found to possess odds 2.08(95% CI: 0.49-
8.79, p = 0.742) for LBW, but no significance was identified. Weightless than 155 centimeter
was still a strong impact factor with odds of 2.26(95% CI: 1.24-4.12, p < 0.05) for LBW
prediction.
Conclusion
The study found that after considering a number of LBW risk factors with potentially variable
risk factors, they would benefit from intervention to reduce the risk of LBW outcomes. This
study shows that lower height of mothers and the smoking addiction with blood pressure were
the significant subjects for LBW. The study does not offer string tests for weight loss strategies.
Although there was an increase in risk for people with large BMI, the lack of data in this area is
necessary for further research in this area (Linsell, Malouf, Morris, Kurinczuk, & Marlow,
2015). Looking at the nature of behavior as mentioned above, it would be sensible to take
measures to reduce LBW risk. The study showed that above 98% of this group has a
socioeconomic effect on proper birth weights. More than 70% of nonsmokers were related to the
healthy weight of their infants.
The results vary in subjects related to the prevalence of different biological phenomena of the
mothers, especially for the BMI and mothers’ weight at 20 weeks. Marital status ends up with no
statistical relevance for LBW, and a similar argument was valid for employment status and male
partner’s age group. The social risk was one of the primary factors related to children's
development and long-term results (Rahman, Howlader, Masud, & Rahman, 2016). In a recent
8
review, the mother's education has been found related to the issue of lower birth weights in
infants.
Limitation
There is less evidence that infant mortality treatment will lead to serious LBW consequences, but
of course, this would benefit individual subjects. However, the social, as well as demographic
variables are linked and their interaction effects have not been assessed. The two or three way
interaction effects of odds in favor or against the lower birth weight of infants. Also, external
factors such as availability of economic facilities or geographical location of mothers were not
considered in the study. a longitudinal study in more than one city could yield an interesting
result in future study.
References
Broman, S. H., Nichols, P. L., & Kennedy, W. A. (2017). Preschool IQ: Prenatal and early
developmental correlates. Routledge.
Demelash, H., Motbainor, A., Nigatu, D., Gashaw, K., & Melese, A. (2015). Risk factors for low
birth weight in Bale zone hospitals, South-East Ethiopia: a case-control study. BMC pregnancy
and childbirth, 15(1), 264.
Doyle, L.W., Cheong, J.L., Burnett, A., Roberts, G., Lee, K.J., Anderson, P.J. and Victorian
Infant Collaborative Study Group, 2015. Biological and social influences on outcomes of
extreme-preterm/low-birth-weight adolescents. Pediatrics, 136(6), pp.e1513-e1520.
Linsell, L., Malouf, R., Morris, J., Kurinczuk, J. J., & Marlow, N. (2015). Prognostic factors for
poor cognitive development in children born very preterm or with very low birth weight: a
systematic review. JAMA Pediatrics, 169(12), 1162-1172.
Rahman, M. S., Howlader, T., Masud, M. S., & Rahman, M. L. (2016). Association of low-birth-
weight with malnutrition in children under five years in Bangladesh: do mother's education,
socio-economic status, and birth interval matter?. PloS one, 11(6), e0157814.
9
⊘ This is a preview!⊘
Do you want full access?
Subscribe today to unlock all pages.
Trusted by 1+ million students worldwide
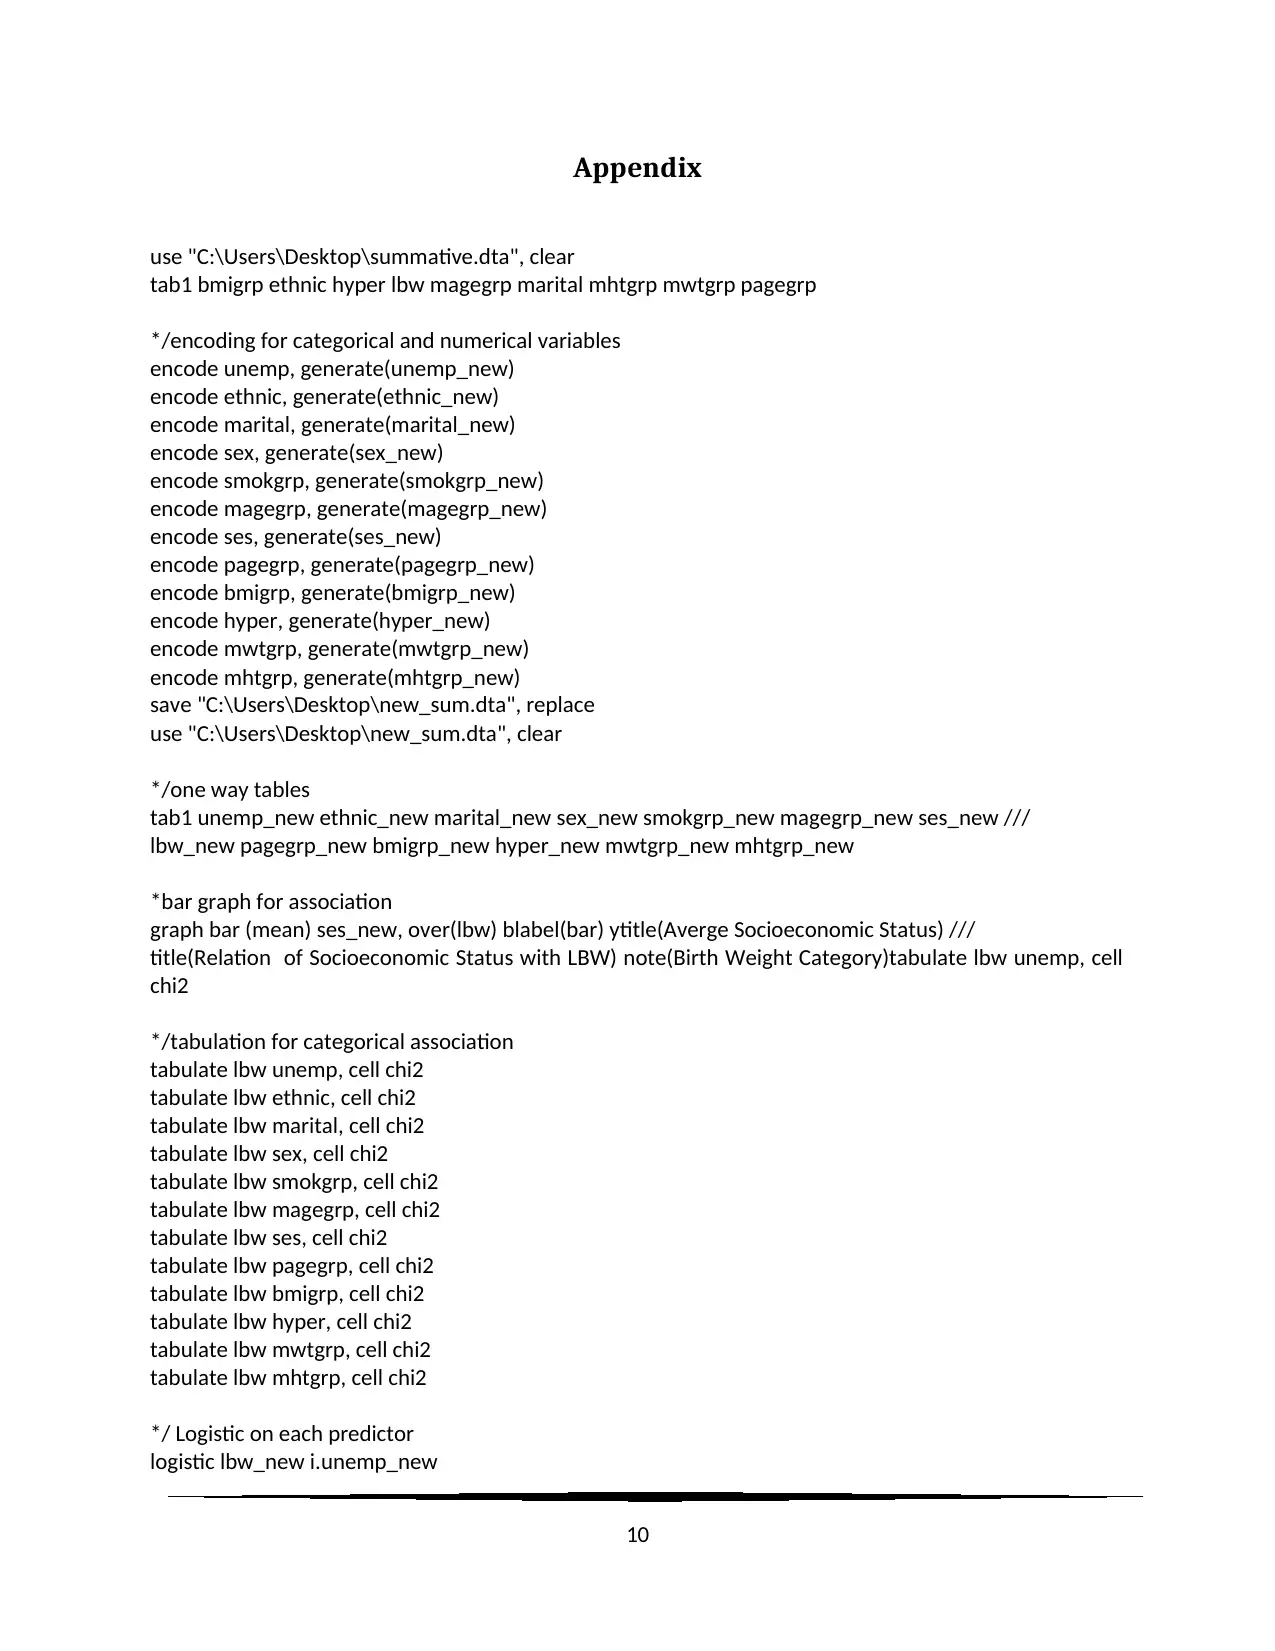
Appendix
use "C:\Users\Desktop\summative.dta", clear
tab1 bmigrp ethnic hyper lbw magegrp marital mhtgrp mwtgrp pagegrp
*/encoding for categorical and numerical variables
encode unemp, generate(unemp_new)
encode ethnic, generate(ethnic_new)
encode marital, generate(marital_new)
encode sex, generate(sex_new)
encode smokgrp, generate(smokgrp_new)
encode magegrp, generate(magegrp_new)
encode ses, generate(ses_new)
encode pagegrp, generate(pagegrp_new)
encode bmigrp, generate(bmigrp_new)
encode hyper, generate(hyper_new)
encode mwtgrp, generate(mwtgrp_new)
encode mhtgrp, generate(mhtgrp_new)
save "C:\Users\Desktop\new_sum.dta", replace
use "C:\Users\Desktop\new_sum.dta", clear
*/one way tables
tab1 unemp_new ethnic_new marital_new sex_new smokgrp_new magegrp_new ses_new ///
lbw_new pagegrp_new bmigrp_new hyper_new mwtgrp_new mhtgrp_new
*bar graph for association
graph bar (mean) ses_new, over(lbw) blabel(bar) ytitle(Averge Socioeconomic Status) ///
title(Relation of Socioeconomic Status with LBW) note(Birth Weight Category)tabulate lbw unemp, cell
chi2
*/tabulation for categorical association
tabulate lbw unemp, cell chi2
tabulate lbw ethnic, cell chi2
tabulate lbw marital, cell chi2
tabulate lbw sex, cell chi2
tabulate lbw smokgrp, cell chi2
tabulate lbw magegrp, cell chi2
tabulate lbw ses, cell chi2
tabulate lbw pagegrp, cell chi2
tabulate lbw bmigrp, cell chi2
tabulate lbw hyper, cell chi2
tabulate lbw mwtgrp, cell chi2
tabulate lbw mhtgrp, cell chi2
*/ Logistic on each predictor
logistic lbw_new i.unemp_new
10
Paraphrase This Document
Need a fresh take? Get an instant paraphrase of this document with our AI Paraphraser
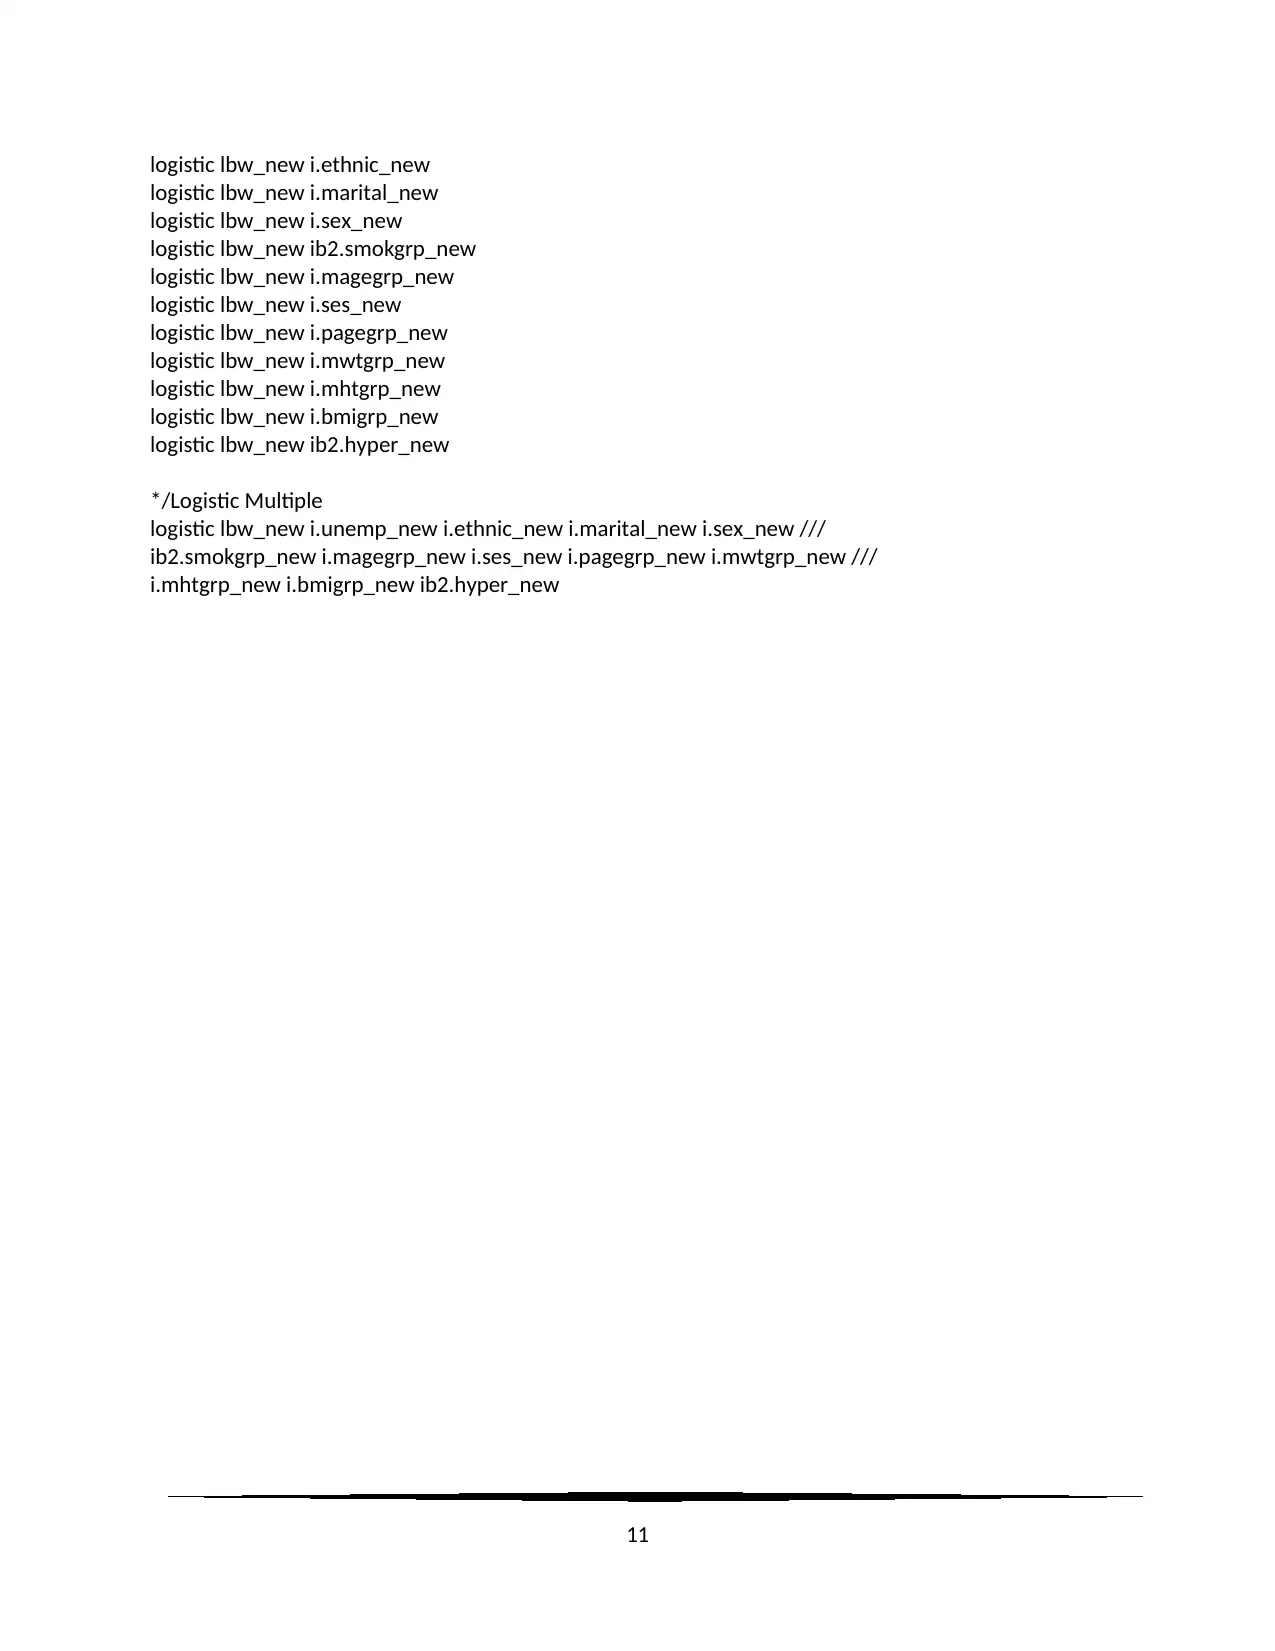
logistic lbw_new i.ethnic_new
logistic lbw_new i.marital_new
logistic lbw_new i.sex_new
logistic lbw_new ib2.smokgrp_new
logistic lbw_new i.magegrp_new
logistic lbw_new i.ses_new
logistic lbw_new i.pagegrp_new
logistic lbw_new i.mwtgrp_new
logistic lbw_new i.mhtgrp_new
logistic lbw_new i.bmigrp_new
logistic lbw_new ib2.hyper_new
*/Logistic Multiple
logistic lbw_new i.unemp_new i.ethnic_new i.marital_new i.sex_new ///
ib2.smokgrp_new i.magegrp_new i.ses_new i.pagegrp_new i.mwtgrp_new ///
i.mhtgrp_new i.bmigrp_new ib2.hyper_new
11
1 out of 11
Related Documents


Your All-in-One AI-Powered Toolkit for Academic Success.
+13062052269
info@desklib.com
Available 24*7 on WhatsApp / Email
![[object Object]](/_next/static/media/star-bottom.7253800d.svg)
Unlock your academic potential
Copyright © 2020–2026 A2Z Services. All Rights Reserved. Developed and managed by ZUCOL.