UTS - IS Development Methodologies: Crinitt Venice Automation Report
VerifiedAdded on 2023/06/12
|15
|3278
|261
Report
AI Summary
This report proposes an automation plan for Crinitt Venice restaurant's ordering process, including a 12-month budget. It addresses the manual ordering system and inventory management issues. Key objectives include preparing a system request form, linking inventory to the ordering process for wastage tracking, and developing a mobile app with exclusive deals. The report identifies stakeholders such as customers, managers, chefs, and waiters. It uses waterfall methodology to finalize requirements, covering automation, tracking inconsistencies, streamlining processes, and app development. The system request form, budget, sales forecast, cash flow, depreciation schedule, and profit and loss forecast are detailed. The balance sheet projects the restaurant's financial position with automation. This document is available on Desklib, a platform offering AI-powered study tools and a wide range of academic resources for students.
Running head: INFORMATION SYSTEM DEVELOPMENT METHODOLOGIES
Information System Development Methodologies
Name of Student:
Name of University:
Author’s Note:
Information System Development Methodologies
Name of Student:
Name of University:
Author’s Note:
Paraphrase This Document
Need a fresh take? Get an instant paraphrase of this document with our AI Paraphraser
1INFORMATION SYSTEM DEVELOPMENT METHODOLOGIES
Table of Contents
Introduction......................................................................................................................................2
Objectives of the Project..................................................................................................................2
Defining the Problem.......................................................................................................................2
Identification of the List of Stakeholders........................................................................................2
Finalizing the requirements for change using waterfall steps.........................................................3
Conclusion.......................................................................................................................................1
References and Bibliography...........................................................................................................2
2INFORMATION SYSTEM DEVELOPMENT METHODOLOGIES
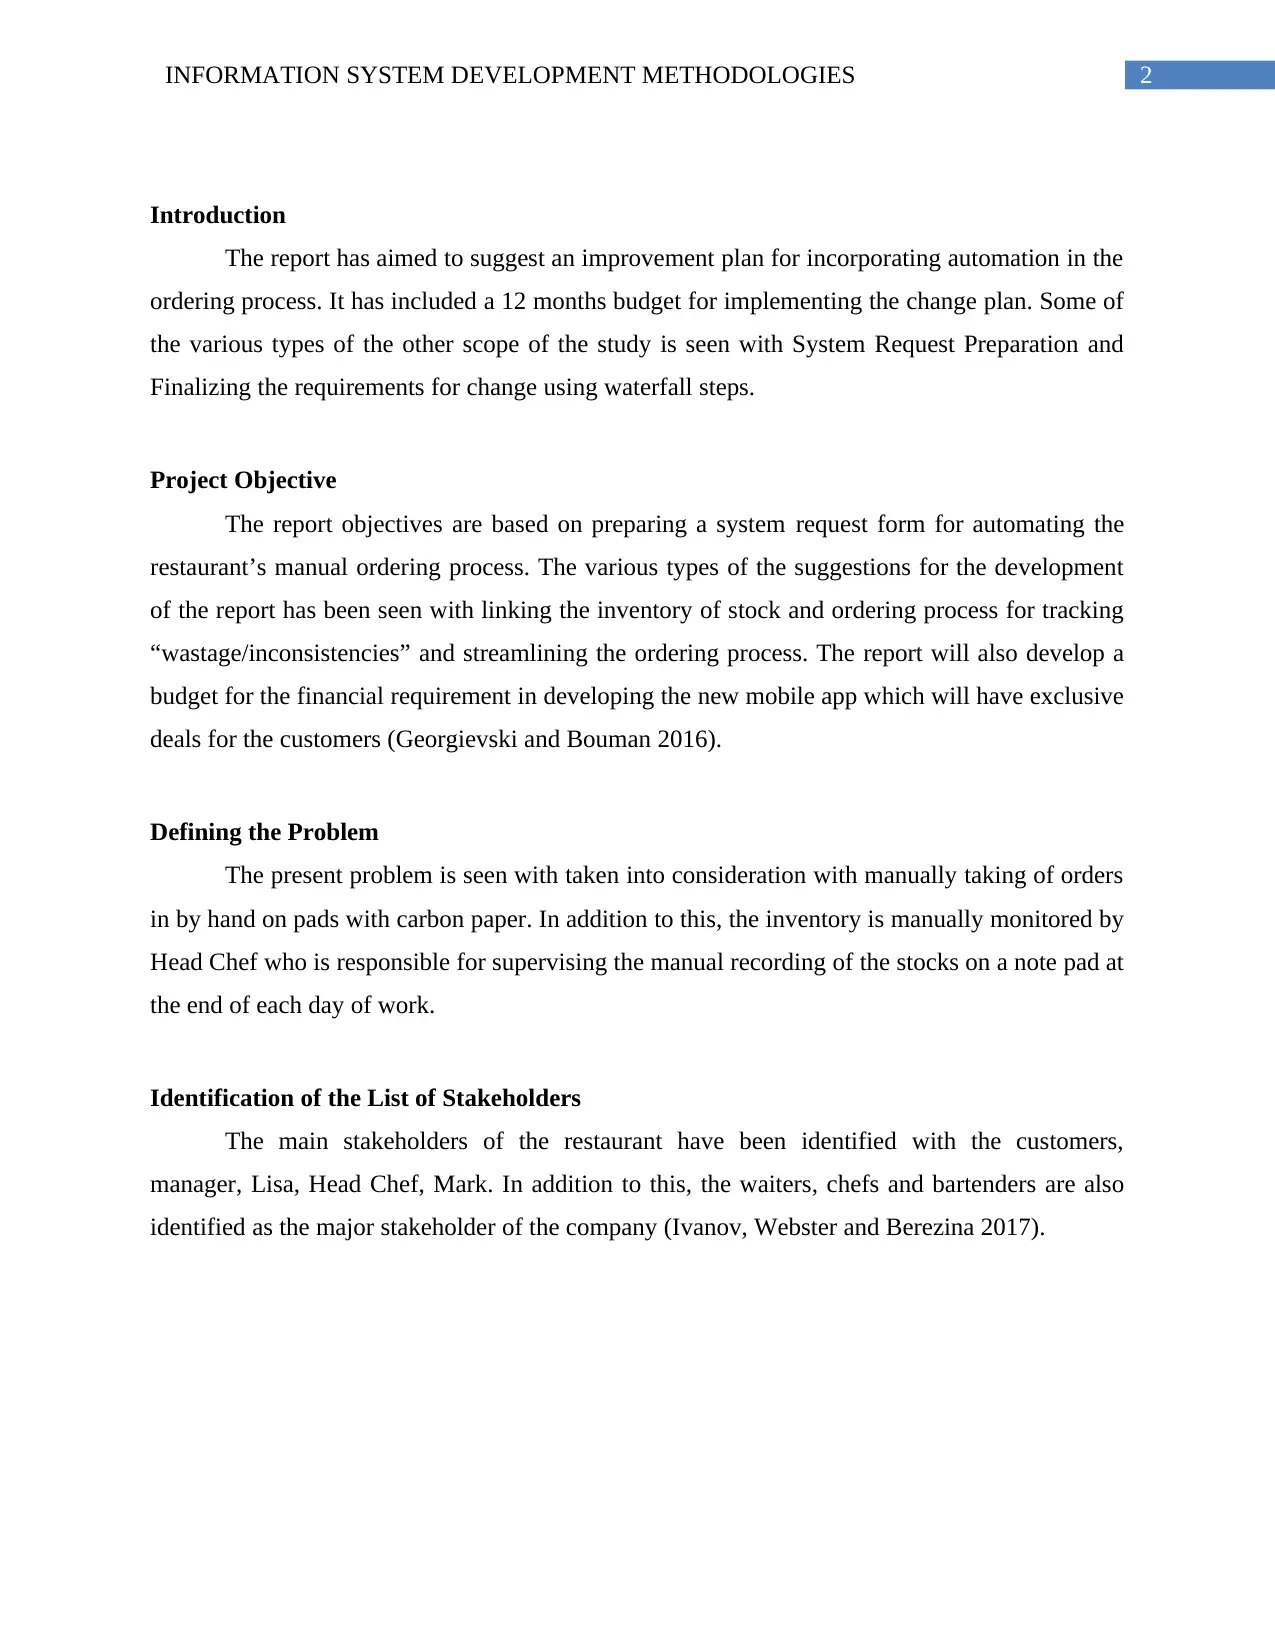
Introduction
The report has aimed to suggest an improvement plan for incorporating automation in the
ordering process. It has included a 12 months budget for implementing the change plan. Some of
the various types of the other scope of the study is seen with System Request Preparation and
Finalizing the requirements for change using waterfall steps.
Project Objective
The report objectives are based on preparing a system request form for automating the
restaurant’s manual ordering process. The various types of the suggestions for the development
of the report has been seen with linking the inventory of stock and ordering process for tracking
“wastage/inconsistencies” and streamlining the ordering process. The report will also develop a
budget for the financial requirement in developing the new mobile app which will have exclusive
deals for the customers (Georgievski and Bouman 2016).
Defining the Problem
The present problem is seen with taken into consideration with manually taking of orders
in by hand on pads with carbon paper. In addition to this, the inventory is manually monitored by
Head Chef who is responsible for supervising the manual recording of the stocks on a note pad at
the end of each day of work.
Identification of the List of Stakeholders
The main stakeholders of the restaurant have been identified with the customers,
manager, Lisa, Head Chef, Mark. In addition to this, the waiters, chefs and bartenders are also
identified as the major stakeholder of the company (Ivanov, Webster and Berezina 2017).
⊘ This is a preview!⊘
Do you want full access?
Subscribe today to unlock all pages.
Trusted by 1+ million students worldwide
3INFORMATION SYSTEM DEVELOPMENT METHODOLOGIES
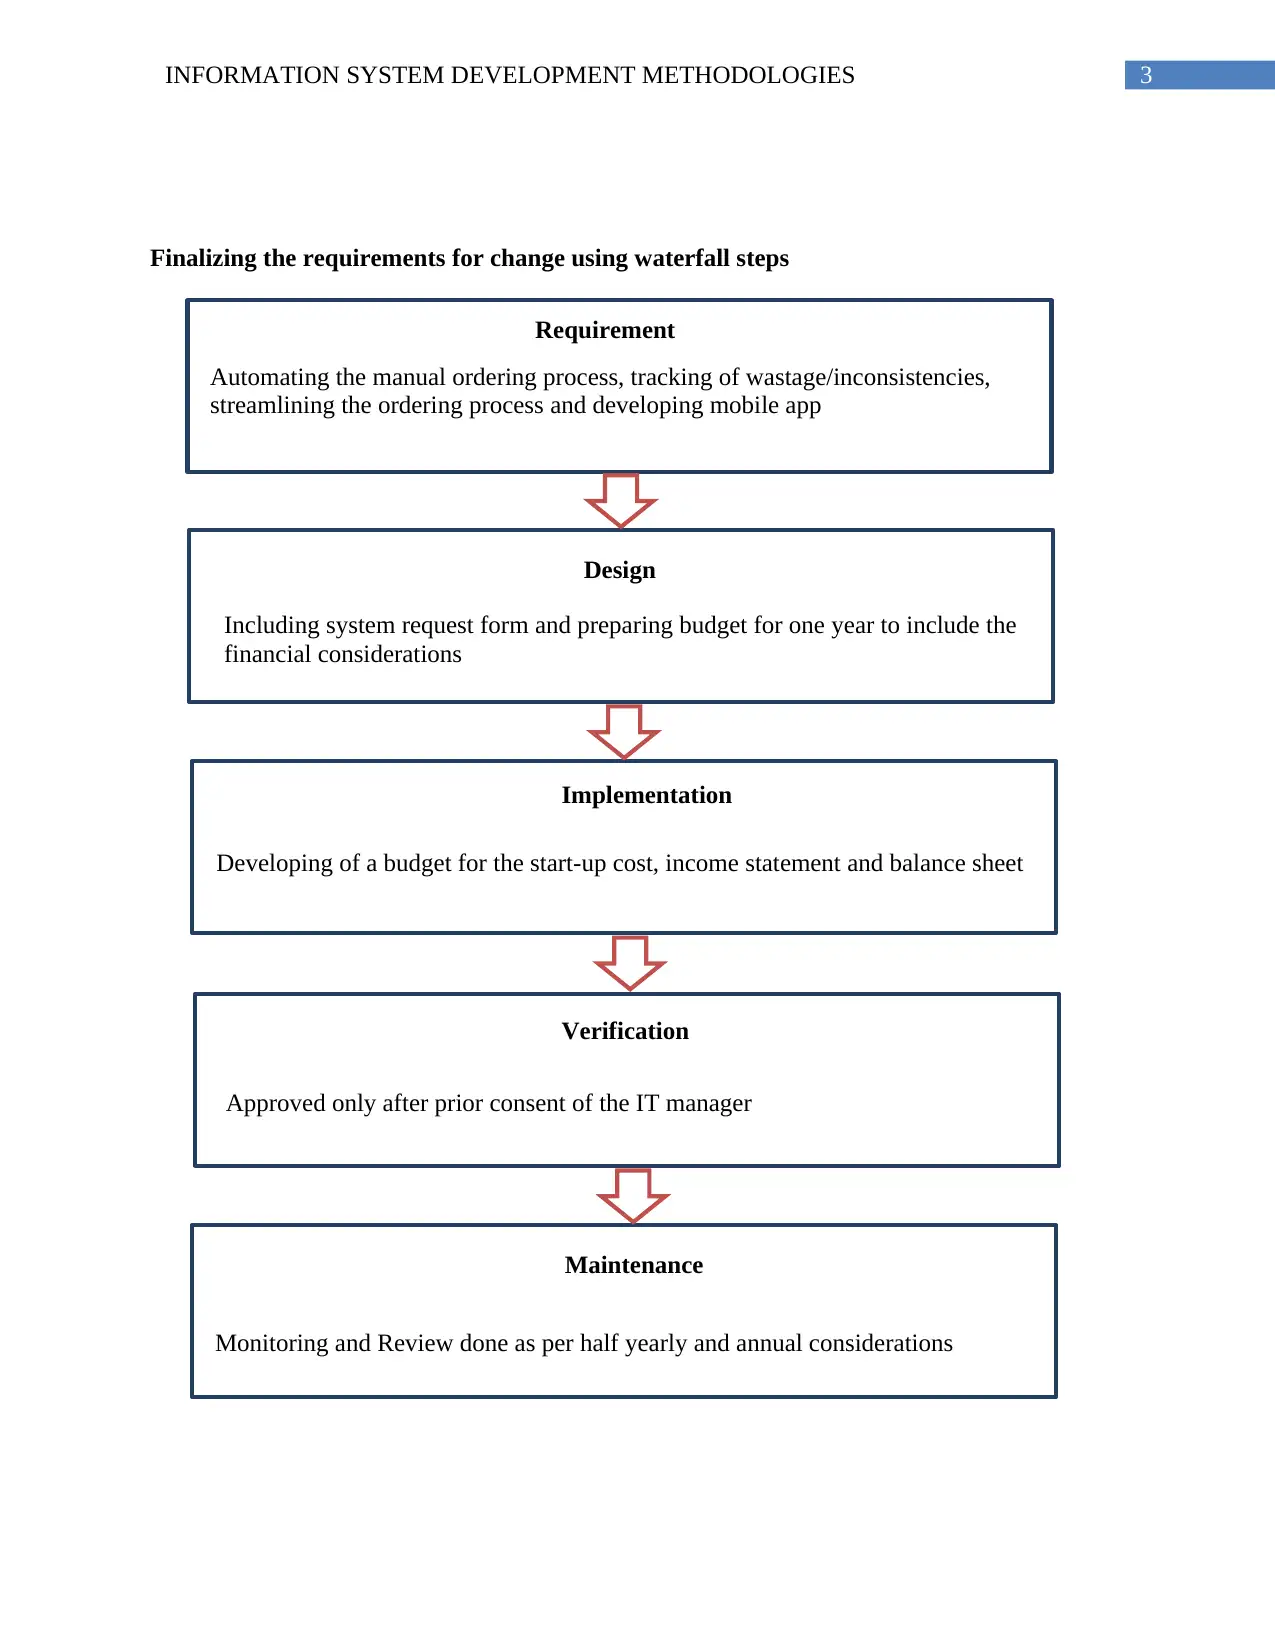
Requirement
Automating the manual ordering process, tracking of wastage/inconsistencies,
streamlining the ordering process and developing mobile app
Design
Including system request form and preparing budget for one year to include the
financial considerations
Implementation
Developing of a budget for the start-up cost, income statement and balance sheet
Verification
Approved only after prior consent of the IT manager
Monitoring and Review done as per half yearly and annual considerations
Maintenance
Finalizing the requirements for change using waterfall steps
Paraphrase This Document
Need a fresh take? Get an instant paraphrase of this document with our AI Paraphraser
4INFORMATION SYSTEM DEVELOPMENT METHODOLOGIES
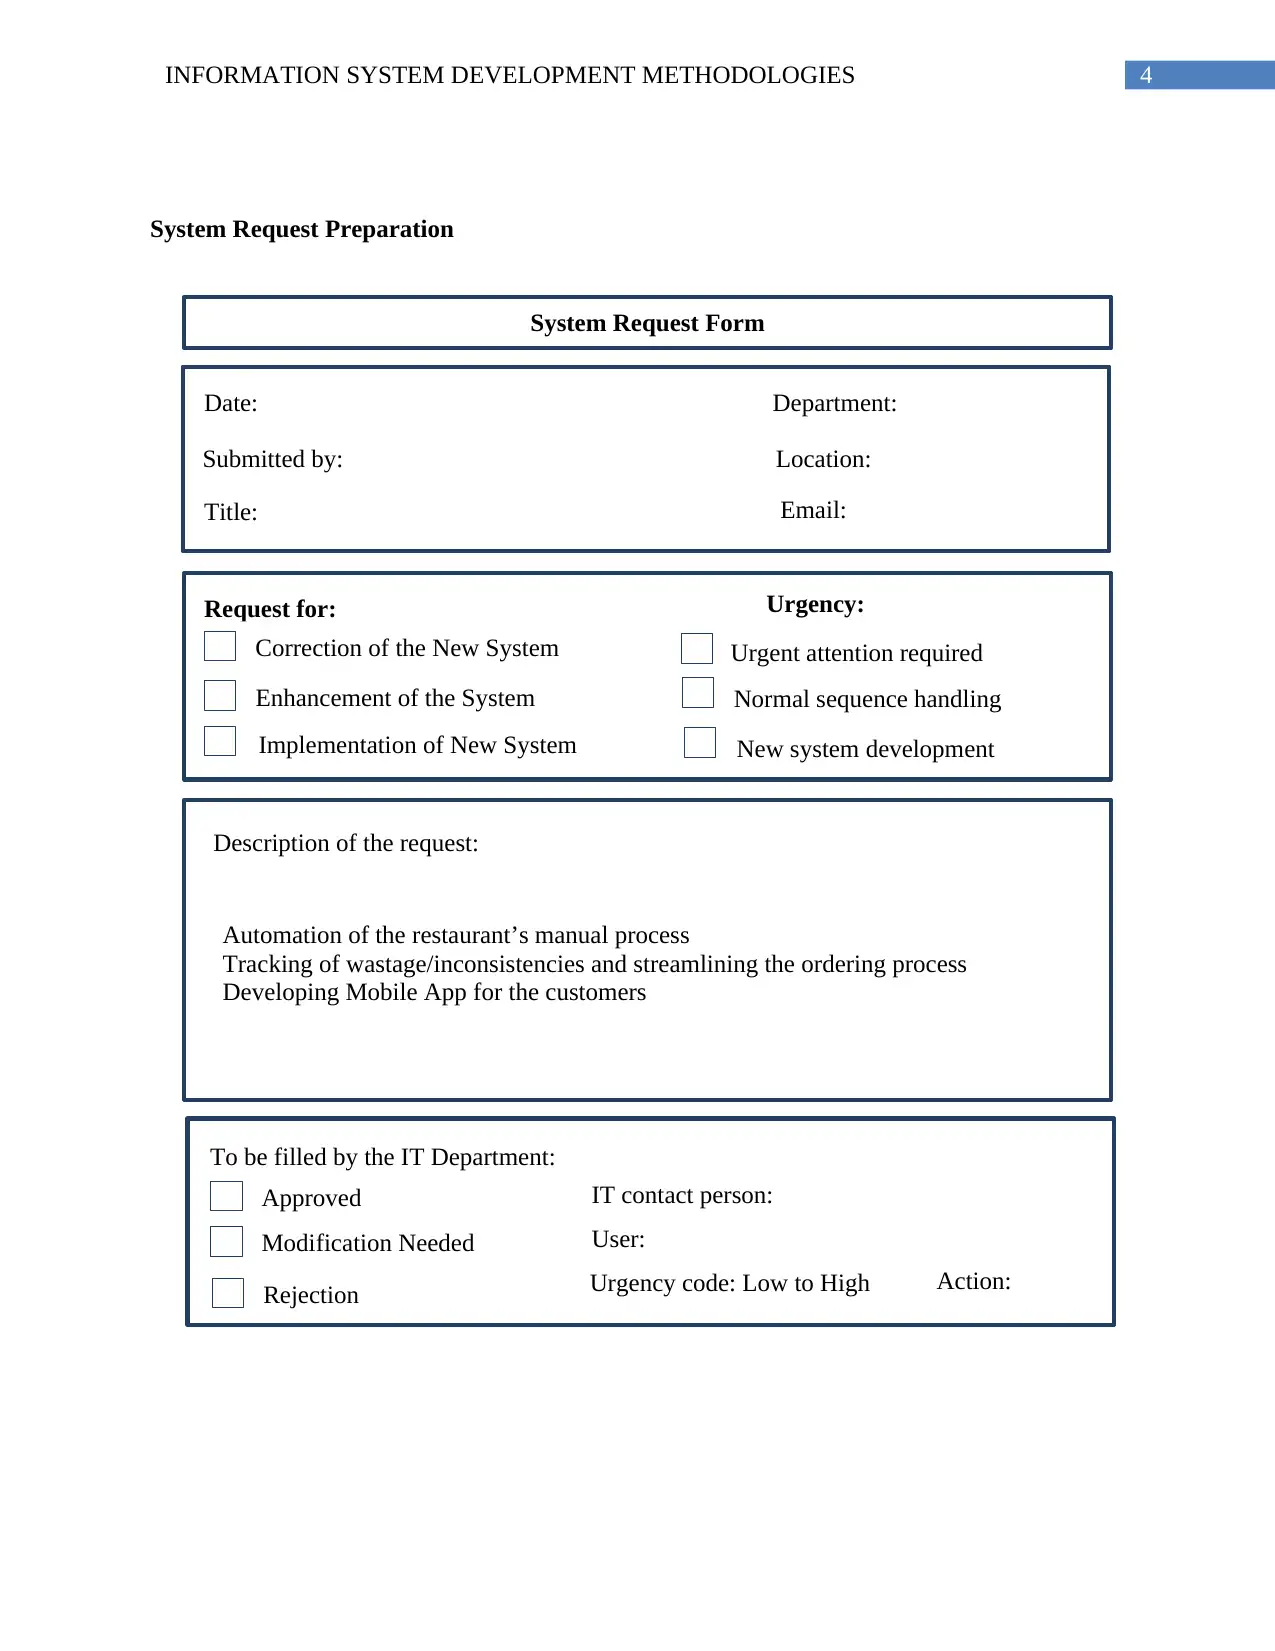
System Request Form
Date:
Submitted by:
Title:
Department:
Location:
Email:
Request for:
Correction of the New System
Enhancement of the System
Implementation of New System
Urgency:
Urgent attention required
Normal sequence handling
New system development
Description of the request:
Automation of the restaurant’s manual process
Tracking of wastage/inconsistencies and streamlining the ordering process
Developing Mobile App for the customers
To be filled by the IT Department:
Approved
Modification Needed
Rejection
IT contact person:
User:
Urgency code: Low to High Action:
System Request Preparation
5INFORMATION SYSTEM DEVELOPMENT METHODOLOGIES
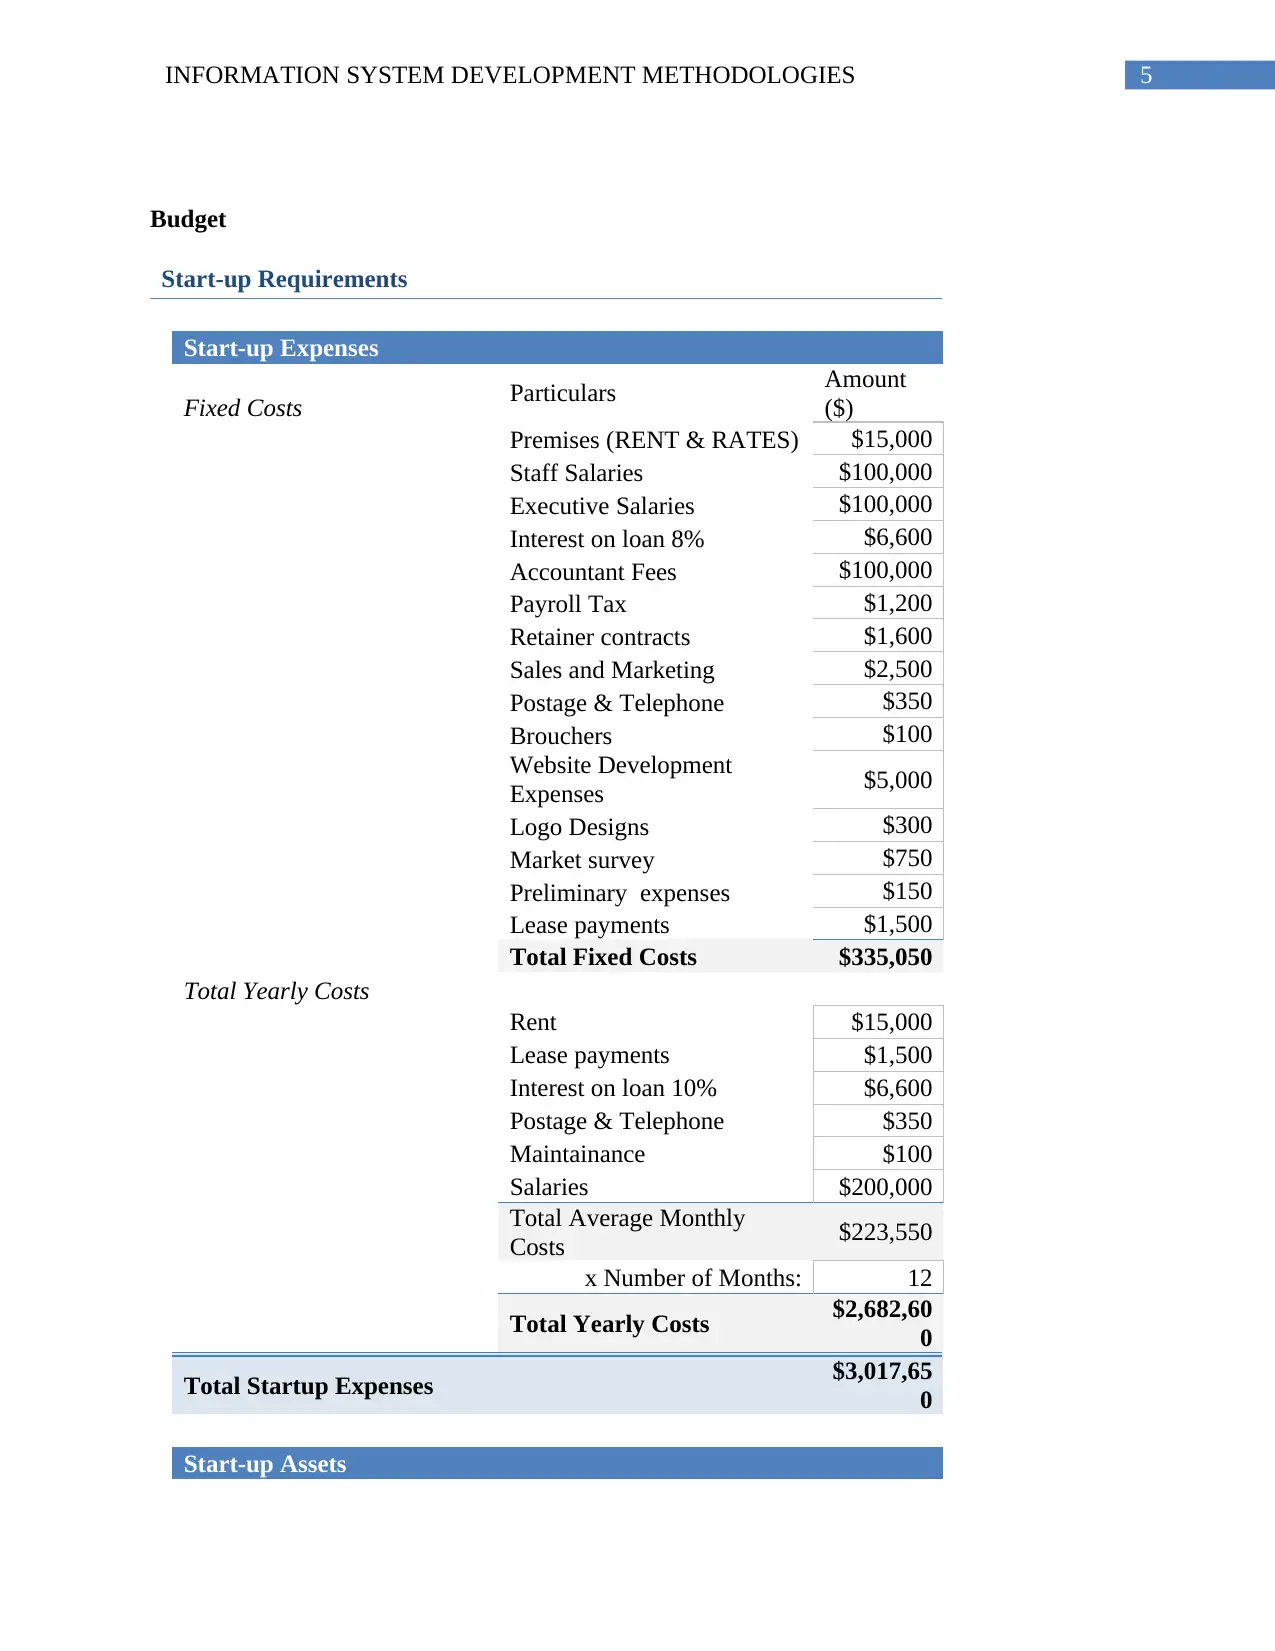
Budget
Start-up Requirements
Start-up Expenses
Fixed Costs Particulars Amount
($)
Premises (RENT & RATES) $15,000
Staff Salaries $100,000
Executive Salaries $100,000
Interest on loan 8% $6,600
Accountant Fees $100,000
Payroll Tax $1,200
Retainer contracts $1,600
Sales and Marketing $2,500
Postage & Telephone $350
Brouchers $100
Website Development
Expenses $5,000
Logo Designs $300
Market survey $750
Preliminary expenses $150
Lease payments $1,500
Total Fixed Costs $335,050
Total Yearly Costs
Rent $15,000
Lease payments $1,500
Interest on loan 10% $6,600
Postage & Telephone $350
Maintainance $100
Salaries $200,000
Total Average Monthly
Costs $223,550
x Number of Months: 12
Total Yearly Costs $2,682,60
0
Total Startup Expenses $3,017,65
0
Start-up Assets
⊘ This is a preview!⊘
Do you want full access?
Subscribe today to unlock all pages.
Trusted by 1+ million students worldwide
6INFORMATION SYSTEM DEVELOPMENT METHODOLOGIES
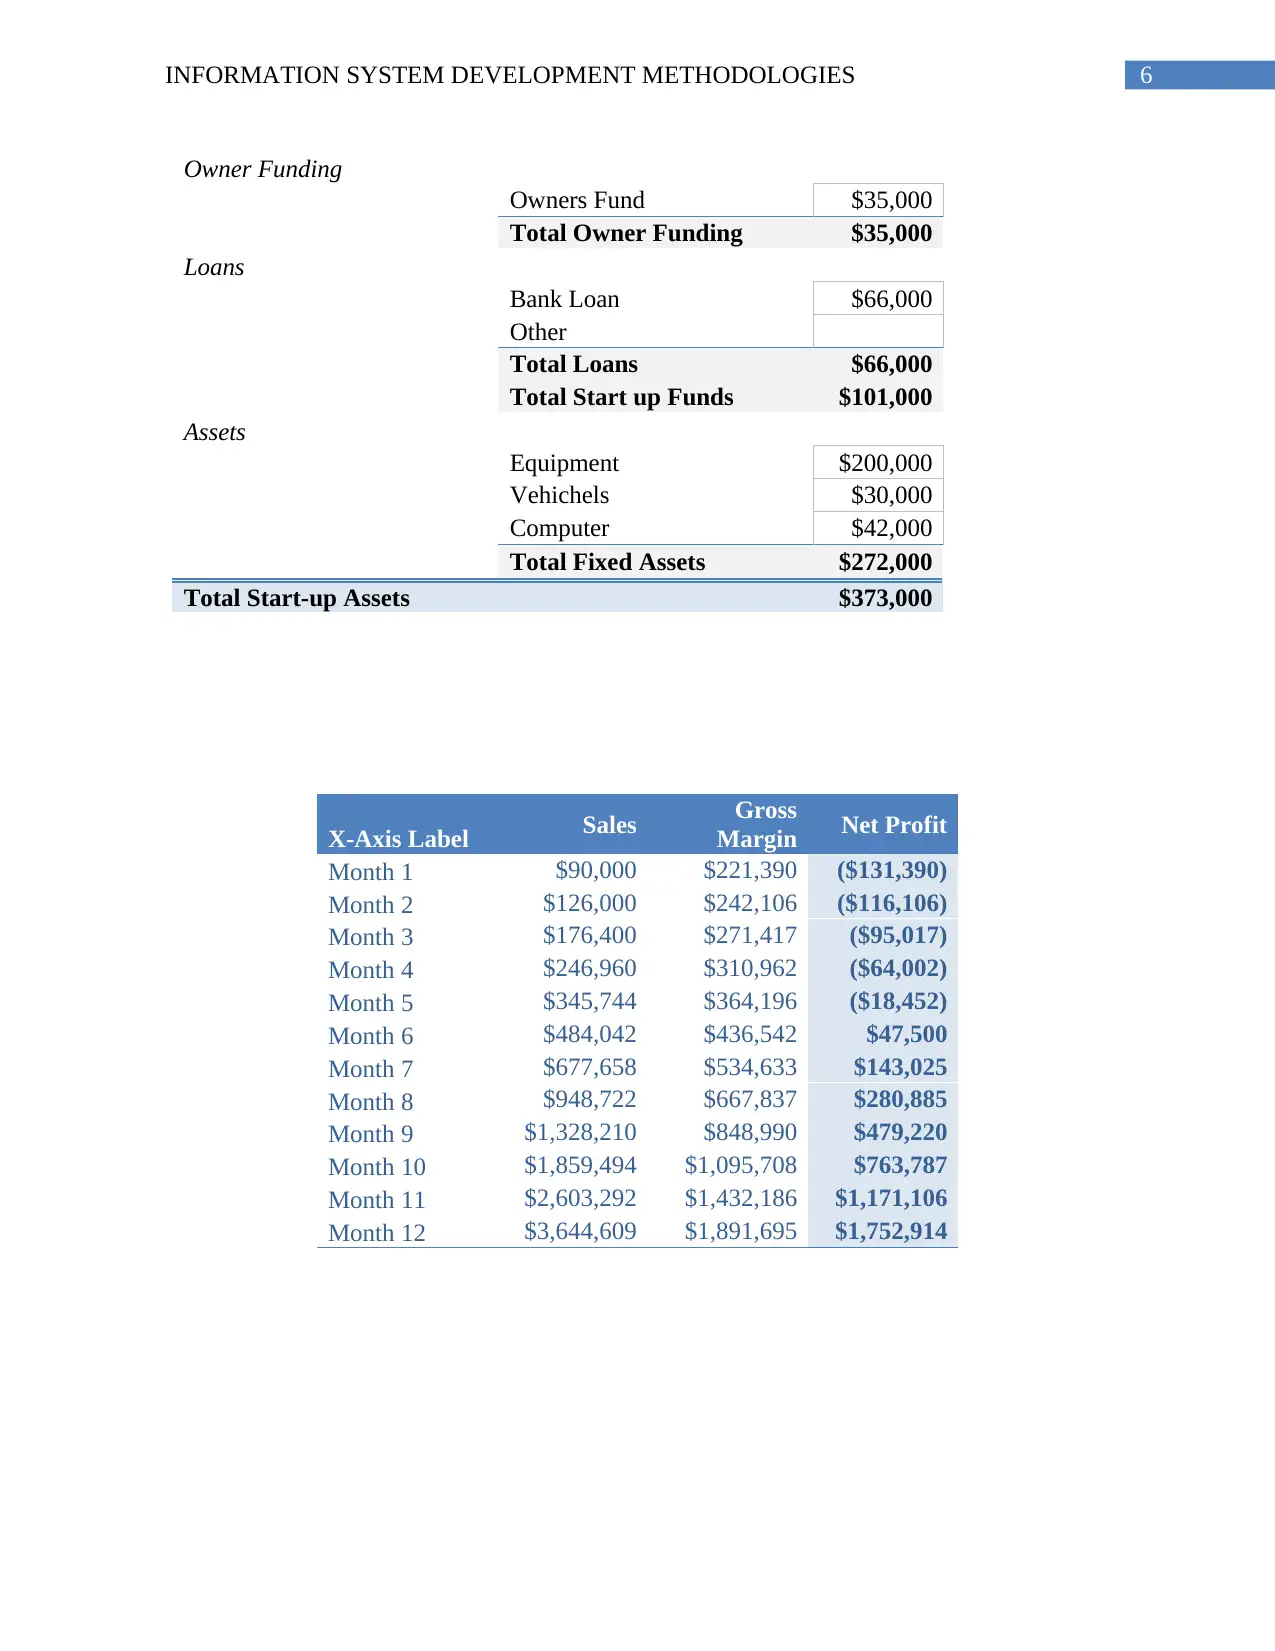
Owner Funding
Owners Fund $35,000
Total Owner Funding $35,000
Loans
Bank Loan $66,000
Other
Total Loans $66,000
Total Start up Funds $101,000
Assets
Equipment $200,000
Vehichels $30,000
Computer $42,000
Total Fixed Assets $272,000
Total Start-up Assets $373,000
X-Axis Label Sales Gross
Margin Net Profit
Month 1 $90,000 $221,390 ($131,390)
Month 2 $126,000 $242,106 ($116,106)
Month 3 $176,400 $271,417 ($95,017)
Month 4 $246,960 $310,962 ($64,002)
Month 5 $345,744 $364,196 ($18,452)
Month 6 $484,042 $436,542 $47,500
Month 7 $677,658 $534,633 $143,025
Month 8 $948,722 $667,837 $280,885
Month 9 $1,328,210 $848,990 $479,220
Month 10 $1,859,494 $1,095,708 $763,787
Month 11 $2,603,292 $1,432,186 $1,171,106
Month 12 $3,644,609 $1,891,695 $1,752,914
Paraphrase This Document
Need a fresh take? Get an instant paraphrase of this document with our AI Paraphraser
0INFORMATION SYSTEM DEVELOPMENT METHODOLOGIES
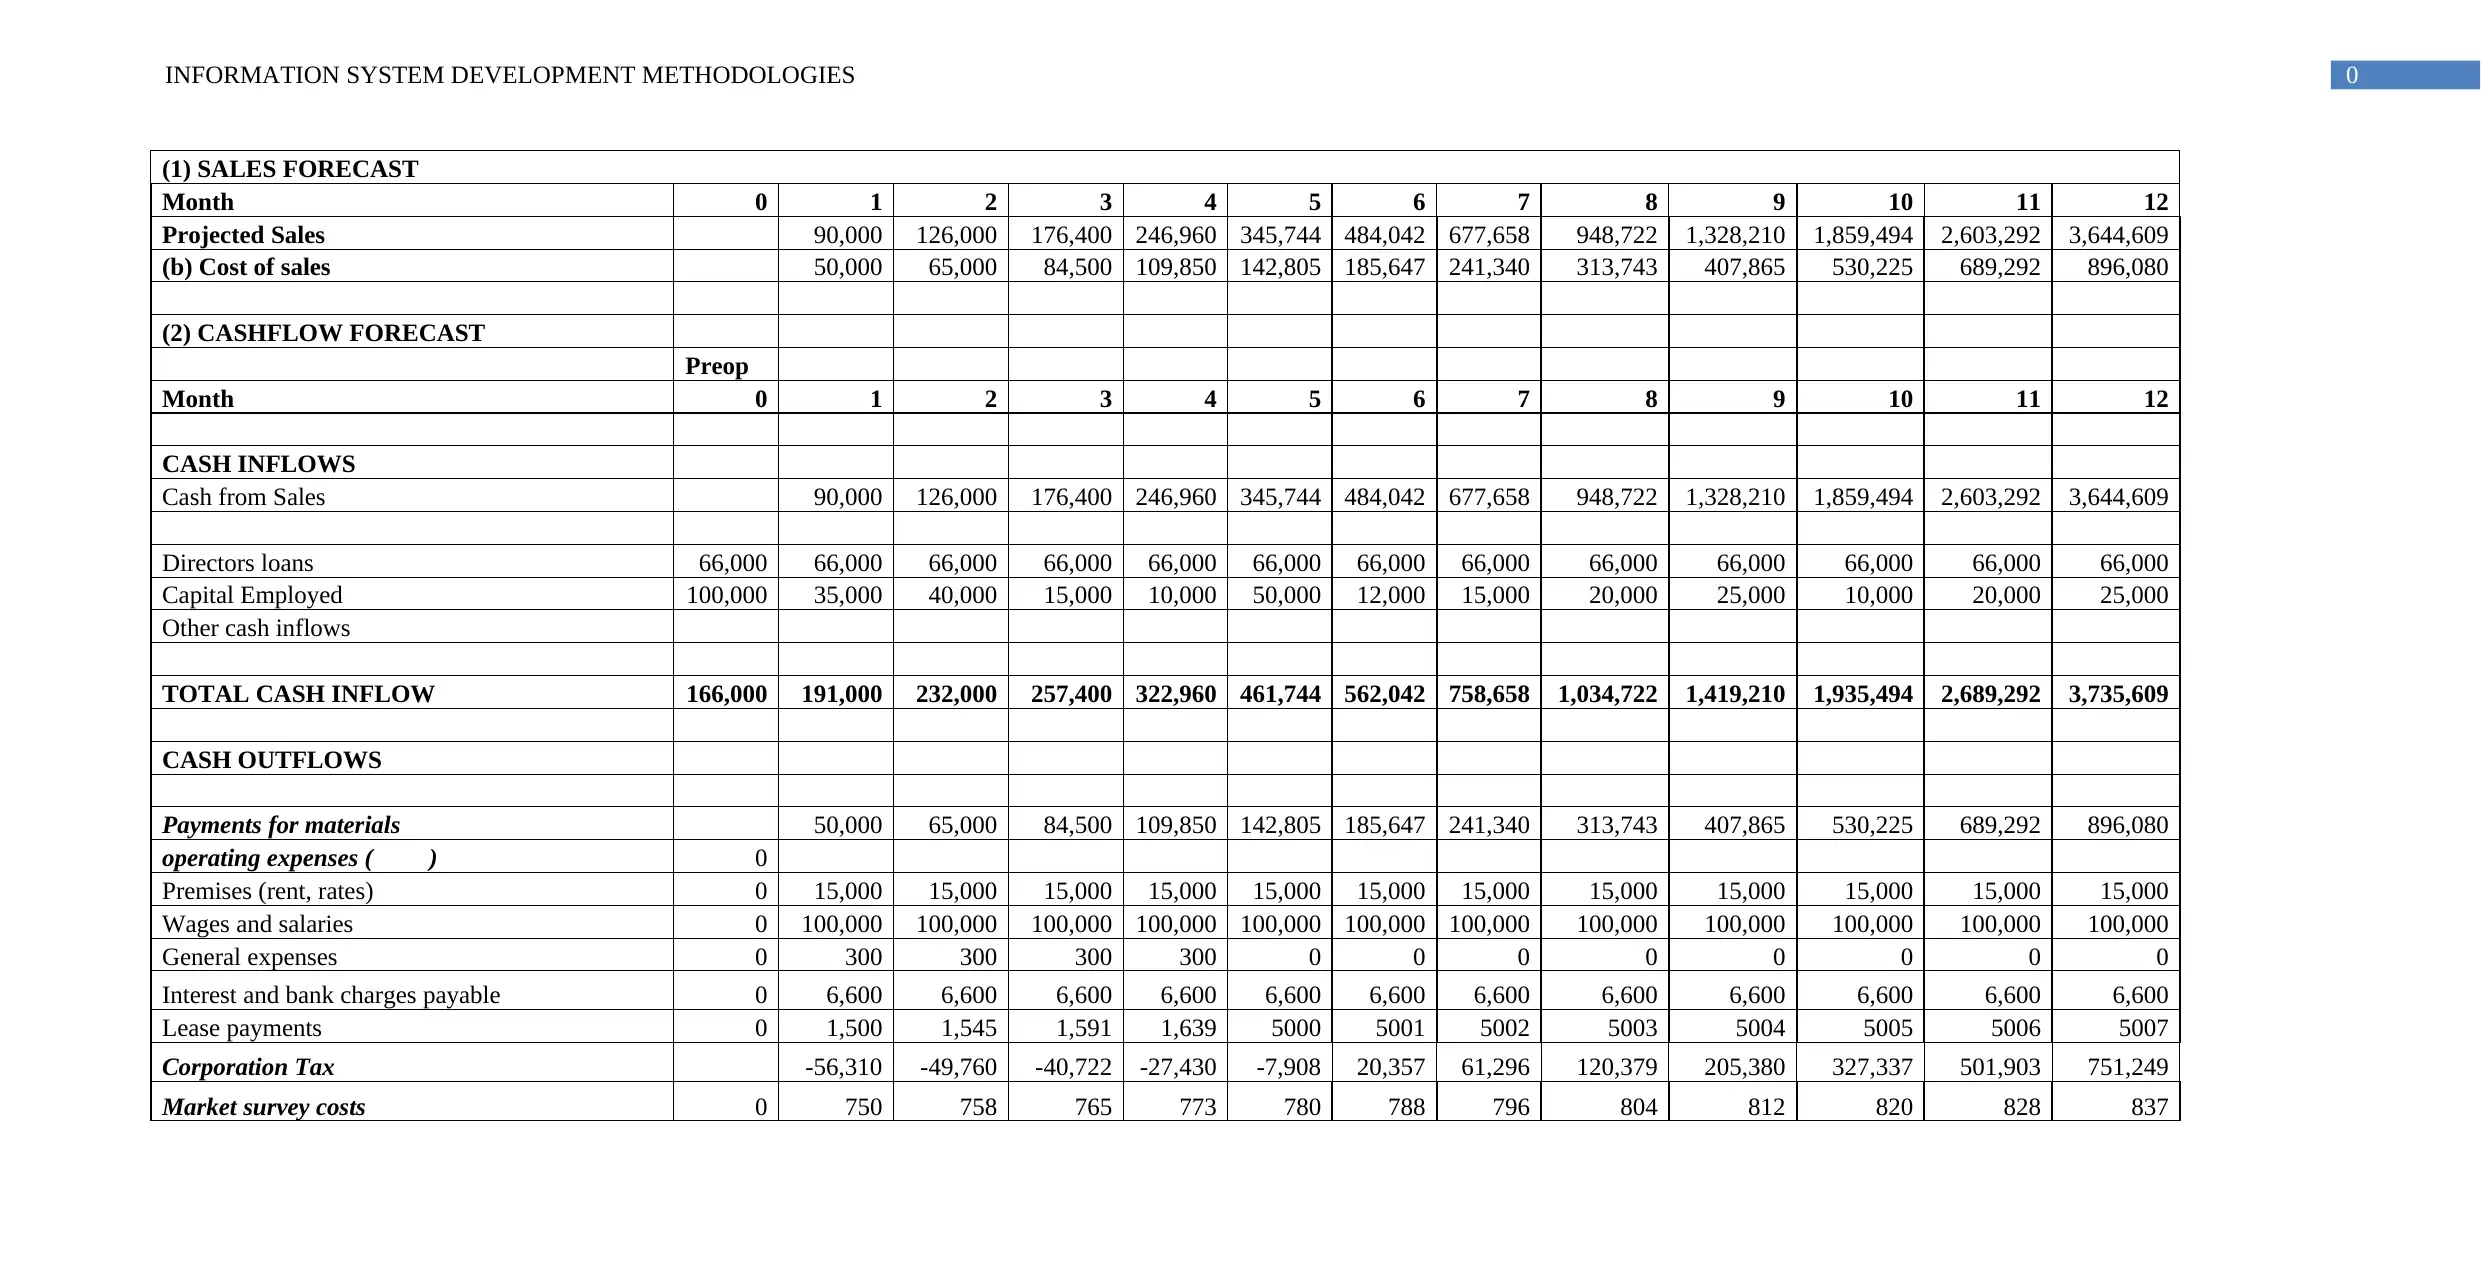
(1) SALES FORECAST
Month 0 1 2 3 4 5 6 7 8 9 10 11 12
Projected Sales 90,000 126,000 176,400 246,960 345,744 484,042 677,658 948,722 1,328,210 1,859,494 2,603,292 3,644,609
(b) Cost of sales 50,000 65,000 84,500 109,850 142,805 185,647 241,340 313,743 407,865 530,225 689,292 896,080
(2) CASHFLOW FORECAST
Preop
Month 0 1 2 3 4 5 6 7 8 9 10 11 12
CASH INFLOWS
Cash from Sales 90,000 126,000 176,400 246,960 345,744 484,042 677,658 948,722 1,328,210 1,859,494 2,603,292 3,644,609
Directors loans 66,000 66,000 66,000 66,000 66,000 66,000 66,000 66,000 66,000 66,000 66,000 66,000 66,000
Capital Employed 100,000 35,000 40,000 15,000 10,000 50,000 12,000 15,000 20,000 25,000 10,000 20,000 25,000
Other cash inflows
TOTAL CASH INFLOW 166,000 191,000 232,000 257,400 322,960 461,744 562,042 758,658 1,034,722 1,419,210 1,935,494 2,689,292 3,735,609
CASH OUTFLOWS
Payments for materials 50,000 65,000 84,500 109,850 142,805 185,647 241,340 313,743 407,865 530,225 689,292 896,080
operating expenses ( ) 0
Premises (rent, rates) 0 15,000 15,000 15,000 15,000 15,000 15,000 15,000 15,000 15,000 15,000 15,000 15,000
Wages and salaries 0 100,000 100,000 100,000 100,000 100,000 100,000 100,000 100,000 100,000 100,000 100,000 100,000
General expenses 0 300 300 300 300 0 0 0 0 0 0 0 0
Interest and bank charges payable 0 6,600 6,600 6,600 6,600 6,600 6,600 6,600 6,600 6,600 6,600 6,600 6,600
Lease payments 0 1,500 1,545 1,591 1,639 5000 5001 5002 5003 5004 5005 5006 5007
Corporation Tax -56,310 -49,760 -40,722 -27,430 -7,908 20,357 61,296 120,379 205,380 327,337 501,903 751,249
Market survey costs 0 750 758 765 773 780 788 796 804 812 820 828 837
1INFORMATION SYSTEM DEVELOPMENT METHODOLOGIES
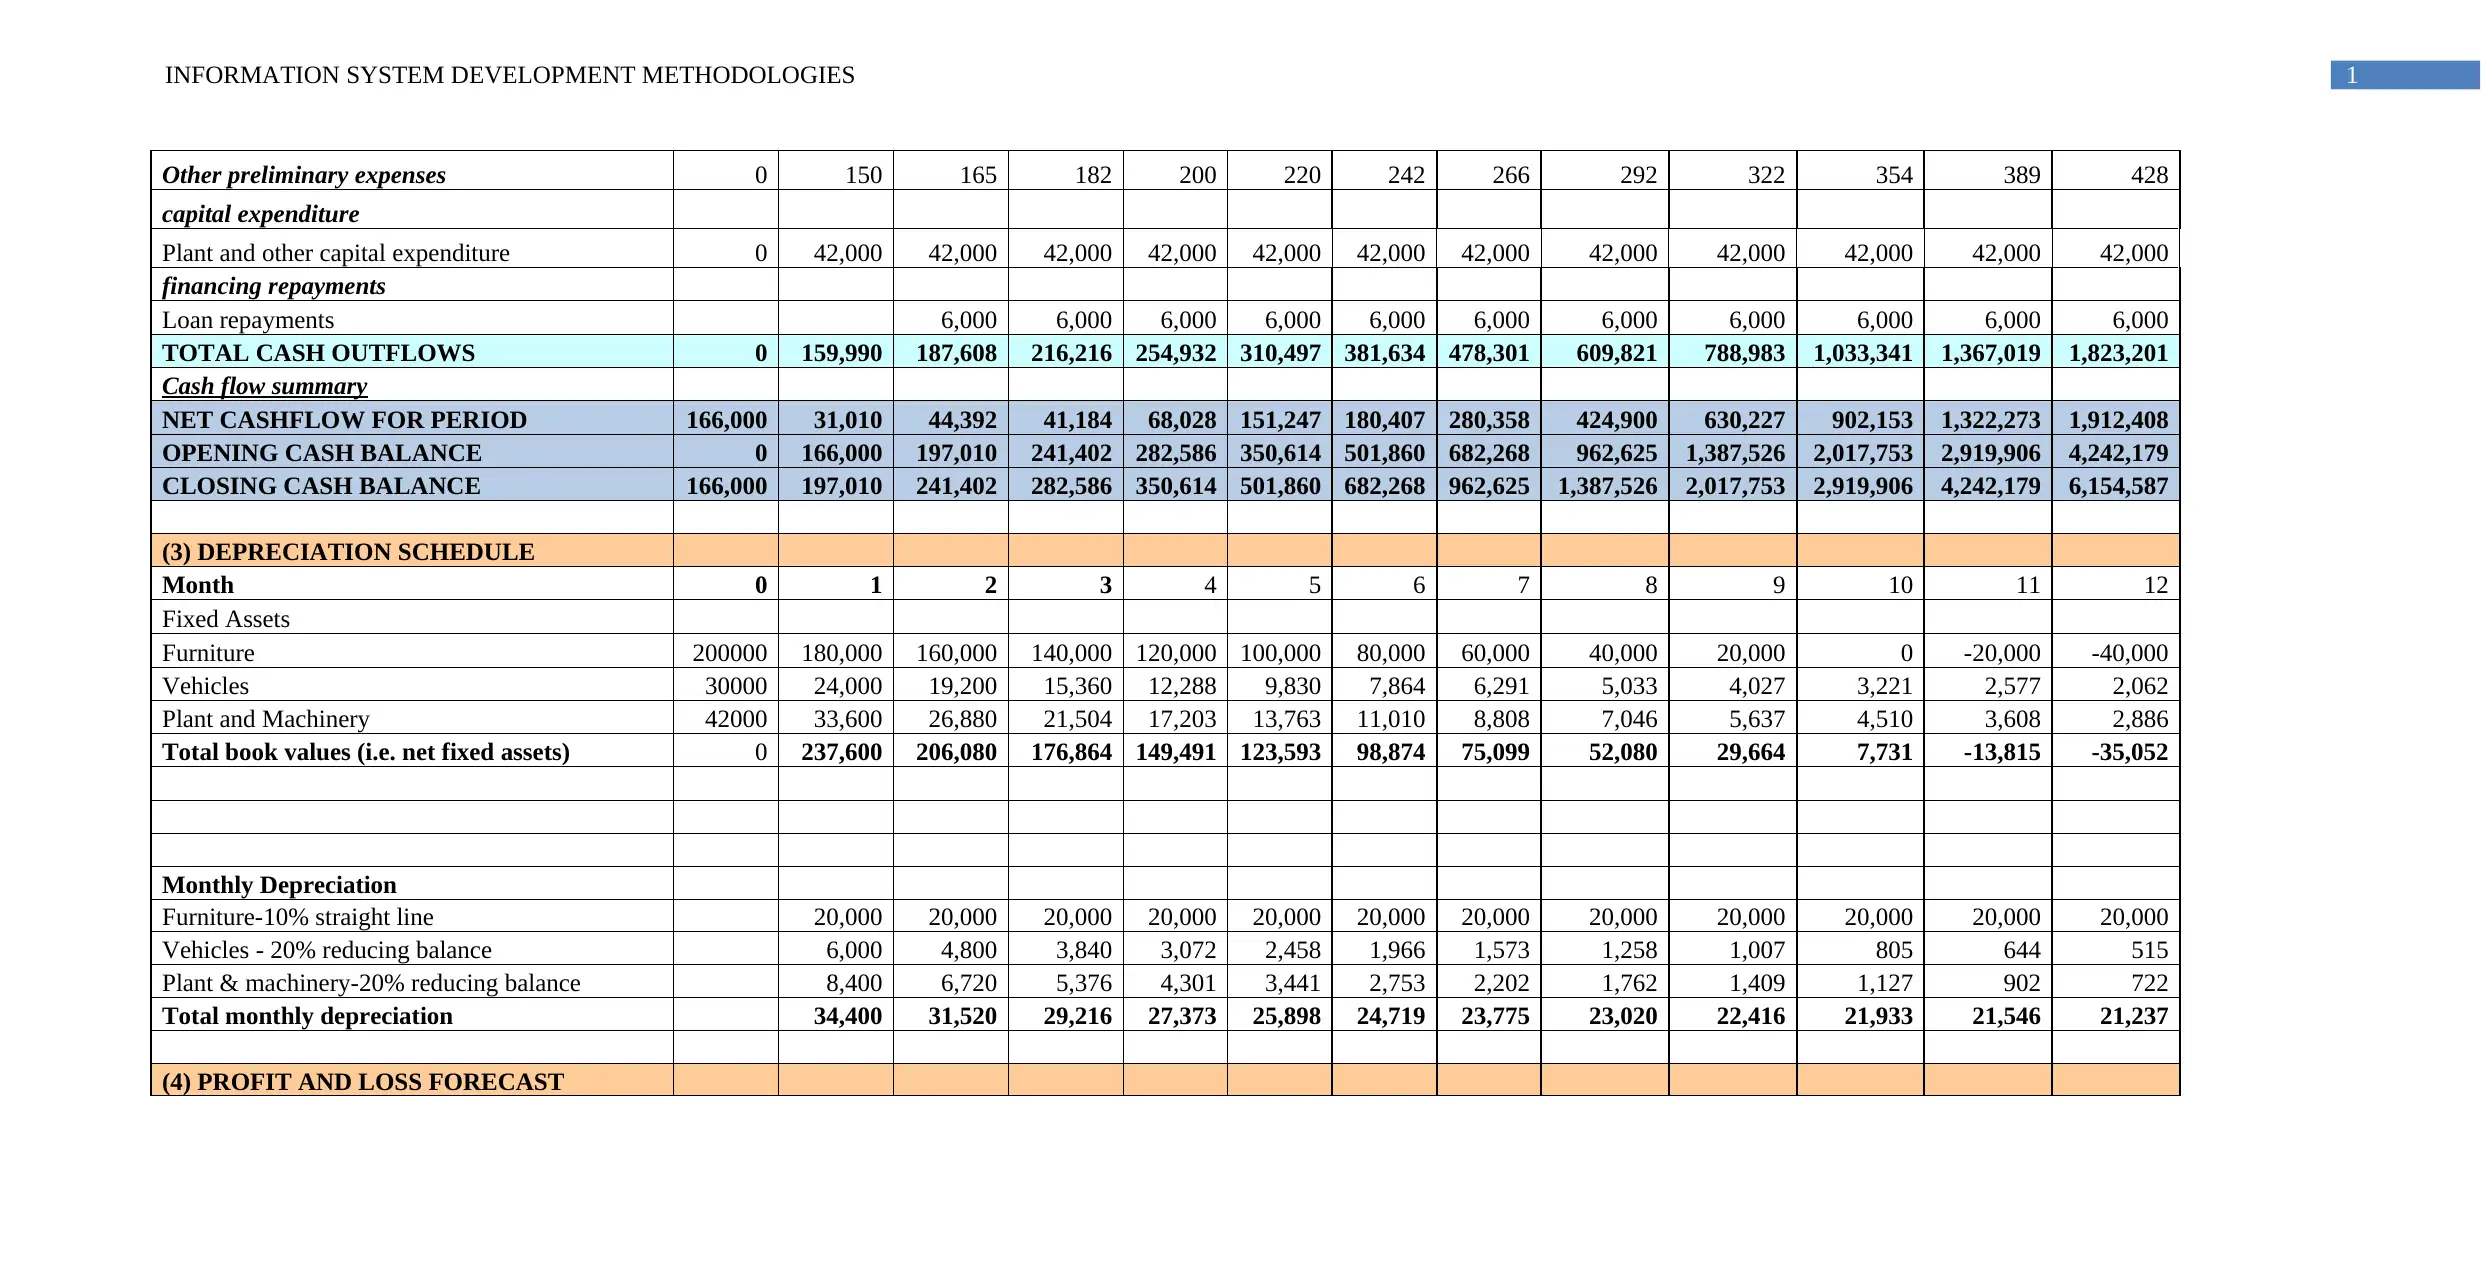
Other preliminary expenses 0 150 165 182 200 220 242 266 292 322 354 389 428
capital expenditure
Plant and other capital expenditure 0 42,000 42,000 42,000 42,000 42,000 42,000 42,000 42,000 42,000 42,000 42,000 42,000
financing repayments
Loan repayments 6,000 6,000 6,000 6,000 6,000 6,000 6,000 6,000 6,000 6,000 6,000
TOTAL CASH OUTFLOWS 0 159,990 187,608 216,216 254,932 310,497 381,634 478,301 609,821 788,983 1,033,341 1,367,019 1,823,201
Cash flow summary
NET CASHFLOW FOR PERIOD 166,000 31,010 44,392 41,184 68,028 151,247 180,407 280,358 424,900 630,227 902,153 1,322,273 1,912,408
OPENING CASH BALANCE 0 166,000 197,010 241,402 282,586 350,614 501,860 682,268 962,625 1,387,526 2,017,753 2,919,906 4,242,179
CLOSING CASH BALANCE 166,000 197,010 241,402 282,586 350,614 501,860 682,268 962,625 1,387,526 2,017,753 2,919,906 4,242,179 6,154,587
(3) DEPRECIATION SCHEDULE
Month 0 1 2 3 4 5 6 7 8 9 10 11 12
Fixed Assets
Furniture 200000 180,000 160,000 140,000 120,000 100,000 80,000 60,000 40,000 20,000 0 -20,000 -40,000
Vehicles 30000 24,000 19,200 15,360 12,288 9,830 7,864 6,291 5,033 4,027 3,221 2,577 2,062
Plant and Machinery 42000 33,600 26,880 21,504 17,203 13,763 11,010 8,808 7,046 5,637 4,510 3,608 2,886
Total book values (i.e. net fixed assets) 0 237,600 206,080 176,864 149,491 123,593 98,874 75,099 52,080 29,664 7,731 -13,815 -35,052
Monthly Depreciation
Furniture-10% straight line 20,000 20,000 20,000 20,000 20,000 20,000 20,000 20,000 20,000 20,000 20,000 20,000
Vehicles - 20% reducing balance 6,000 4,800 3,840 3,072 2,458 1,966 1,573 1,258 1,007 805 644 515
Plant & machinery-20% reducing balance 8,400 6,720 5,376 4,301 3,441 2,753 2,202 1,762 1,409 1,127 902 722
Total monthly depreciation 34,400 31,520 29,216 27,373 25,898 24,719 23,775 23,020 22,416 21,933 21,546 21,237
(4) PROFIT AND LOSS FORECAST
⊘ This is a preview!⊘
Do you want full access?
Subscribe today to unlock all pages.
Trusted by 1+ million students worldwide
2INFORMATION SYSTEM DEVELOPMENT METHODOLOGIES
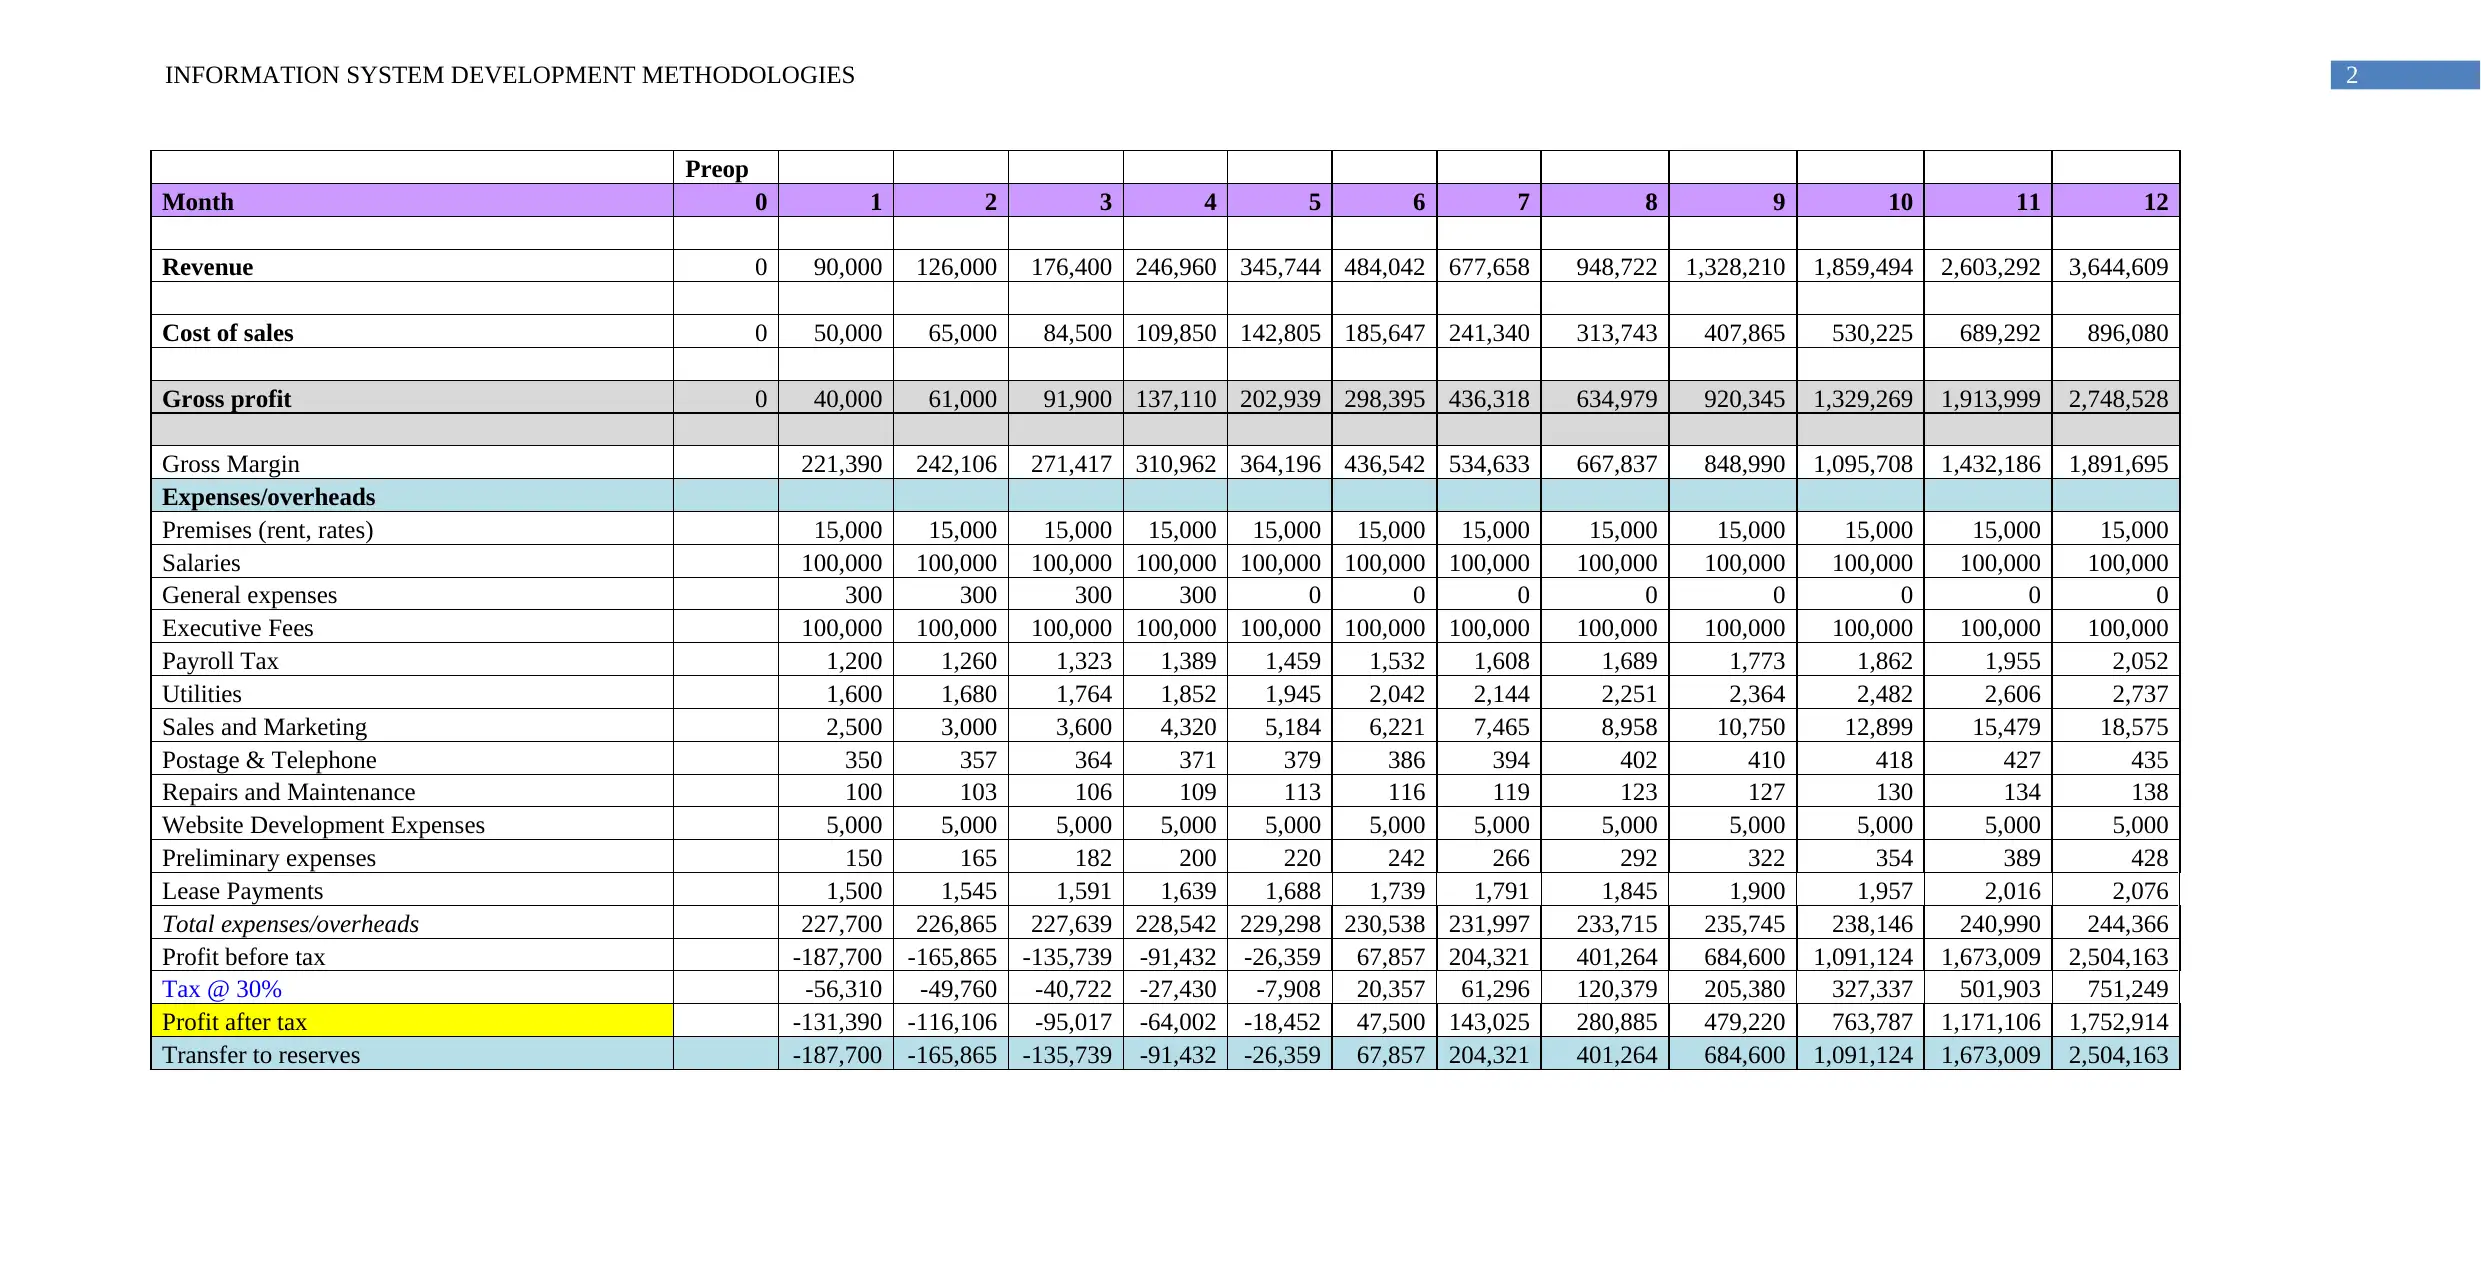
Preop
Month 0 1 2 3 4 5 6 7 8 9 10 11 12
Revenue 0 90,000 126,000 176,400 246,960 345,744 484,042 677,658 948,722 1,328,210 1,859,494 2,603,292 3,644,609
Cost of sales 0 50,000 65,000 84,500 109,850 142,805 185,647 241,340 313,743 407,865 530,225 689,292 896,080
Gross profit 0 40,000 61,000 91,900 137,110 202,939 298,395 436,318 634,979 920,345 1,329,269 1,913,999 2,748,528
Gross Margin 221,390 242,106 271,417 310,962 364,196 436,542 534,633 667,837 848,990 1,095,708 1,432,186 1,891,695
Expenses/overheads
Premises (rent, rates) 15,000 15,000 15,000 15,000 15,000 15,000 15,000 15,000 15,000 15,000 15,000 15,000
Salaries 100,000 100,000 100,000 100,000 100,000 100,000 100,000 100,000 100,000 100,000 100,000 100,000
General expenses 300 300 300 300 0 0 0 0 0 0 0 0
Executive Fees 100,000 100,000 100,000 100,000 100,000 100,000 100,000 100,000 100,000 100,000 100,000 100,000
Payroll Tax 1,200 1,260 1,323 1,389 1,459 1,532 1,608 1,689 1,773 1,862 1,955 2,052
Utilities 1,600 1,680 1,764 1,852 1,945 2,042 2,144 2,251 2,364 2,482 2,606 2,737
Sales and Marketing 2,500 3,000 3,600 4,320 5,184 6,221 7,465 8,958 10,750 12,899 15,479 18,575
Postage & Telephone 350 357 364 371 379 386 394 402 410 418 427 435
Repairs and Maintenance 100 103 106 109 113 116 119 123 127 130 134 138
Website Development Expenses 5,000 5,000 5,000 5,000 5,000 5,000 5,000 5,000 5,000 5,000 5,000 5,000
Preliminary expenses 150 165 182 200 220 242 266 292 322 354 389 428
Lease Payments 1,500 1,545 1,591 1,639 1,688 1,739 1,791 1,845 1,900 1,957 2,016 2,076
Total expenses/overheads 227,700 226,865 227,639 228,542 229,298 230,538 231,997 233,715 235,745 238,146 240,990 244,366
Profit before tax -187,700 -165,865 -135,739 -91,432 -26,359 67,857 204,321 401,264 684,600 1,091,124 1,673,009 2,504,163
Tax @ 30% -56,310 -49,760 -40,722 -27,430 -7,908 20,357 61,296 120,379 205,380 327,337 501,903 751,249
Profit after tax -131,390 -116,106 -95,017 -64,002 -18,452 47,500 143,025 280,885 479,220 763,787 1,171,106 1,752,914
Transfer to reserves -187,700 -165,865 -135,739 -91,432 -26,359 67,857 204,321 401,264 684,600 1,091,124 1,673,009 2,504,163
Paraphrase This Document
Need a fresh take? Get an instant paraphrase of this document with our AI Paraphraser
3INFORMATION SYSTEM DEVELOPMENT METHODOLOGIES
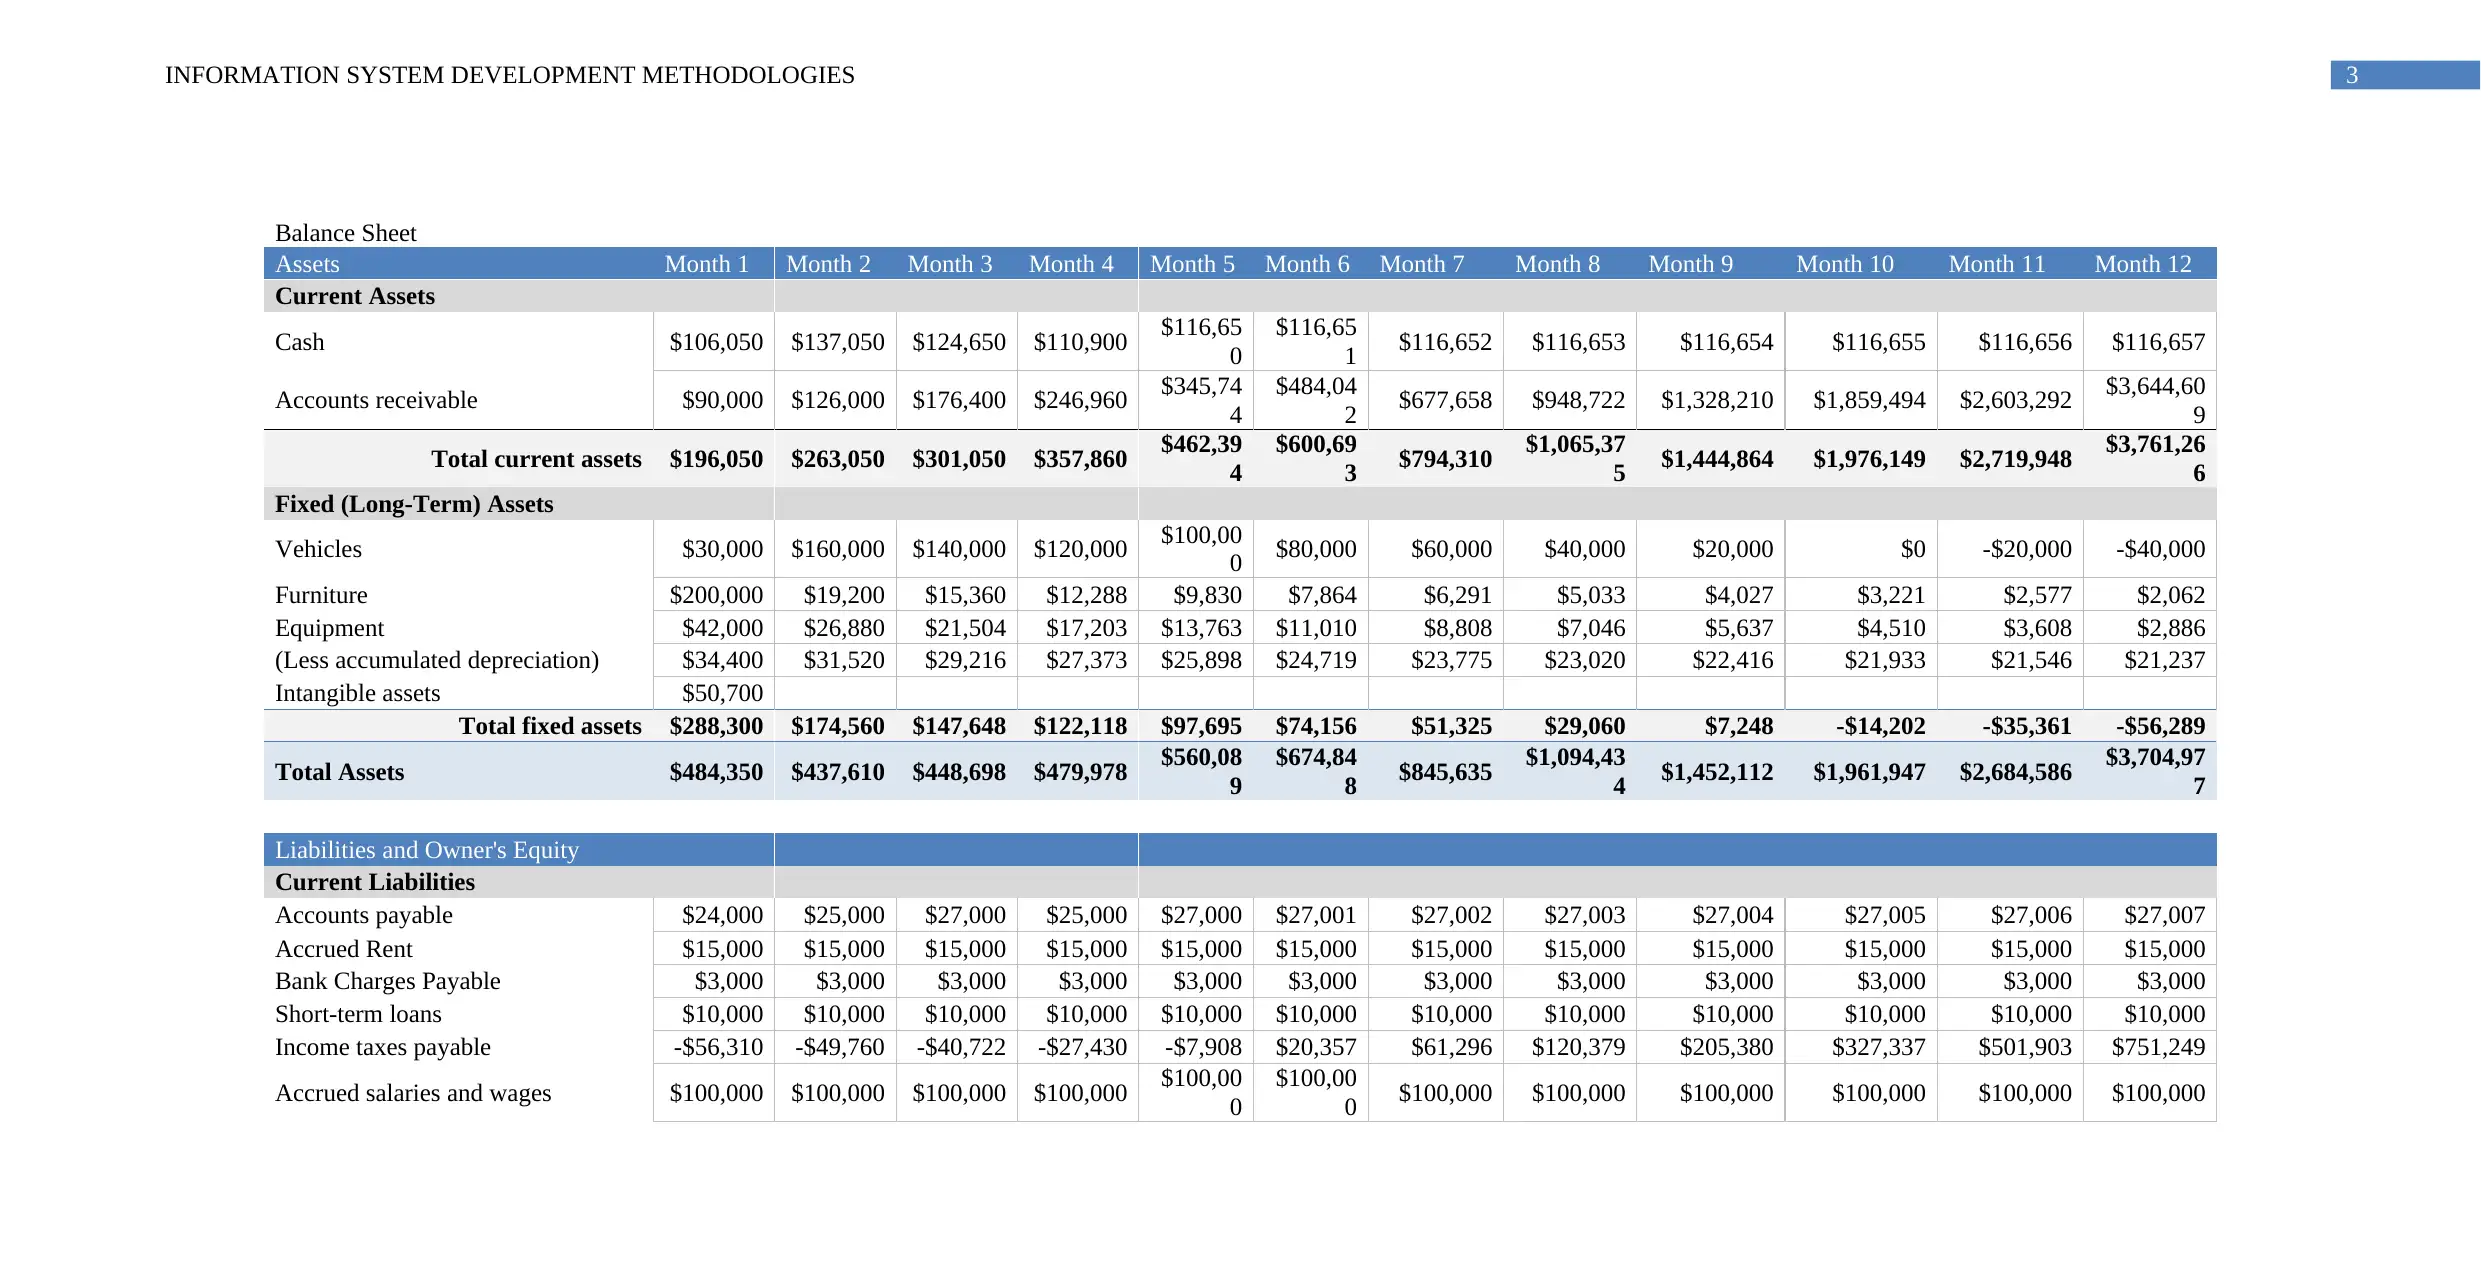
Balance Sheet
Assets Month 1 Month 2 Month 3 Month 4 Month 5 Month 6 Month 7 Month 8 Month 9 Month 10 Month 11 Month 12
Current Assets
Cash $106,050 $137,050 $124,650 $110,900 $116,65
0
$116,65
1 $116,652 $116,653 $116,654 $116,655 $116,656 $116,657
Accounts receivable $90,000 $126,000 $176,400 $246,960 $345,74
4
$484,04
2 $677,658 $948,722 $1,328,210 $1,859,494 $2,603,292 $3,644,60
9
Total current assets $196,050 $263,050 $301,050 $357,860 $462,39
4
$600,69
3 $794,310 $1,065,37
5 $1,444,864 $1,976,149 $2,719,948 $3,761,26
6
Fixed (Long-Term) Assets
Vehicles $30,000 $160,000 $140,000 $120,000 $100,00
0 $80,000 $60,000 $40,000 $20,000 $0 -$20,000 -$40,000
Furniture $200,000 $19,200 $15,360 $12,288 $9,830 $7,864 $6,291 $5,033 $4,027 $3,221 $2,577 $2,062
Equipment $42,000 $26,880 $21,504 $17,203 $13,763 $11,010 $8,808 $7,046 $5,637 $4,510 $3,608 $2,886
(Less accumulated depreciation) $34,400 $31,520 $29,216 $27,373 $25,898 $24,719 $23,775 $23,020 $22,416 $21,933 $21,546 $21,237
Intangible assets $50,700
Total fixed assets $288,300 $174,560 $147,648 $122,118 $97,695 $74,156 $51,325 $29,060 $7,248 -$14,202 -$35,361 -$56,289
Total Assets $484,350 $437,610 $448,698 $479,978 $560,08
9
$674,84
8 $845,635 $1,094,43
4 $1,452,112 $1,961,947 $2,684,586 $3,704,97
7
Liabilities and Owner's Equity
Current Liabilities
Accounts payable $24,000 $25,000 $27,000 $25,000 $27,000 $27,001 $27,002 $27,003 $27,004 $27,005 $27,006 $27,007
Accrued Rent $15,000 $15,000 $15,000 $15,000 $15,000 $15,000 $15,000 $15,000 $15,000 $15,000 $15,000 $15,000
Bank Charges Payable $3,000 $3,000 $3,000 $3,000 $3,000 $3,000 $3,000 $3,000 $3,000 $3,000 $3,000 $3,000
Short-term loans $10,000 $10,000 $10,000 $10,000 $10,000 $10,000 $10,000 $10,000 $10,000 $10,000 $10,000 $10,000
Income taxes payable -$56,310 -$49,760 -$40,722 -$27,430 -$7,908 $20,357 $61,296 $120,379 $205,380 $327,337 $501,903 $751,249
Accrued salaries and wages $100,000 $100,000 $100,000 $100,000 $100,00
0
$100,00
0 $100,000 $100,000 $100,000 $100,000 $100,000 $100,000
4INFORMATION SYSTEM DEVELOPMENT METHODOLOGIES
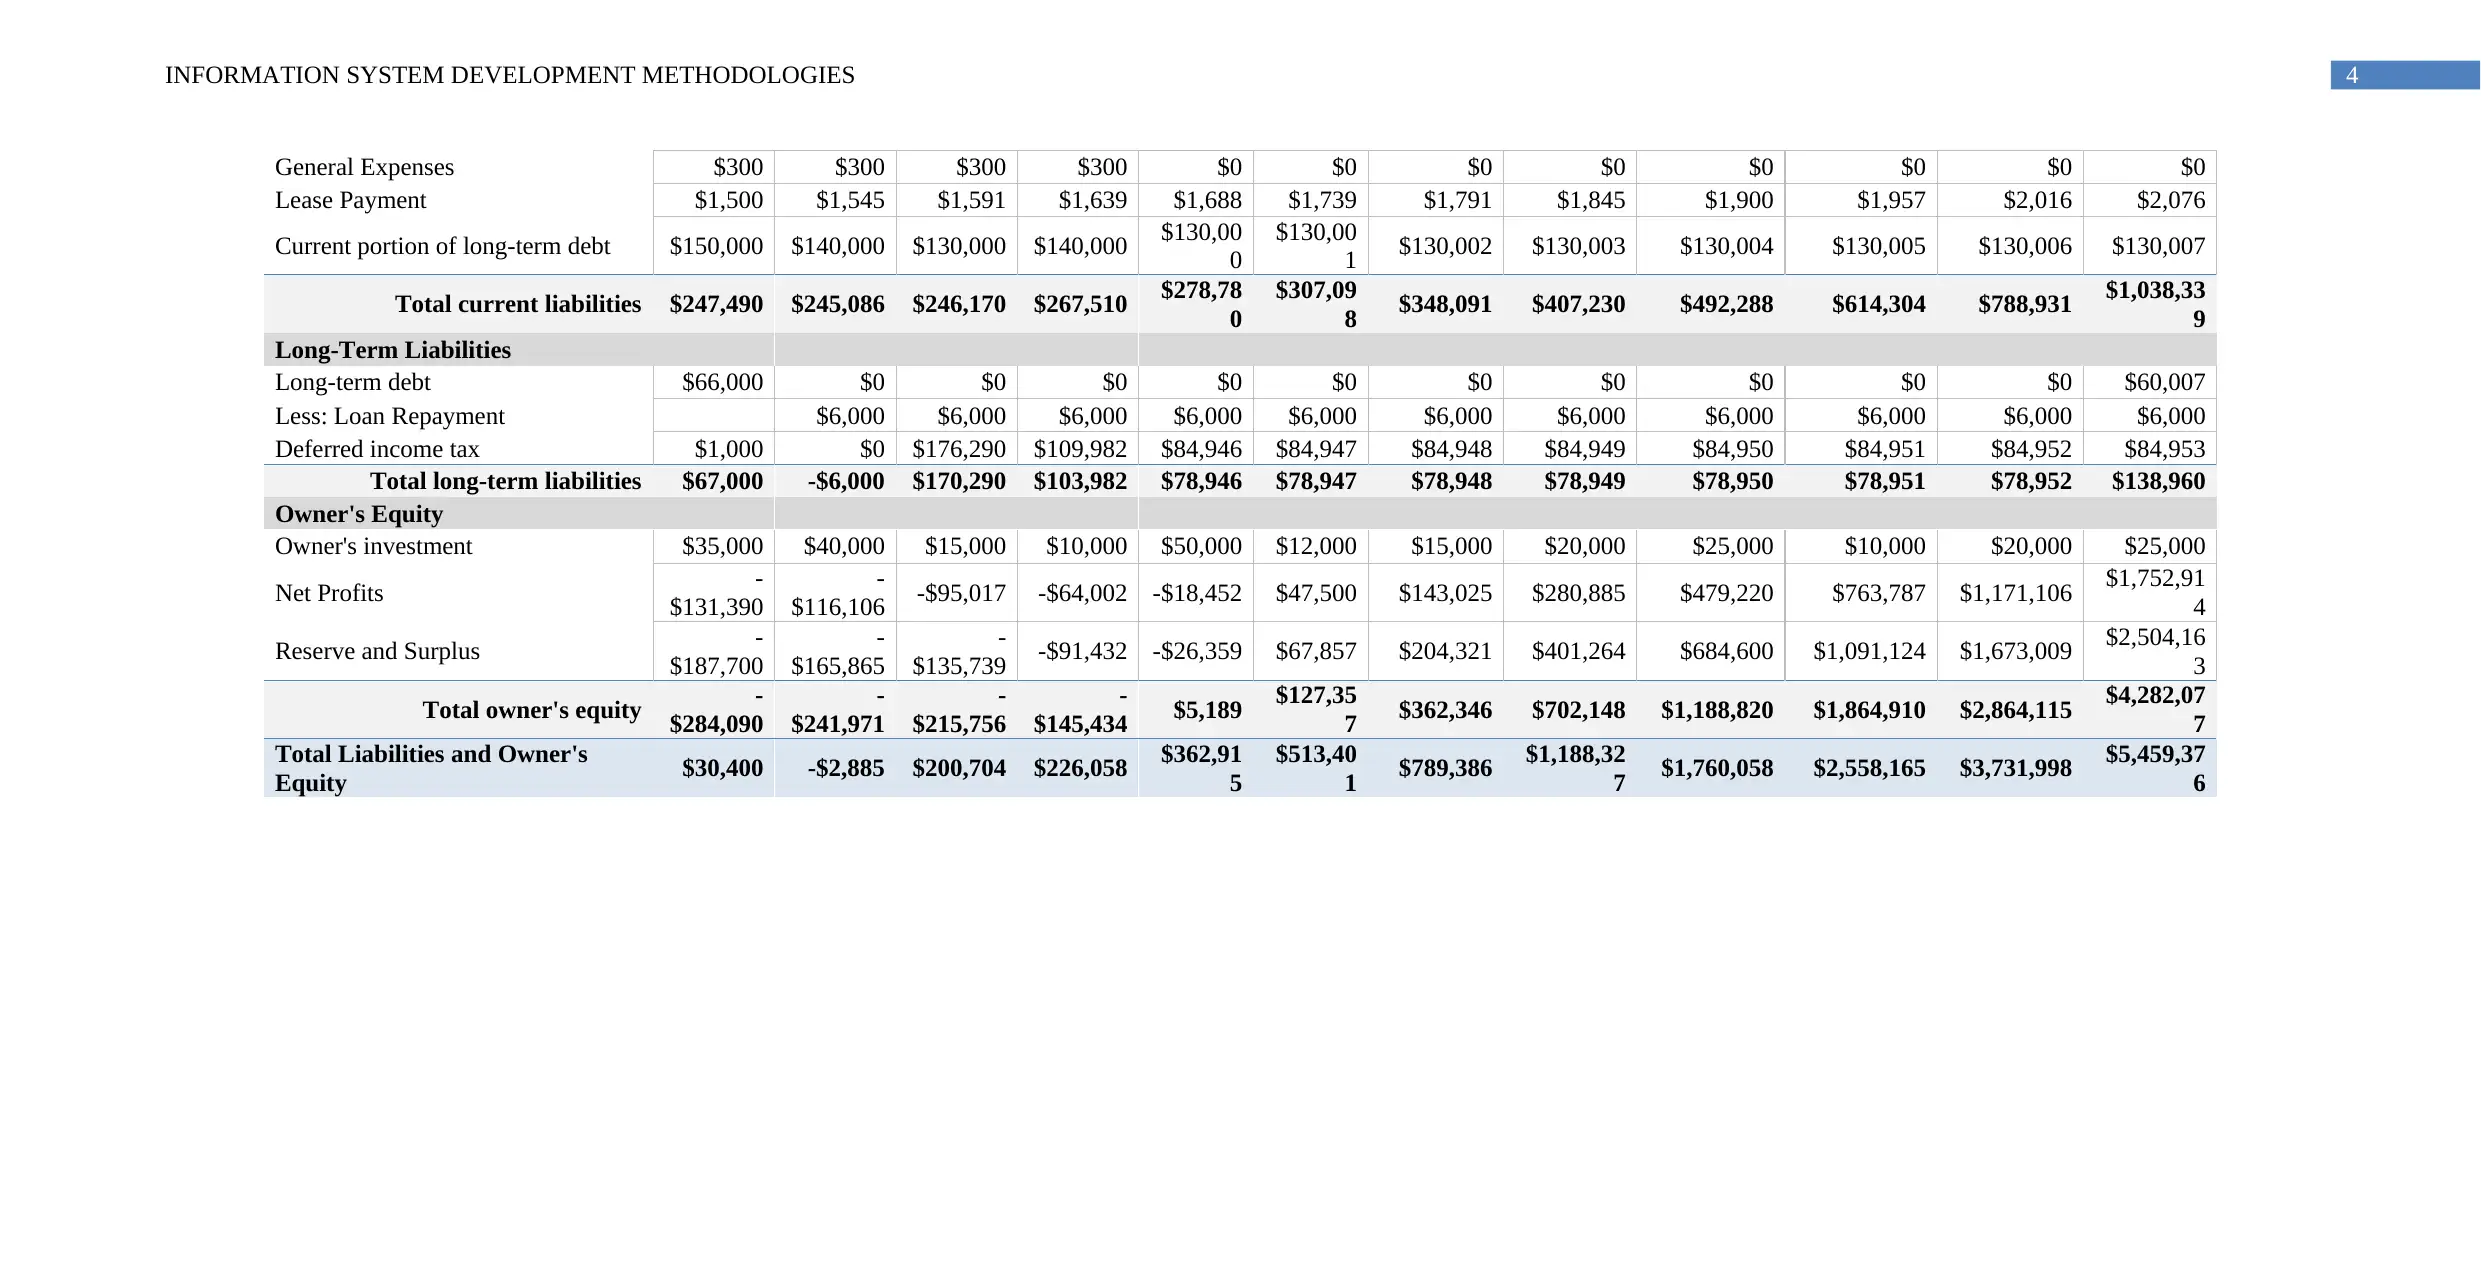
General Expenses $300 $300 $300 $300 $0 $0 $0 $0 $0 $0 $0 $0
Lease Payment $1,500 $1,545 $1,591 $1,639 $1,688 $1,739 $1,791 $1,845 $1,900 $1,957 $2,016 $2,076
Current portion of long-term debt $150,000 $140,000 $130,000 $140,000 $130,00
0
$130,00
1 $130,002 $130,003 $130,004 $130,005 $130,006 $130,007
Total current liabilities $247,490 $245,086 $246,170 $267,510 $278,78
0
$307,09
8 $348,091 $407,230 $492,288 $614,304 $788,931 $1,038,33
9
Long-Term Liabilities
Long-term debt $66,000 $0 $0 $0 $0 $0 $0 $0 $0 $0 $0 $60,007
Less: Loan Repayment $6,000 $6,000 $6,000 $6,000 $6,000 $6,000 $6,000 $6,000 $6,000 $6,000 $6,000
Deferred income tax $1,000 $0 $176,290 $109,982 $84,946 $84,947 $84,948 $84,949 $84,950 $84,951 $84,952 $84,953
Total long-term liabilities $67,000 -$6,000 $170,290 $103,982 $78,946 $78,947 $78,948 $78,949 $78,950 $78,951 $78,952 $138,960
Owner's Equity
Owner's investment $35,000 $40,000 $15,000 $10,000 $50,000 $12,000 $15,000 $20,000 $25,000 $10,000 $20,000 $25,000
Net Profits -
$131,390
-
$116,106 -$95,017 -$64,002 -$18,452 $47,500 $143,025 $280,885 $479,220 $763,787 $1,171,106 $1,752,91
4
Reserve and Surplus -
$187,700
-
$165,865
-
$135,739 -$91,432 -$26,359 $67,857 $204,321 $401,264 $684,600 $1,091,124 $1,673,009 $2,504,16
3
Total owner's equity -
$284,090
-
$241,971
-
$215,756
-
$145,434 $5,189 $127,35
7 $362,346 $702,148 $1,188,820 $1,864,910 $2,864,115 $4,282,07
7
Total Liabilities and Owner's
Equity $30,400 -$2,885 $200,704 $226,058 $362,91
5
$513,40
1 $789,386 $1,188,32
7 $1,760,058 $2,558,165 $3,731,998 $5,459,37
6
⊘ This is a preview!⊘
Do you want full access?
Subscribe today to unlock all pages.
Trusted by 1+ million students worldwide
1 out of 15
Related Documents


Your All-in-One AI-Powered Toolkit for Academic Success.
+13062052269
info@desklib.com
Available 24*7 on WhatsApp / Email
![[object Object]](/_next/static/media/star-bottom.7253800d.svg)
Unlock your academic potential
Copyright © 2020–2026 A2Z Services. All Rights Reserved. Developed and managed by ZUCOL.