Networking Assignment
VerifiedAdded on 2023/01/19
|11
|2137
|20
AI Summary
This Networking Assignment discusses the importance of network monitoring and troubleshooting in businesses and organizations. It focuses on the use of ManageEngine OpManager as an effective and affordable network monitoring tool. The assignment covers topics such as network performance management, applications of OpManager, and a comparison with other network management tools.
Contribute Materials
Your contribution can guide someone’s learning journey. Share your
documents today.

INSTITUTION:
FACULTY:
DEPARTMENT:
COURSE:
UNIT NAME:
UNIT CODE:
YEAR OF STUDY:
NAME:
REGISTRATION NUMBERS:
FACULTY:
DEPARTMENT:
COURSE:
UNIT NAME:
UNIT CODE:
YEAR OF STUDY:
NAME:
REGISTRATION NUMBERS:
Secure Best Marks with AI Grader
Need help grading? Try our AI Grader for instant feedback on your assignments.
NETWORKING ASSIGNMENT
Executive Summary
Businesses and institutions entirely relies on networks for their operations such as
communication between departments. This therefore makes network one of the most essential
components of businesses and organizations at large. In conjunction to this, network
monitoring is very important for all reasons. ManageEngine OpManager comes in handy for
this task, it is an easy to use network monitoring tool which is very affordable. It monitors
devices including routers, switches, load balancers, firewalls and even the servers. It monitors
networks in prose form i.e. continuous manner.
Table of Contents
Executive summary……………………………………………………………………2
Introduction……………………………………………………………………………3
Part one………………………………………………………………………………...4
Network Performance Management…………………………………………………………………4.1
OpManager-perfect fit for network monitoring…………………………………………………….4.2
Network monitoring and Troubleshooting process…………………………………………………4.3
Part two: Applications of ManageEngine OpManager………………………………………………………5
Part 3: Compare ManageEngine OpManager with any other network management
tool.6
Conclusion………………………………………………………………………………7
Reference………………………………………………………………………………..8
Recommendation………………………………………………………………………..9
Introduction
Network monitoring as a prose and essential component of any system needs a reliable tool
or softwares which are secure. Monitoring therefore is a continuous [3] process of observing
the network to identify any anomaly. Troubleshooting on the other hand involves monitoring
and solving the problems that arise within the network.
According to IEE software [5]OpManager use and installation is fast and easy though has to
be configured manually. The administrators do automate troubleshooting and maintenance.
Part one
Network Performance Management
OpManager [4] gives various dashboard options that can be modified, even though
navigation through the UI may not be easy, the tool produces many kinds of reports that may
be able to come up with threshold alarms to prompt notices via emails, SMS texts and
customized scripts. The tool also has three tier levels of threshold namely; Warning, Trouble
and Error. The Warning tier will alert the administrator of an impending trouble, this is done
through notices and appearance of anomalies which the administrators can detect and act
upon them in time. Trouble is a level in which the warning went unnoticed or unheeded thus
a threat or an attack occurs and happens concurrently with the Error tier.
OpManager-perfect fit for network monitoring
With all said and done, network performance has to be reliable at all times hence the use of most
effective network monitoring and trouble shooting tools and techniques, in this case the OpManager
tool is the best.
With the above tiers, the OpManager is perfectly the appropriate tool for use in the sensitive
area of network administration, providing the users with the prior knowledge of occurrence of
an error or a threat, it is basically the perfect tool. The administrator can act upon the warning
before it gets out hands thus avert the possible adverse conditions happening to the business
or the institution.
Network monitoring and Troubleshooting process
Network monitoring [2] is basically a computer’s network procedural exertion to identify
sluggish or deteriorating network gears such as the burdened or worn-out servers,
deteriorating routers, botched switches or any other device with issues. The network monitor
system notifies the administrator in the event of a network failure. Network monitoring is
done by the use of software applications like in this case the OpManager is used.
Network Troubleshooting on the other hand is co-operative measures and processes that are
employed in identifying and solving problems in the network system. Both monitoring and
troubleshooting work hand-in hand to realize the common goal of good functioning of the
network system.
Secure Best Marks with AI Grader
Need help grading? Try our AI Grader for instant feedback on your assignments.
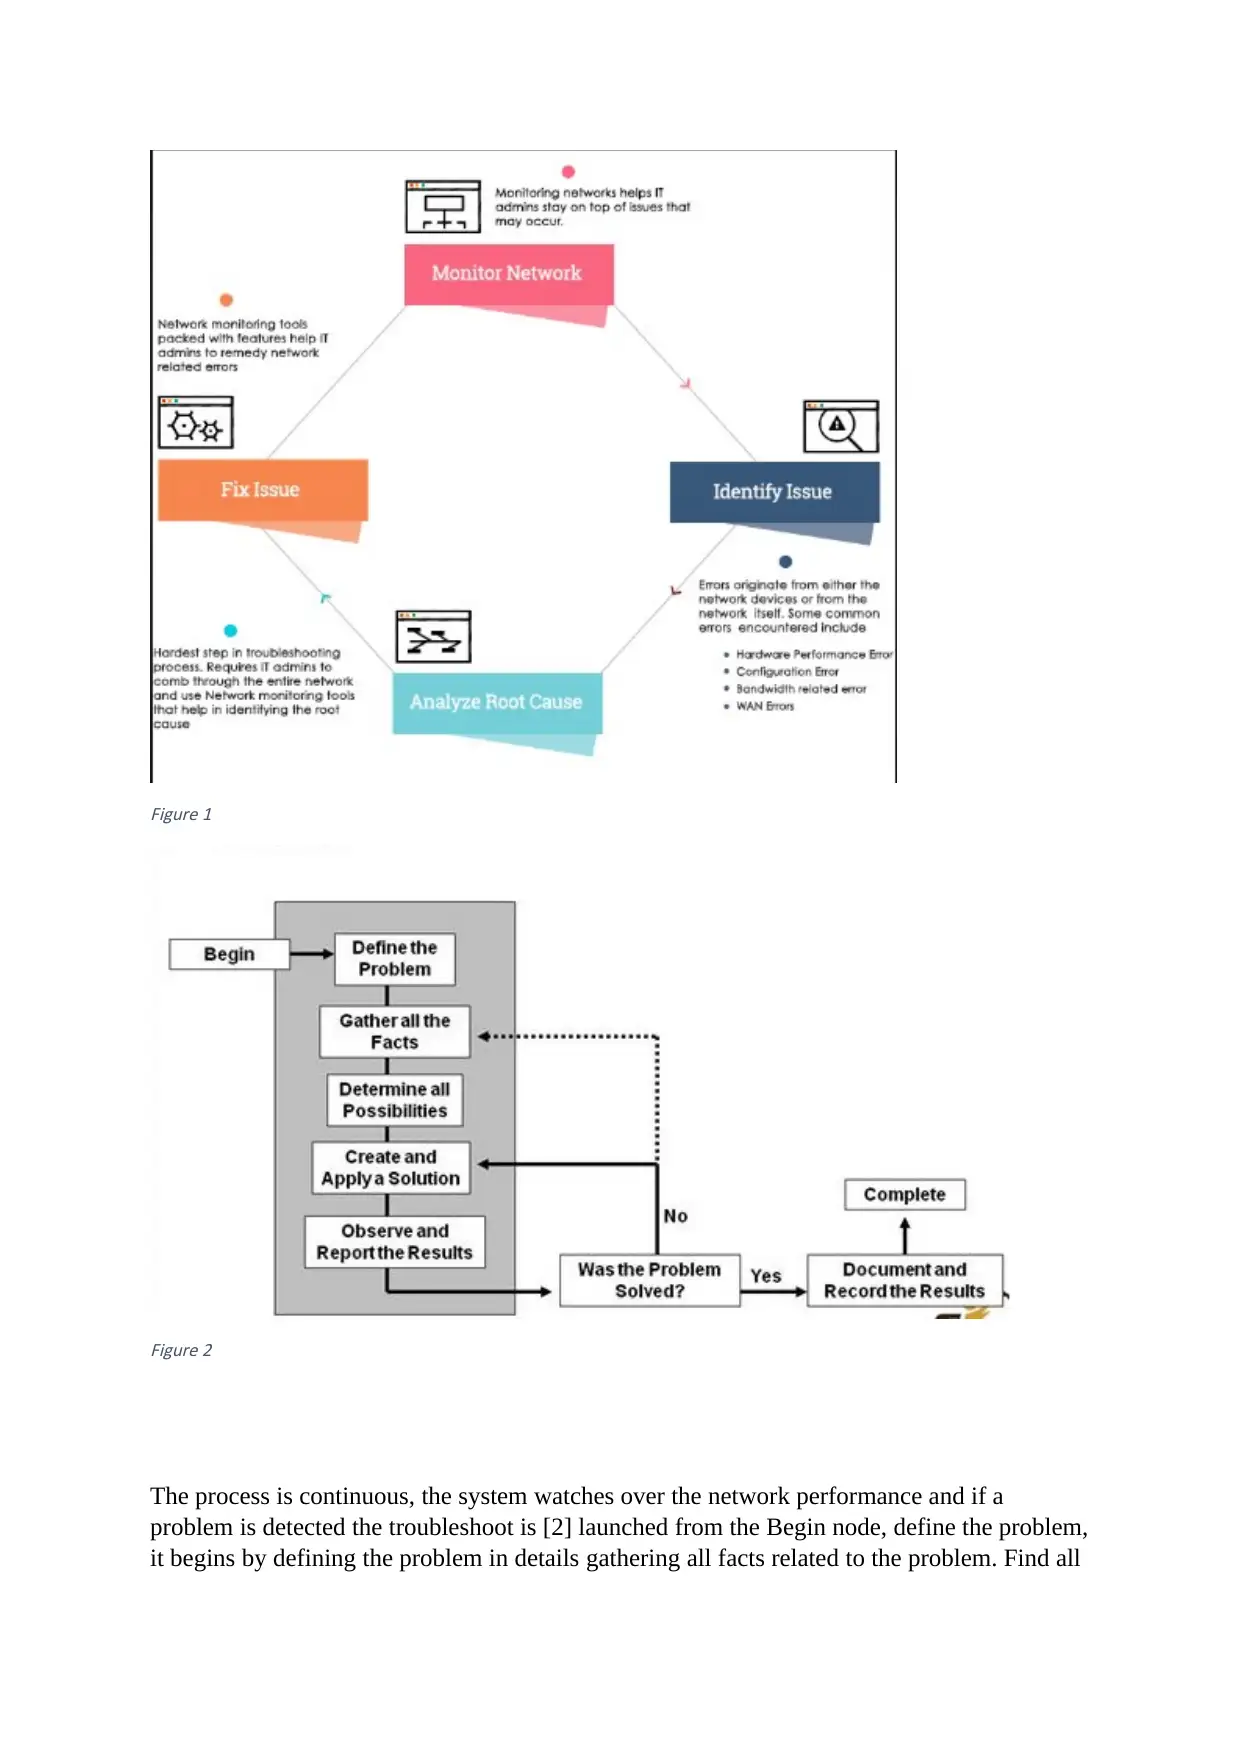
Figure 1
Figure 2
The process is continuous, the system watches over the network performance and if a
problem is detected the troubleshoot is [2] launched from the Begin node, define the problem,
it begins by defining the problem in details gathering all facts related to the problem. Find all
Figure 2
The process is continuous, the system watches over the network performance and if a
problem is detected the troubleshoot is [2] launched from the Begin node, define the problem,
it begins by defining the problem in details gathering all facts related to the problem. Find all
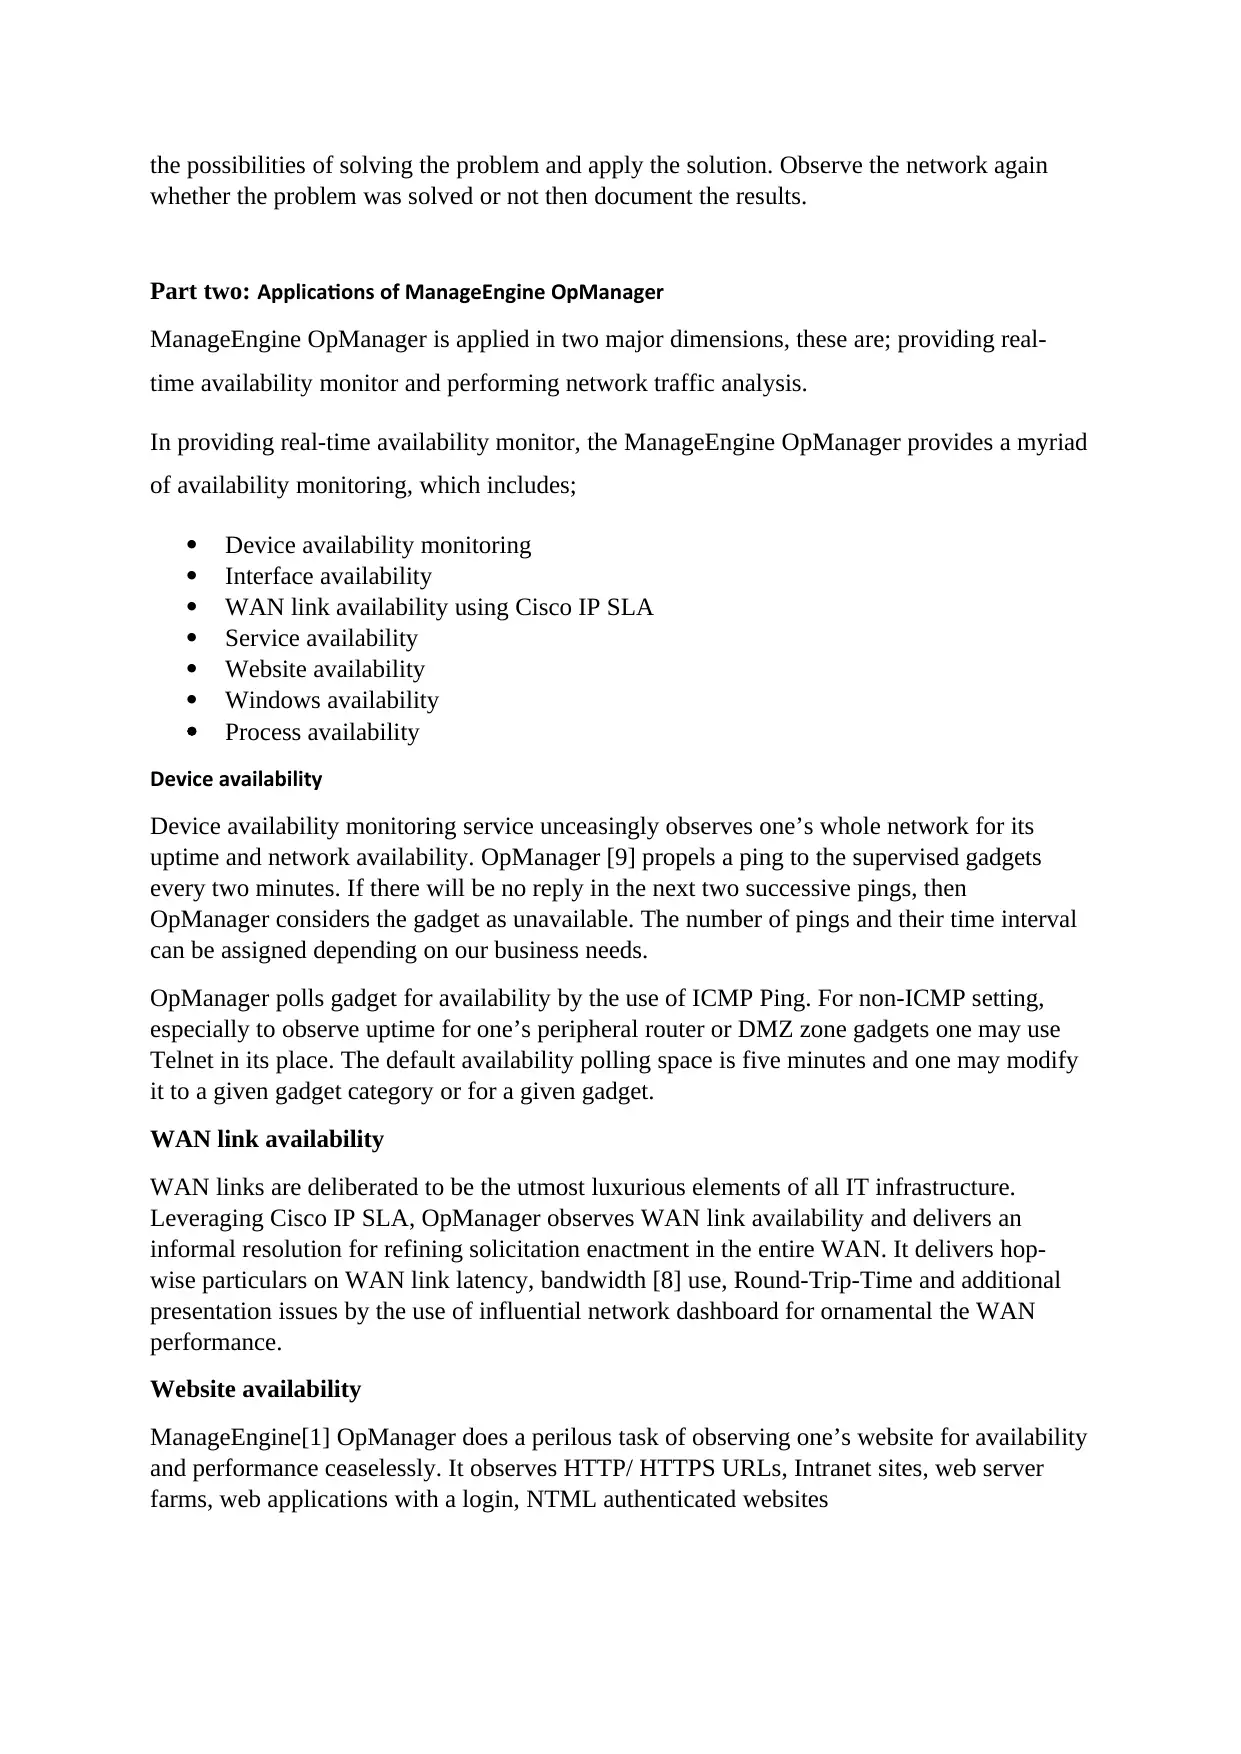
the possibilities of solving the problem and apply the solution. Observe the network again
whether the problem was solved or not then document the results.
Part two: Applications of ManageEngine OpManager
ManageEngine OpManager is applied in two major dimensions, these are; providing real-
time availability monitor and performing network traffic analysis.
In providing real-time availability monitor, the ManageEngine OpManager provides a myriad
of availability monitoring, which includes;
Device availability monitoring
Interface availability
WAN link availability using Cisco IP SLA
Service availability
Website availability
Windows availability
Process availability
Device availability
Device availability monitoring service unceasingly observes one’s whole network for its
uptime and network availability. OpManager [9] propels a ping to the supervised gadgets
every two minutes. If there will be no reply in the next two successive pings, then
OpManager considers the gadget as unavailable. The number of pings and their time interval
can be assigned depending on our business needs.
OpManager polls gadget for availability by the use of ICMP Ping. For non-ICMP setting,
especially to observe uptime for one’s peripheral router or DMZ zone gadgets one may use
Telnet in its place. The default availability polling space is five minutes and one may modify
it to a given gadget category or for a given gadget.
WAN link availability
WAN links are deliberated to be the utmost luxurious elements of all IT infrastructure.
Leveraging Cisco IP SLA, OpManager observes WAN link availability and delivers an
informal resolution for refining solicitation enactment in the entire WAN. It delivers hop-
wise particulars on WAN link latency, bandwidth [8] use, Round-Trip-Time and additional
presentation issues by the use of influential network dashboard for ornamental the WAN
performance.
Website availability
ManageEngine[1] OpManager does a perilous task of observing one’s website for availability
and performance ceaselessly. It observes HTTP/ HTTPS URLs, Intranet sites, web server
farms, web applications with a login, NTML authenticated websites
OpManager also observes URLs to make sure that they are accessible and serving pages
which are more reliable. In place of being [4] contingent on ICMP pings or TCP port checks
on port 80. One may observe availability and health of all public.
Just to mention and discuss a few of availability parameters measured by the ManageEngine
OpManager.
In performing network traffic analysis, the ManageEngine OpManager, performs the traffic
analysis by the use of monitoring module which delivers the visibility on network traffic
patterns and bandwidth usage. It does this by the use of NetFlow, sFlow, j-Flow and IPFIX.
Flow-based network bandwidth and traffic [6] patterns are done the user interface level
whereby link speed and utilization in the real time can be viewed.
Part 3: Compare ManageEngine OpManager with any other network management tool
Network management has a myriad of tools that can be used to monitor and troubleshoot the
network systems. SolarWinds for instance is an example of other options apart from
ManageEngine OpManager. SolarWinds is an all in one [10]tool performing both monitoring
and troubleshooting of the network system. The tool is capable of different functionalities,
such as:
Network performance monitoring
IPMonitor
Log Analyzer
IP Address Manager
User Device Tracker
NetFlow analyser
VoIP and Network Quality Manager.
ManageEngine OpManager and SolarWinds are similar in some way especially in operation.
Similarities
Both of them share some services such as NetFlow analysis, performance monitoring, IP
Address management.
Both the ManageEngine OpManager and SolarWinds have notification alerts through emails
and SMS texts. The two use escalation system chains. In the event that system does not
respond in the expected time, the two escalates the situation in notice form.
Both of them are proprietary networking monitoring and troubleshooting softwares.
Differences
However, OpManager and SolarWinds are different, the difference comes in the services they
offer and how they are carried out.
For instance, SolarWInds provides Log Analysis which is not in OpManager, SolarWinds
keeps track and records of the system’s operations and its performances. This keeps the track
of activities and their respective performance indices [1]; this helps giving the administrator
Paraphrase This Document
Need a fresh take? Get an instant paraphrase of this document with our AI Paraphraser
some clue on how the network[9] has been performing in history form unlike the OpManager
which gives it in real-time or up to date.
SolarWinds network system monitoring and troubleshooting tool avails for VoIP and
Network Quality Manager, unlike the OpManager, SolarWinds provides for VoIP
management (Voice IP).
Also SolarWinds provides for Device Tracker, user device tracker service provides the
capability of the device [6] tracking, a feature which is not in OpManager.
Unlike solar ManageEngine OpManager, SolarWinds is designed such that many alerts cause
paralysis in the system in network performance parameter.
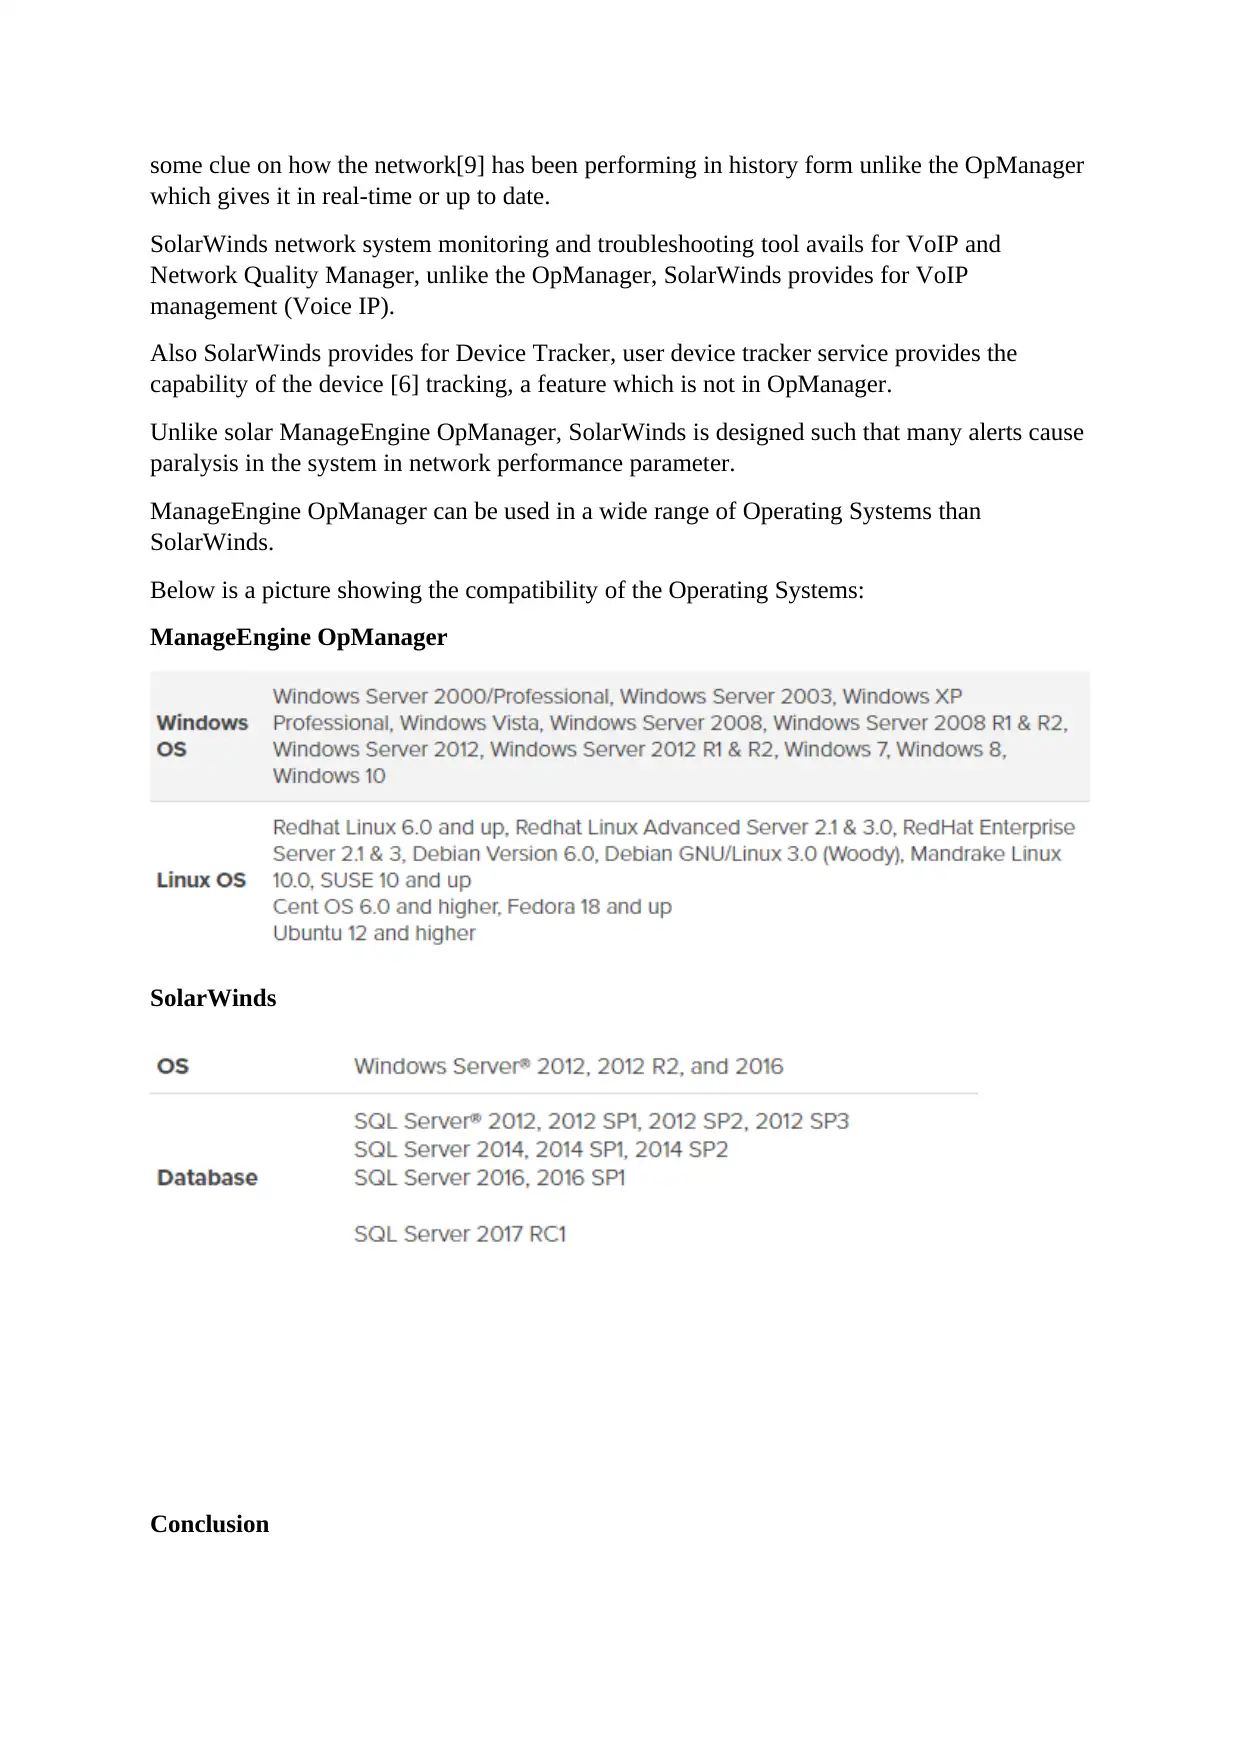
ManageEngine OpManager can be used in a wide range of Operating Systems than
SolarWinds.
Below is a picture showing the compatibility of the Operating Systems:
ManageEngine OpManager
SolarWinds
Conclusion
Network monitoring and troubleshooting is an essential component of administration (system
and network administration) to businesses and organizations. It secures and streamlines the
day to day operations of the business or the organization.
Recommendation
For any success in running today’s modern business, communication is essential,
technological communication for that matter, this therefor calls for robust exploration in
communication technologies and find out the most cost effective, reliable and prudent tools to
be used in companies, therefore in my opinion, I strongly recommend the use of most reliable
tools or techniques of network monitoring and troubleshooting, even though it all depends on
the user needs, security and reliability cuts across all the users hence when selecting a tool for
this case, the user/administrator should select one with the above two parameters.
References
[1] Wundsam, A., Levin, D., Seetharaman, S. and Feldmann, A,. OFRewind: enabling record
and replay troubleshooting for networks. In USENIX Annual Technical Conference USENIX
Association, 1(1),pp. 327-340,2011.
[2] Satkunanathan, L., Sunkammurali, K. and Watson, E.B., Microsoft Corp,. Network
security page. U.S(2) Patent 8,239,943,2012.
[3] Hernantes, J., Gallardo, G. and Serrano, N. IT infrastructure-monitoring tools. IEEE
Software, 32(4), pp.88-93,2015.
[4] Ramly, N.N., Ismail, A.Z., Aziz, M.H. and Ahmad, N.H., 2011, October. Operations
dashboard: comparative study. In International Conference on Graphic and Image
Processing (ICGIP 2011) (Vol. 8285, p. 82853G). International Society for Optics and
Photonics.
[5] Cornacchiola, P.. ManageEngine Applications Manager introduces Storage-level VMs
Mapping, 2013.
[6] Nomnga, P. and Scott, M.S. An Exploration Scrutiny of Systems Performance Monitoring
Tools: An Applications and Agentless Server Approach. International Journal of Computer
Science Issues (IJCSI), 11(1), p.1,2014.
[7] Nomnga, P. and Scott, M.S. An Exploration Scrutiny of Systems Performance Monitoring
Tools: An Applications and Agentless Server Approach. International Journal of Computer
Science Issues (IJCSI), 11(1), p.1,2014.
[8] Monserate, G.S. and Mendez, J.S, . Adaptive Network Tools and Services Network
Topology Mapper. In Proceedings of the 6th International Conference on Information
Technology: IoT and Smart City pp. 115-119,2018. ACM.
[9] Guimarães, V.T.,. A reuse-based approach to promote the adoption of info vis tecniques
for network and service management tasks, 2016.
Secure Best Marks with AI Grader
Need help grading? Try our AI Grader for instant feedback on your assignments.
[10] Gabdurahmanov, M. and Trygg, S. Analysis and Evaluation of Network Management
Solutions: A Comparison of Network Management Solutions Suitable for Networks with
2,500+ Devices,2016.
[11] Thornton, B. and Li, C. The applicability of network management systems in small
businesses. In IEEE Conference Anthology pp. 1-7,2013. IEEE.
Solutions: A Comparison of Network Management Solutions Suitable for Networks with
2,500+ Devices,2016.
[11] Thornton, B. and Li, C. The applicability of network management systems in small
businesses. In IEEE Conference Anthology pp. 1-7,2013. IEEE.
1 out of 11
Related Documents
Your All-in-One AI-Powered Toolkit for Academic Success.
+13062052269
info@desklib.com
Available 24*7 on WhatsApp / Email
![[object Object]](/_next/static/media/star-bottom.7253800d.svg)
Unlock your academic potential
© 2024 | Zucol Services PVT LTD | All rights reserved.


