International Passenger Survey User Guide (Volume 1)
VerifiedAdded on 2023/02/06
|44
|14830
|23
AI Summary
This user guide provides background information on the International Passenger Survey (IPS) for overseas travel and tourism. It covers the survey's history, methodology, data collection, processing, and publication. The IPS is a continuous sample survey conducted by the Office of National Statistics (ONS) to collect information about UK inbound and outbound migration, as well as data about UK international travel and tourism.
Contribute Materials
Your contribution can guide someone’s learning journey. Share your
documents today.

International Passenger
Survey
Overseas Travel and Tourism
User Guide (Volume 1)
Background & Methodology
(2014)
Survey
Overseas Travel and Tourism
User Guide (Volume 1)
Background & Methodology
(2014)
Secure Best Marks with AI Grader
Need help grading? Try our AI Grader for instant feedback on your assignments.

Page | 2
Page | 3
Table of contents
Background to the International Passenger Survey
1 The International Passenger Survey .............................................................................. 5
2 History of the IPS ........................................................................................................... 6
2.1 Survey Timeline ...................................................................................................... 7
3 Primary purpose, Users and Uses of the IPS Overseas Travel and Tourism data ........ 10
3.1 Primary purpose ....................................................................................................... 10
3.2 Users of IPS Overseas Travel and Tourism data .................................................... 10
3.3 Uses of the IPS Overseas Travel and Tourism data ................................................ 11
Figure A Uses of IPS Overseas Travel and Tourism estimates ................................... 11
Table 1 Uses of the Overseas Travel and Tourism data by main IPS users and
sponsors ........................................................................................................ 12
3.4 Assessment of User needs and perceptions ........................................................... 13
Design and Data collection
4 Survey design ................................................................................................................ 14
Map 1 International Passenger Survey locations ......................................................... 14
5 Sampling design ............................................................................................................ 15
Figure B Example of sample drawn for a two-week period for Heathrow airport ......... 16
Figure C Example of sub-sample sheet for arrivals shift (2 in 1 sub-sample) .............. 17
Figure D The application of the IPS two-stage sampling ............................................. 18
Figure E Passengers included in Overseas Travel and Toursim estimates ............... 19
5.1 Sampling ports and routes ....................................................................................... 19
5.2 Air routes .................................................................................................................. 19
5.3 Sea routes ................................................................................................................ 20
5.4 Tunnel routes ........................................................................................................... 20
5.5 Exclusions from the IPS sample .............................................................................. 21
6 Historical changes to sampling ...................................................................................... 21
6.1 Changes made prior to 2009 ................................................................................... 21
6.2 Changes made in 2009 ............................................................................................ 21
6.3 Sample revisions during the 2012 Olympic/Paralympic Games .............................. 22
7 Changes in methodology ............................................................................................... 24
7.1 Changes to the collection of data from travellers to and from the Irish Republic
from 1999 onwards ................................................................................................. 24
7.2 Changes in methodology. 2005 ............................................................................... 24
7.3 Changes in methodology. 2007 ............................................................................... 25
7.4 Changes in methodology. 2009 ............................................................................... 25
7.5 Changes in methodology. 2010 ............................................................................... 26
Page | 4
8 Fieldwork ........................................................................................................................ 27
8.1 The collection of IPS data ........................................................................................ 27
9 The IPS questionnaire ................................................................................................... 28
9.1 Main concepts .......................................................................................................... 28
9.2 Trailer questionnaires .............................................................................................. 30
Figure F Flow through departures questionnaire ......................................................... 31
Figure G Flow through arrivals questionnaire .............................................................. 32
9.3 Piloting the IPS questionnaire .................................................................................. 33
9.4 Primary purpose of the pilot ..................................................................................... 33
9.5 Restrictions on the questionnaire ............................................................................. 33
IPS Data Processing
10 Weighting ....................................................................................................................... 35
10.1 Weighting stages .................................................................................................. 35
10.2 Imputation ............................................................................................................. 37
10.3 Seasonal adjustment ............................................................................................ 38
10.4 Constant proces .................................................................................................... 38
10.5 Additional sources of data ..................................................................................... 38
Quality of the IPS
11 Strengths and Limitations .............................................................................................. 40
11.1 Strengths ............................................................................................................... 40
11.2 Limitations ............................................................................................................. 40
Non-sampling error ........................................................................................ 40
Sampling error ................................................................................................ 41
12 Response rates ............................................................................................................. 42
Table 2 IPS Overseas Travel and Tourism response rate by quarter, 2013 ................. 42
Table 3 IPS Overseas Travel and Tourism full response, 2013 ................................... 43
Publication & Dissemination
13 Dissemination & Publications ....................................................................................... 44
13.1 Publications ........................................................................................................... 44
13.2 Accessing datasets ............................................................................................... 44
13.3 Other analyses ...................................................................................................... 44
Secure Best Marks with AI Grader
Need help grading? Try our AI Grader for instant feedback on your assignments.
Page | 5
Background to the International Passenger Survey (IPS)
1 The International Passenger Survey
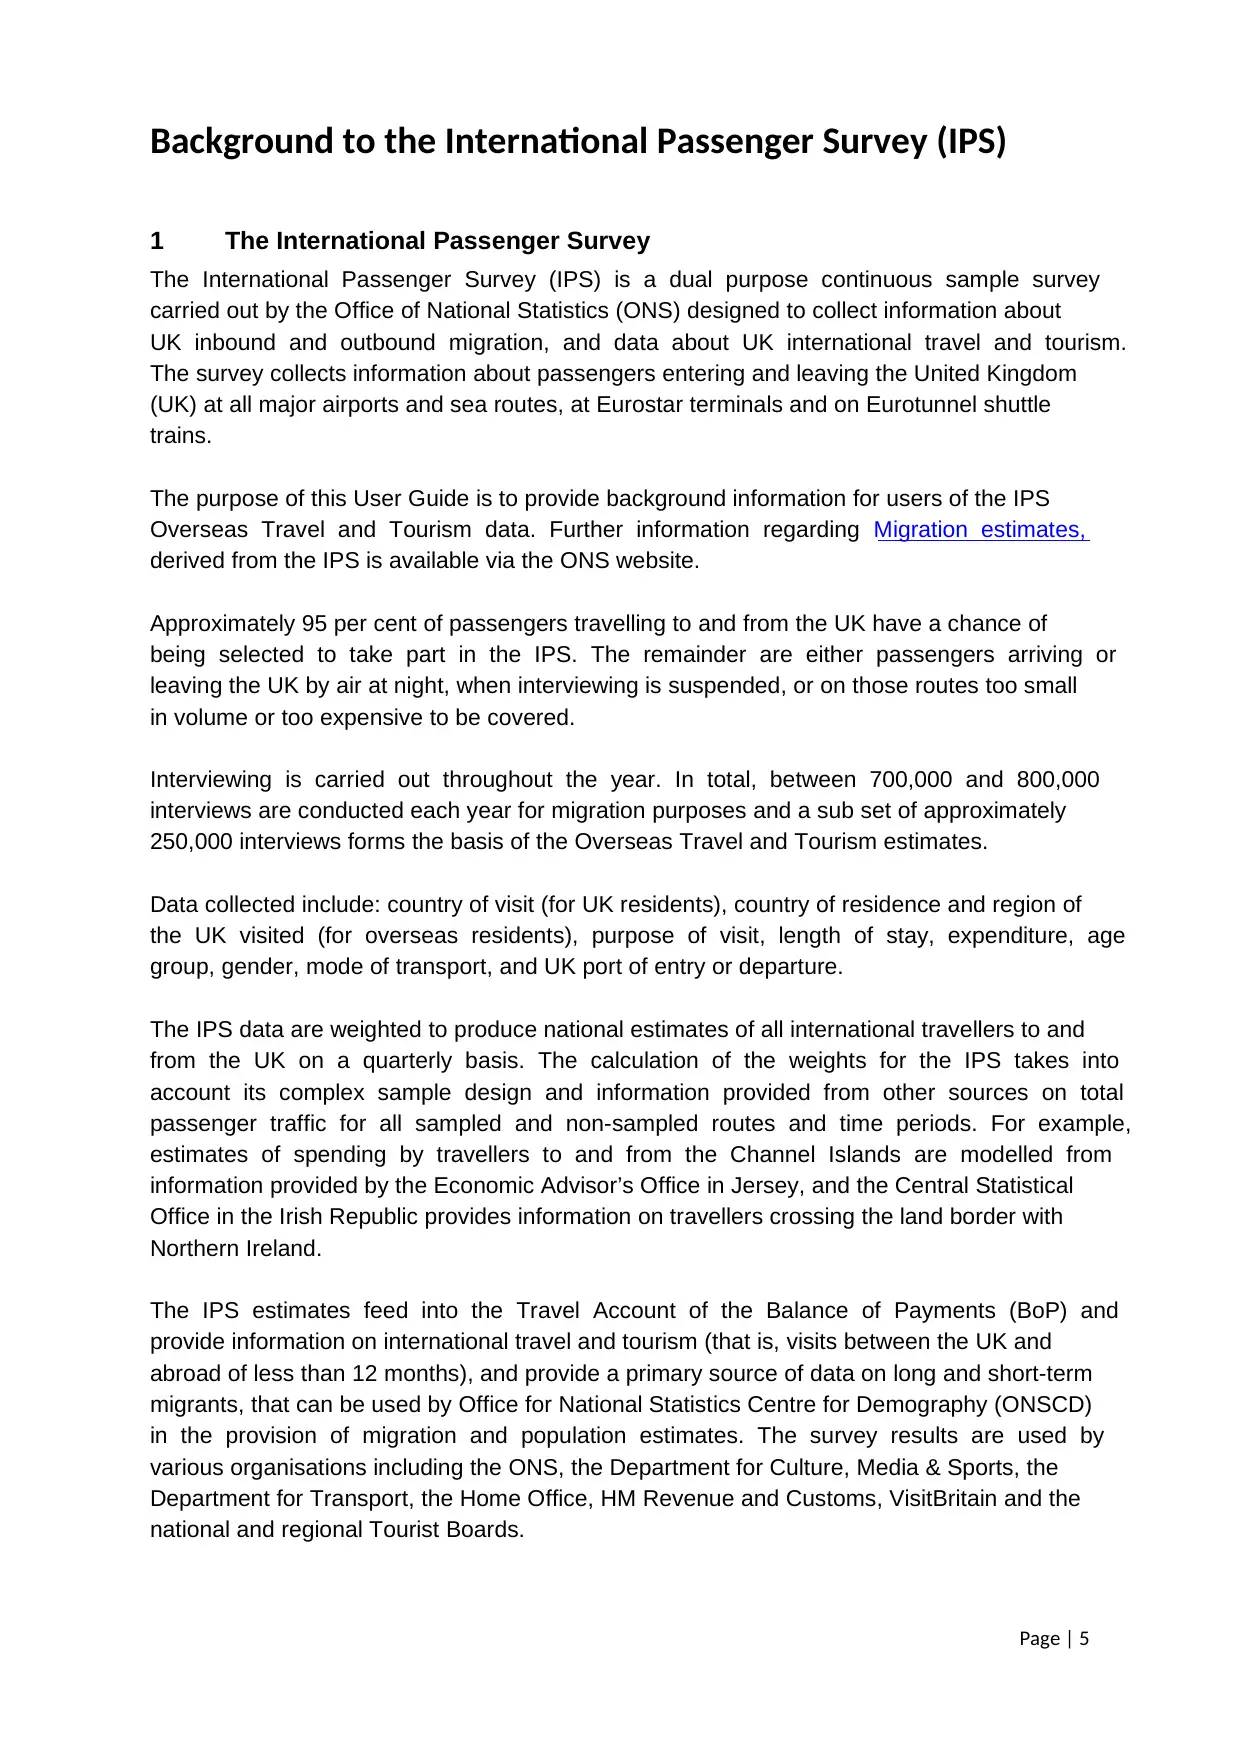
The International Passenger Survey (IPS) is a dual purpose continuous sample survey
carried out by the Office of National Statistics (ONS) designed to collect information about
UK inbound and outbound migration, and data about UK international travel and tourism.
The survey collects information about passengers entering and leaving the United Kingdom
(UK) at all major airports and sea routes, at Eurostar terminals and on Eurotunnel shuttle
trains.
The purpose of this User Guide is to provide background information for users of the IPS
Overseas Travel and Tourism data. Further information regarding Migration estimates,
derived from the IPS is available via the ONS website.
Approximately 95 per cent of passengers travelling to and from the UK have a chance of
being selected to take part in the IPS. The remainder are either passengers arriving or
leaving the UK by air at night, when interviewing is suspended, or on those routes too small
in volume or too expensive to be covered.
Interviewing is carried out throughout the year. In total, between 700,000 and 800,000
interviews are conducted each year for migration purposes and a sub set of approximately
250,000 interviews forms the basis of the Overseas Travel and Tourism estimates.
Data collected include: country of visit (for UK residents), country of residence and region of
the UK visited (for overseas residents), purpose of visit, length of stay, expenditure, age
group, gender, mode of transport, and UK port of entry or departure.
The IPS data are weighted to produce national estimates of all international travellers to and
from the UK on a quarterly basis. The calculation of the weights for the IPS takes into
account its complex sample design and information provided from other sources on total
passenger traffic for all sampled and non-sampled routes and time periods. For example,
estimates of spending by travellers to and from the Channel Islands are modelled from
information provided by the Economic Advisor’s Office in Jersey, and the Central Statistical
Office in the Irish Republic provides information on travellers crossing the land border with
Northern Ireland.
The IPS estimates feed into the Travel Account of the Balance of Payments (BoP) and
provide information on international travel and tourism (that is, visits between the UK and
abroad of less than 12 months), and provide a primary source of data on long and short-term
migrants, that can be used by Office for National Statistics Centre for Demography (ONSCD)
in the provision of migration and population estimates. The survey results are used by
various organisations including the ONS, the Department for Culture, Media & Sports, the
Department for Transport, the Home Office, HM Revenue and Customs, VisitBritain and the
national and regional Tourist Boards.
Background to the International Passenger Survey (IPS)
1 The International Passenger Survey
The International Passenger Survey (IPS) is a dual purpose continuous sample survey
carried out by the Office of National Statistics (ONS) designed to collect information about
UK inbound and outbound migration, and data about UK international travel and tourism.
The survey collects information about passengers entering and leaving the United Kingdom
(UK) at all major airports and sea routes, at Eurostar terminals and on Eurotunnel shuttle
trains.
The purpose of this User Guide is to provide background information for users of the IPS
Overseas Travel and Tourism data. Further information regarding Migration estimates,
derived from the IPS is available via the ONS website.
Approximately 95 per cent of passengers travelling to and from the UK have a chance of
being selected to take part in the IPS. The remainder are either passengers arriving or
leaving the UK by air at night, when interviewing is suspended, or on those routes too small
in volume or too expensive to be covered.
Interviewing is carried out throughout the year. In total, between 700,000 and 800,000
interviews are conducted each year for migration purposes and a sub set of approximately
250,000 interviews forms the basis of the Overseas Travel and Tourism estimates.
Data collected include: country of visit (for UK residents), country of residence and region of
the UK visited (for overseas residents), purpose of visit, length of stay, expenditure, age
group, gender, mode of transport, and UK port of entry or departure.
The IPS data are weighted to produce national estimates of all international travellers to and
from the UK on a quarterly basis. The calculation of the weights for the IPS takes into
account its complex sample design and information provided from other sources on total
passenger traffic for all sampled and non-sampled routes and time periods. For example,
estimates of spending by travellers to and from the Channel Islands are modelled from
information provided by the Economic Advisor’s Office in Jersey, and the Central Statistical
Office in the Irish Republic provides information on travellers crossing the land border with
Northern Ireland.
The IPS estimates feed into the Travel Account of the Balance of Payments (BoP) and
provide information on international travel and tourism (that is, visits between the UK and
abroad of less than 12 months), and provide a primary source of data on long and short-term
migrants, that can be used by Office for National Statistics Centre for Demography (ONSCD)
in the provision of migration and population estimates. The survey results are used by
various organisations including the ONS, the Department for Culture, Media & Sports, the
Department for Transport, the Home Office, HM Revenue and Customs, VisitBritain and the
national and regional Tourist Boards.
Page | 6
Provisional monthly Overseas Travel and Tourism estimates are available six weeks after
the end of the fieldwork month; quarterly datasets are available four months after the end of
the quarter; and annual datasets are available approximately five months after the end of the
year. Annual national estimates are created by combining the four quarters of the year
together. The monthly estimates provide a limited overview of the number of visits to and
from the UK and the expenditure associated with these visits, however, a single quarter is
the minimum period over which most detailed analyses of the data can be made. The
monthly and quarterly releases are provisional estimates because the data is subject to
revision during the quarterly and annual production (see the IPS revisions policy for more
details).
2 History of the IPS
The International Passenger Survey (IPS) celebrated its 50th anniversary in 20101. Its
inception in 1961 was reported in the then Board of Trade Journal as follows:
‘A new regular sample survey of sea and air passengers travelling between the United
Kingdom and the continent of Europe, and on the long air routes beyond Europe, was
introduced by the Government Social Survey on behalf of the Board of Trade during 1961
and 1962. This new system of interviewing a small proportion (up to 4 percent on some
routes) of travellers has enabled the important contribution made by tourist and other
travellers to the balance of payments to be measured without interfering with the free flow of
passengers at our sea and air ports. Nine out of ten of those approached attempted to give
all the information asked of them, and more than 80 per cent were able to make an estimate
of their expenditure whilst abroad. Over 150,000 successful interviews were made during the
year2.’
Since then, the IPS has been, and continues to be, a key source of primary data related to
international travel. The salient features of the surveys’ evolution are shown in the following
timeline.
1 ‘Celebrating 50 years of the International Passenger Survey’, Travel Trends 2010
2 Board of Trade Journal, Volume 185 July December, 1963‐
Page | 7
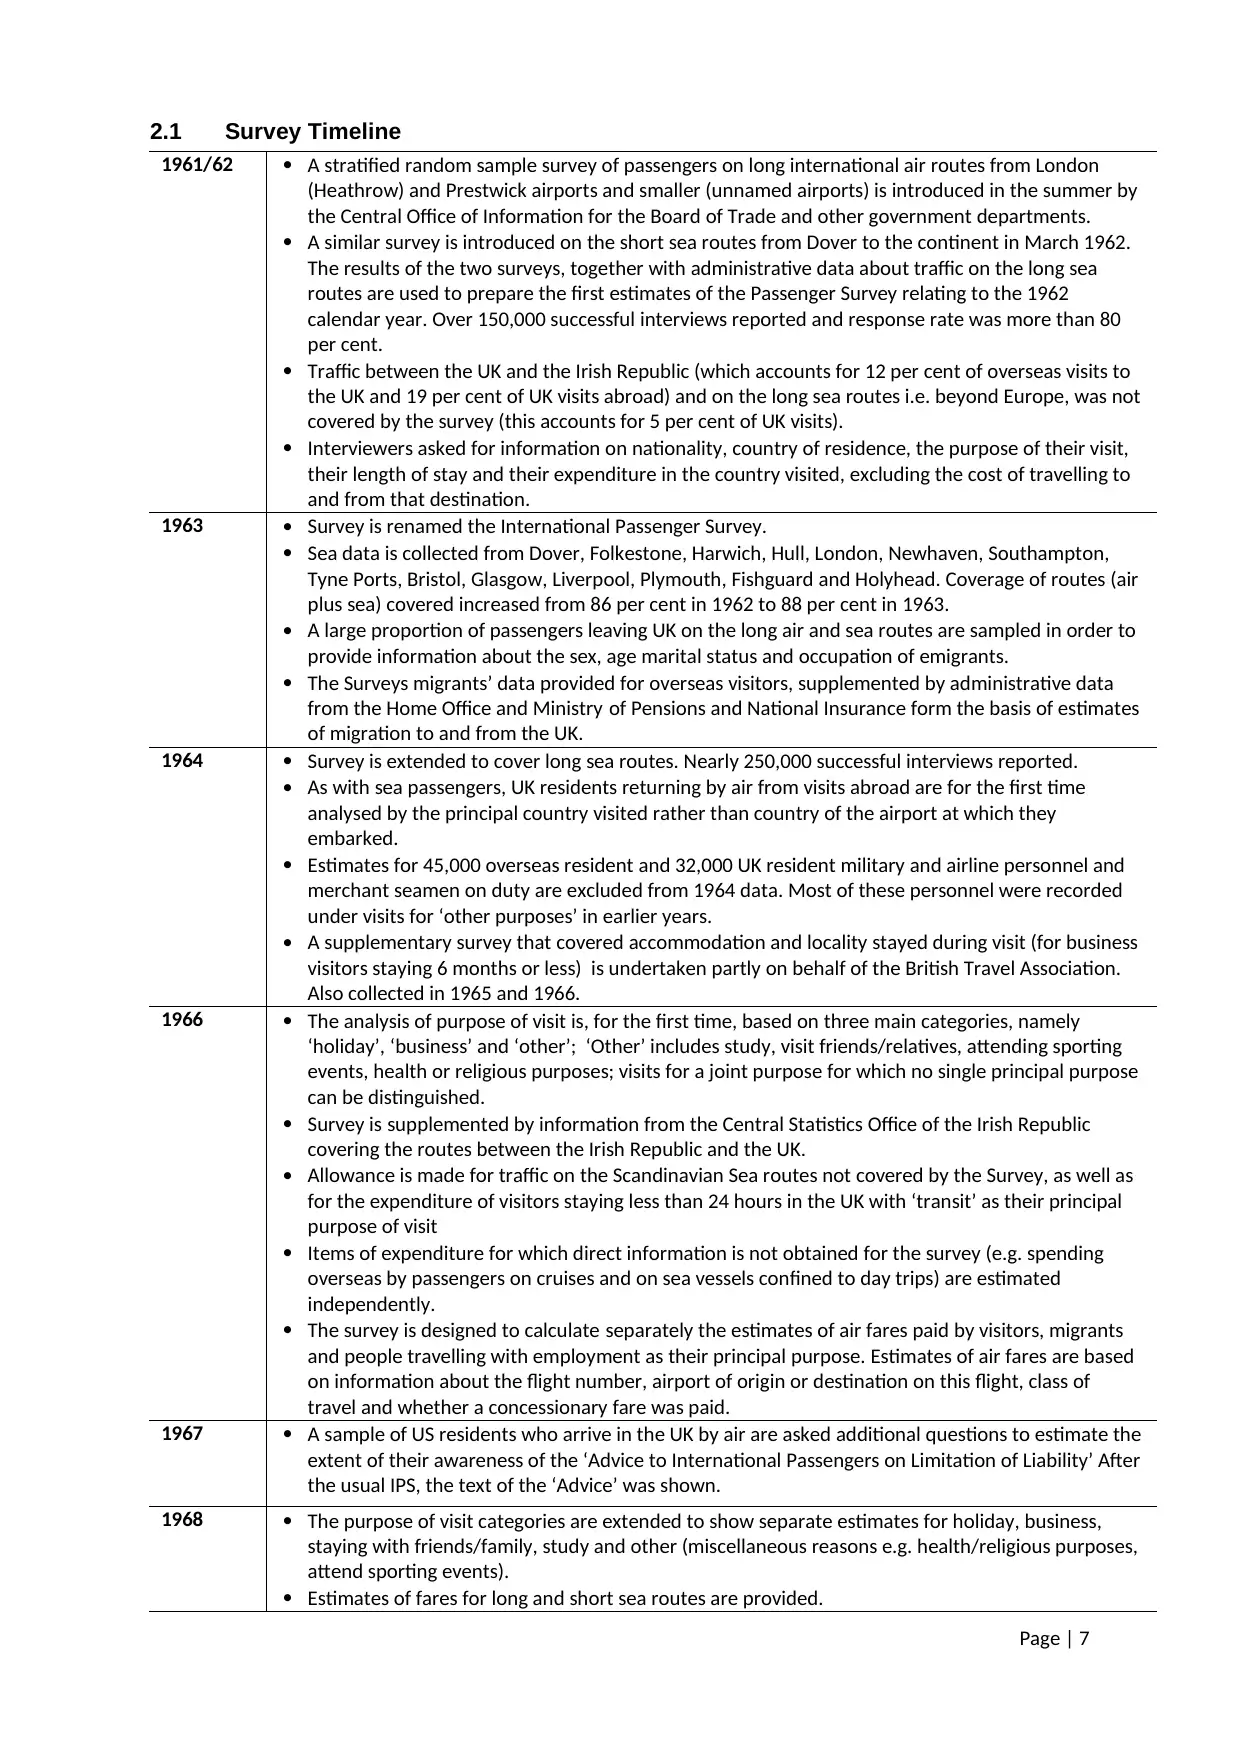
2.1 Survey Timeline
1961/62 A stratified random sample survey of passengers on long international air routes from London
(Heathrow) and Prestwick airports and smaller (unnamed airports) is introduced in the summer by
the Central Office of Information for the Board of Trade and other government departments.
A similar survey is introduced on the short sea routes from Dover to the continent in March 1962.
The results of the two surveys, together with administrative data about traffic on the long sea
routes are used to prepare the first estimates of the Passenger Survey relating to the 1962
calendar year. Over 150,000 successful interviews reported and response rate was more than 80
per cent.
Traffic between the UK and the Irish Republic (which accounts for 12 per cent of overseas visits to
the UK and 19 per cent of UK visits abroad) and on the long sea routes i.e. beyond Europe, was not
covered by the survey (this accounts for 5 per cent of UK visits).
Interviewers asked for information on nationality, country of residence, the purpose of their visit,
their length of stay and their expenditure in the country visited, excluding the cost of travelling to
and from that destination.
1963 Survey is renamed the International Passenger Survey.
Sea data is collected from Dover, Folkestone, Harwich, Hull, London, Newhaven, Southampton,
Tyne Ports, Bristol, Glasgow, Liverpool, Plymouth, Fishguard and Holyhead. Coverage of routes (air
plus sea) covered increased from 86 per cent in 1962 to 88 per cent in 1963.
A large proportion of passengers leaving UK on the long air and sea routes are sampled in order to
provide information about the sex, age marital status and occupation of emigrants.
The Surveys migrants’ data provided for overseas visitors, supplemented by administrative data
from the Home Office and Ministry of Pensions and National Insurance form the basis of estimates
of migration to and from the UK.
1964 Survey is extended to cover long sea routes. Nearly 250,000 successful interviews reported.
As with sea passengers, UK residents returning by air from visits abroad are for the first time
analysed by the principal country visited rather than country of the airport at which they
embarked.
Estimates for 45,000 overseas resident and 32,000 UK resident military and airline personnel and
merchant seamen on duty are excluded from 1964 data. Most of these personnel were recorded
under visits for ‘other purposes’ in earlier years.
A supplementary survey that covered accommodation and locality stayed during visit (for business
visitors staying 6 months or less) is undertaken partly on behalf of the British Travel Association.
Also collected in 1965 and 1966.
1966 The analysis of purpose of visit is, for the first time, based on three main categories, namely
‘holiday’, ‘business’ and ‘other’; ‘Other’ includes study, visit friends/relatives, attending sporting
events, health or religious purposes; visits for a joint purpose for which no single principal purpose
can be distinguished.
Survey is supplemented by information from the Central Statistics Office of the Irish Republic
covering the routes between the Irish Republic and the UK.
Allowance is made for traffic on the Scandinavian Sea routes not covered by the Survey, as well as
for the expenditure of visitors staying less than 24 hours in the UK with ‘transit’ as their principal
purpose of visit
Items of expenditure for which direct information is not obtained for the survey (e.g. spending
overseas by passengers on cruises and on sea vessels confined to day trips) are estimated
independently.
The survey is designed to calculate separately the estimates of air fares paid by visitors, migrants
and people travelling with employment as their principal purpose. Estimates of air fares are based
on information about the flight number, airport of origin or destination on this flight, class of
travel and whether a concessionary fare was paid.
1967 A sample of US residents who arrive in the UK by air are asked additional questions to estimate the
extent of their awareness of the ‘Advice to International Passengers on Limitation of Liability’ After
the usual IPS, the text of the ‘Advice’ was shown.
1968 The purpose of visit categories are extended to show separate estimates for holiday, business,
staying with friends/family, study and other (miscellaneous reasons e.g. health/religious purposes,
attend sporting events).
Estimates of fares for long and short sea routes are provided.
Paraphrase This Document
Need a fresh take? Get an instant paraphrase of this document with our AI Paraphraser
Page | 8
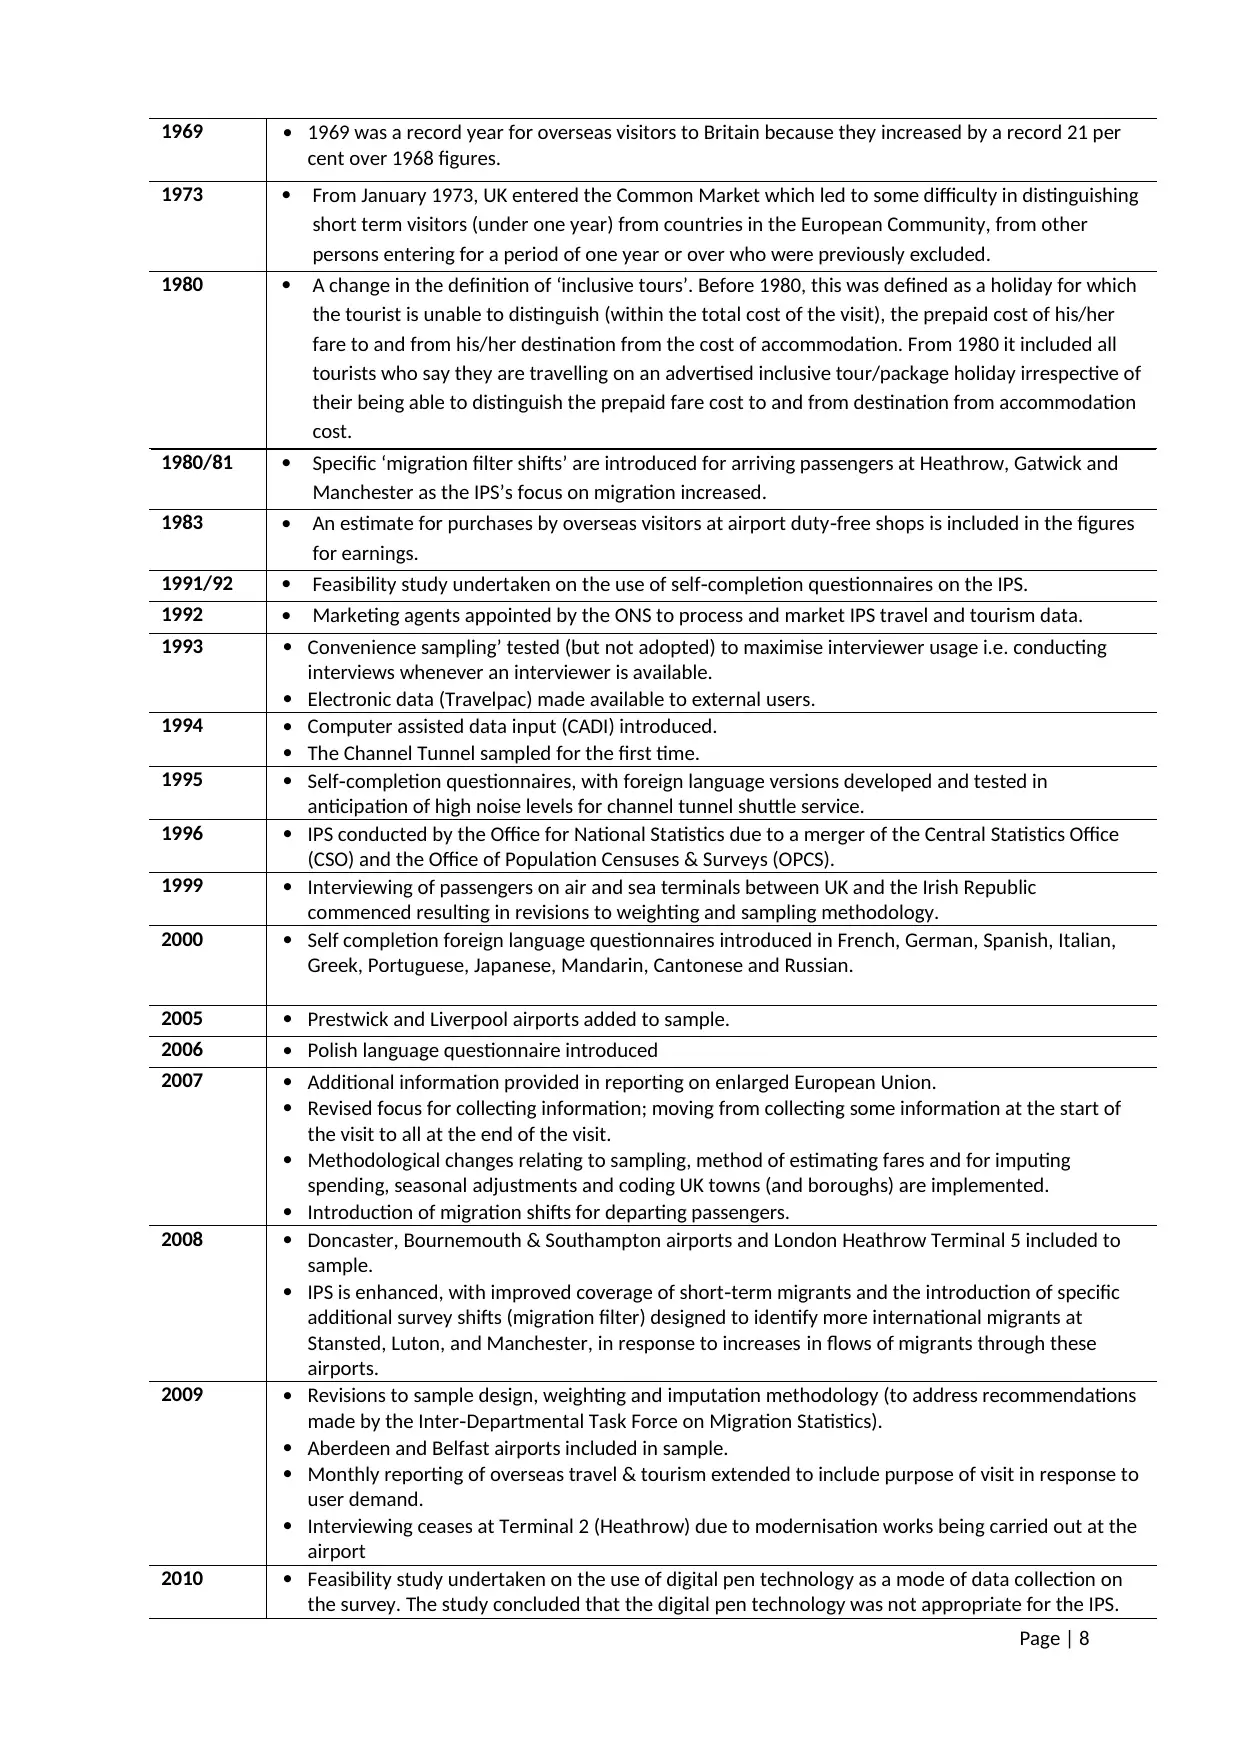
1969 1969 was a record year for overseas visitors to Britain because they increased by a record 21 per
cent over 1968 figures.
1973 From January 1973, UK entered the Common Market which led to some difficulty in distinguishing
short term visitors (under one year) from countries in the European Community, from other
persons entering for a period of one year or over who were previously excluded.
1980 A change in the definition of ‘inclusive tours’. Before 1980, this was defined as a holiday for which
the tourist is unable to distinguish (within the total cost of the visit), the prepaid cost of his/her
fare to and from his/her destination from the cost of accommodation. From 1980 it included all
tourists who say they are travelling on an advertised inclusive tour/package holiday irrespective of
their being able to distinguish the prepaid fare cost to and from destination from accommodation
cost.
1980/81 Specific ‘migration filter shifts’ are introduced for arriving passengers at Heathrow, Gatwick and
Manchester as the IPS’s focus on migration increased.
1983 An estimate for purchases by overseas visitors at airport duty free shops is included in the figures‐
for earnings.
1991/92 Feasibility study undertaken on the use of self completion questionnaires on the IPS.‐
1992 Marketing agents appointed by the ONS to process and market IPS travel and tourism data.
1993 Convenience sampling’ tested (but not adopted) to maximise interviewer usage i.e. conducting
interviews whenever an interviewer is available.
Electronic data (Travelpac) made available to external users.
1994 Computer assisted data input (CADI) introduced.
The Channel Tunnel sampled for the first time.
1995 Self completion questionnaires, with foreign language versions developed and tested in‐
anticipation of high noise levels for channel tunnel shuttle service.
1996 IPS conducted by the Office for National Statistics due to a merger of the Central Statistics Office
(CSO) and the Office of Population Censuses & Surveys (OPCS).
1999 Interviewing of passengers on air and sea terminals between UK and the Irish Republic
commenced resulting in revisions to weighting and sampling methodology.
2000 Self completion foreign language questionnaires introduced in French, German, Spanish, Italian,
Greek, Portuguese, Japanese, Mandarin, Cantonese and Russian.
2005 Prestwick and Liverpool airports added to sample.
2006 Polish language questionnaire introduced
2007 Additional information provided in reporting on enlarged European Union.
Revised focus for collecting information; moving from collecting some information at the start of
the visit to all at the end of the visit.
Methodological changes relating to sampling, method of estimating fares and for imputing
spending, seasonal adjustments and coding UK towns (and boroughs) are implemented.
Introduction of migration shifts for departing passengers.
2008 Doncaster, Bournemouth & Southampton airports and London Heathrow Terminal 5 included to
sample.
IPS is enhanced, with improved coverage of short term migrants and the introduction of specific‐
additional survey shifts (migration filter) designed to identify more international migrants at
Stansted, Luton, and Manchester, in response to increases in flows of migrants through these
airports.
2009 Revisions to sample design, weighting and imputation methodology (to address recommendations
made by the Inter Departmental Task Force on Migration Statistics).‐
Aberdeen and Belfast airports included in sample.
Monthly reporting of overseas travel & tourism extended to include purpose of visit in response to
user demand.
Interviewing ceases at Terminal 2 (Heathrow) due to modernisation works being carried out at the
airport
2010 Feasibility study undertaken on the use of digital pen technology as a mode of data collection on
the survey. The study concluded that the digital pen technology was not appropriate for the IPS.

Page | 9
2011 Sample optimisation carried out.
2012 The IPS adapted its design to produce an accurate estimate of the number of visits to the
Olympic/Paralympic Games by overseas residents.
2013 Croatia joined the EU in July 2013.
Monthly and quarterly Overseas Travel and Tourism publications retitled to indicate the
provisional nature of the estimates.
Page | 10
3 Primary purpose, users and uses of the IPS Overseas Travel and
Tourism data
3.1 Primary purpose
The primary purposes of the IPS Overseas Travel and Tourism data are to:
measure the impact of travel expenditure on the UK economy
provide information on international travel and tourism, and in particular to monitor
change overtime
3.2 Users of IPS Overseas Travel and Tourism data
International travel and tourism estimates from the IPS are required by the following
sponsors:
Office for National Statistics
Department of Culture, Media and Sport (DCMS)
Department for Transport (DfT)
Scottish Government
Welsh Government
HM Revenue and Customs (HMRC)
Additional sponsorship is provided by VisitBritain, VisitWales and VisitScotland, the
organisations responsible for marketing tourism in Great Britain, Scotland and Wales,
respectively.
These data are also used by the Bank of England, including the Monetary Policy Committee,
Her Majesty's Treasury (HMT) and the Office for Budget Responsibility (OBR).
The Civil Aviation Authority (CAA), British Airways, EuroStar and travel and tourism
operators and organisations within and outside the United Kingdom are among regular
users. Other users include Public Health England (PHE) and the National Travel Health
Network & Centre.
Researchers, students, consultants, the media, business organisations and the general
public make use of the IPS. Quarterly and annual Overseas Travel & Tourism datasets are
deposited at the UK Data Archive. The Economic and Social Data Service (ESDS) promotes
and supports the use of this data in research and teaching and by providing user support
and training. An ESDS report on the usage of the IPS, which is based on information from
users who have downloaded OTT datasets, suggests that the IPS is widely used by a range
of academics.
European Commission (EC) or European Union (EU) regulations dictate that the UK provide
Tourism Statistics (EC Regulation 692/2011) to EuroStat. The UK is required to collect and
report the value of UK travel services and provide international migration statistics (EU
Regulation 862/2007). The IPS fulfils these statutory requirements by providing this unique
set of data.
Secure Best Marks with AI Grader
Need help grading? Try our AI Grader for instant feedback on your assignments.
Page | 11
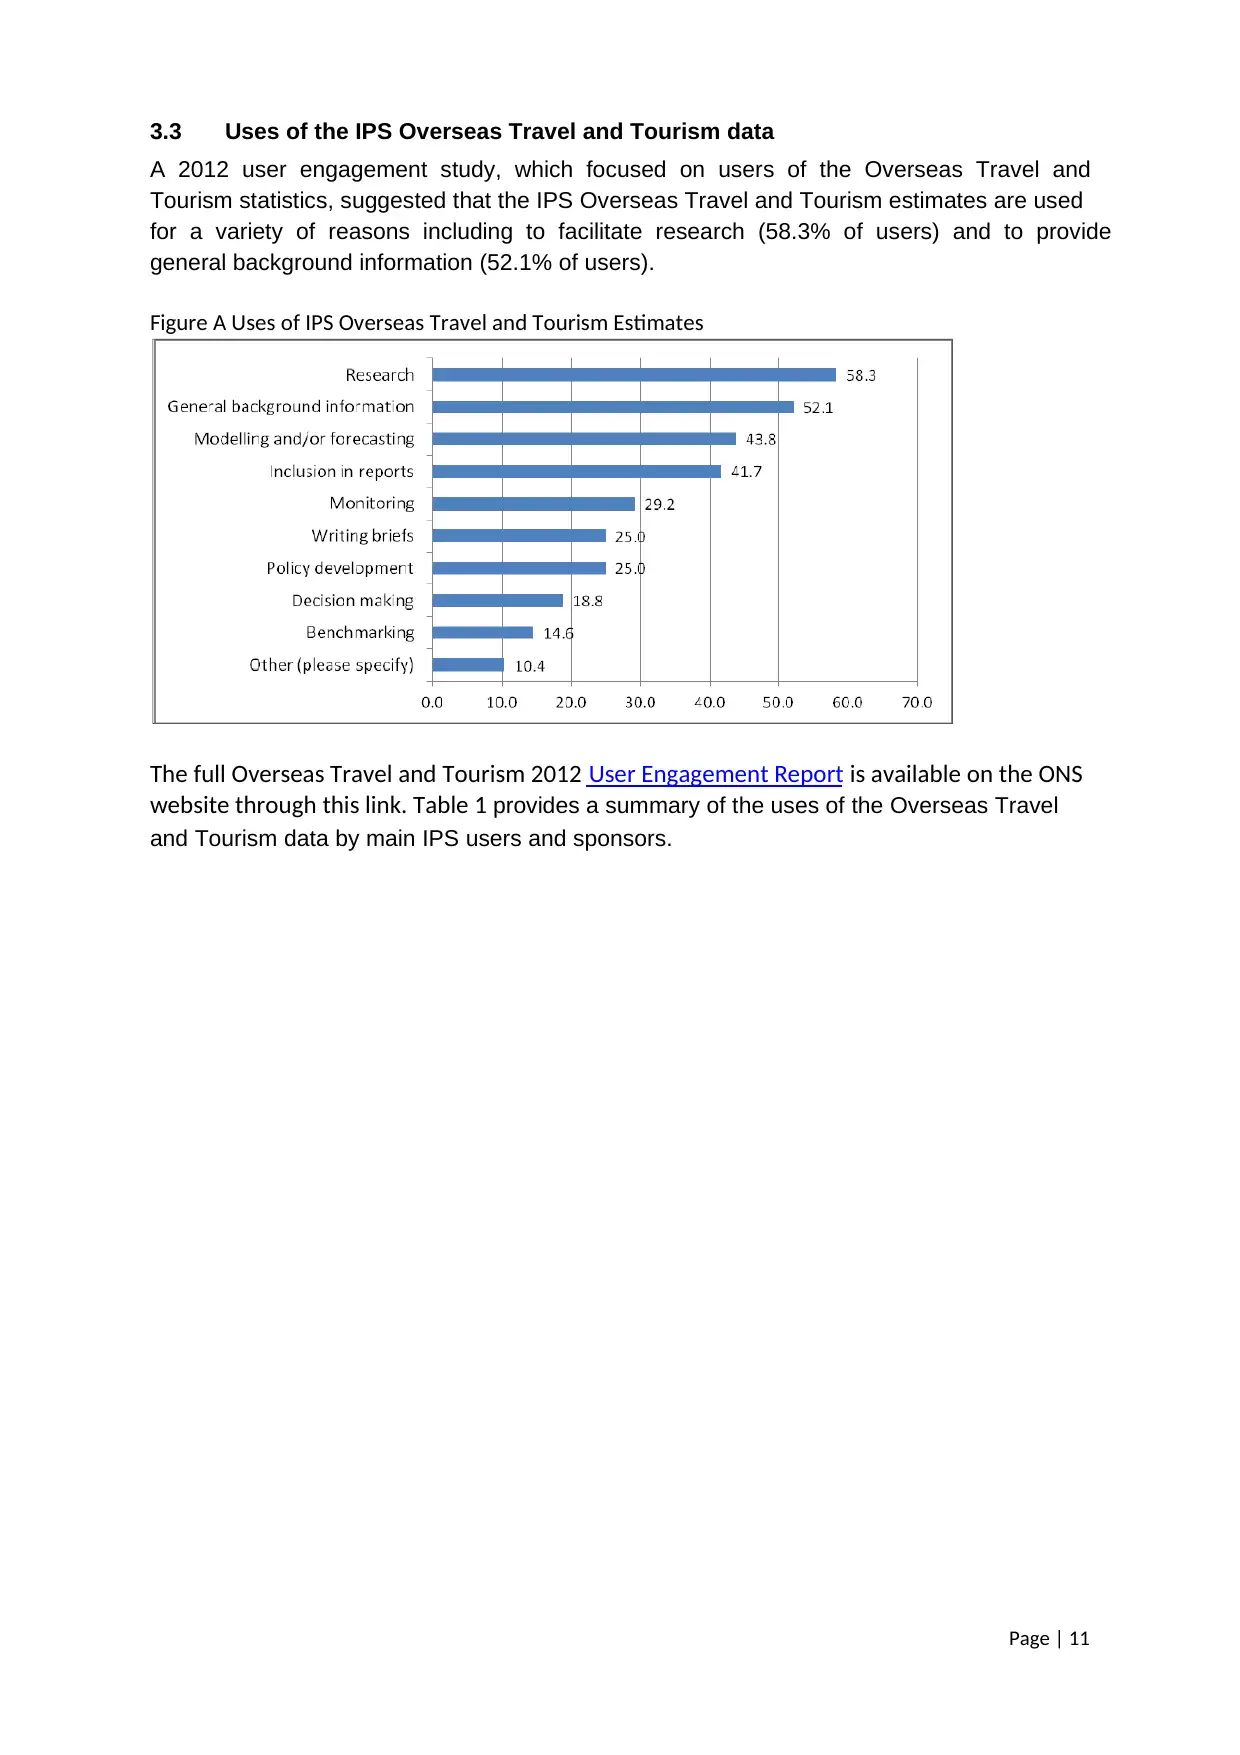
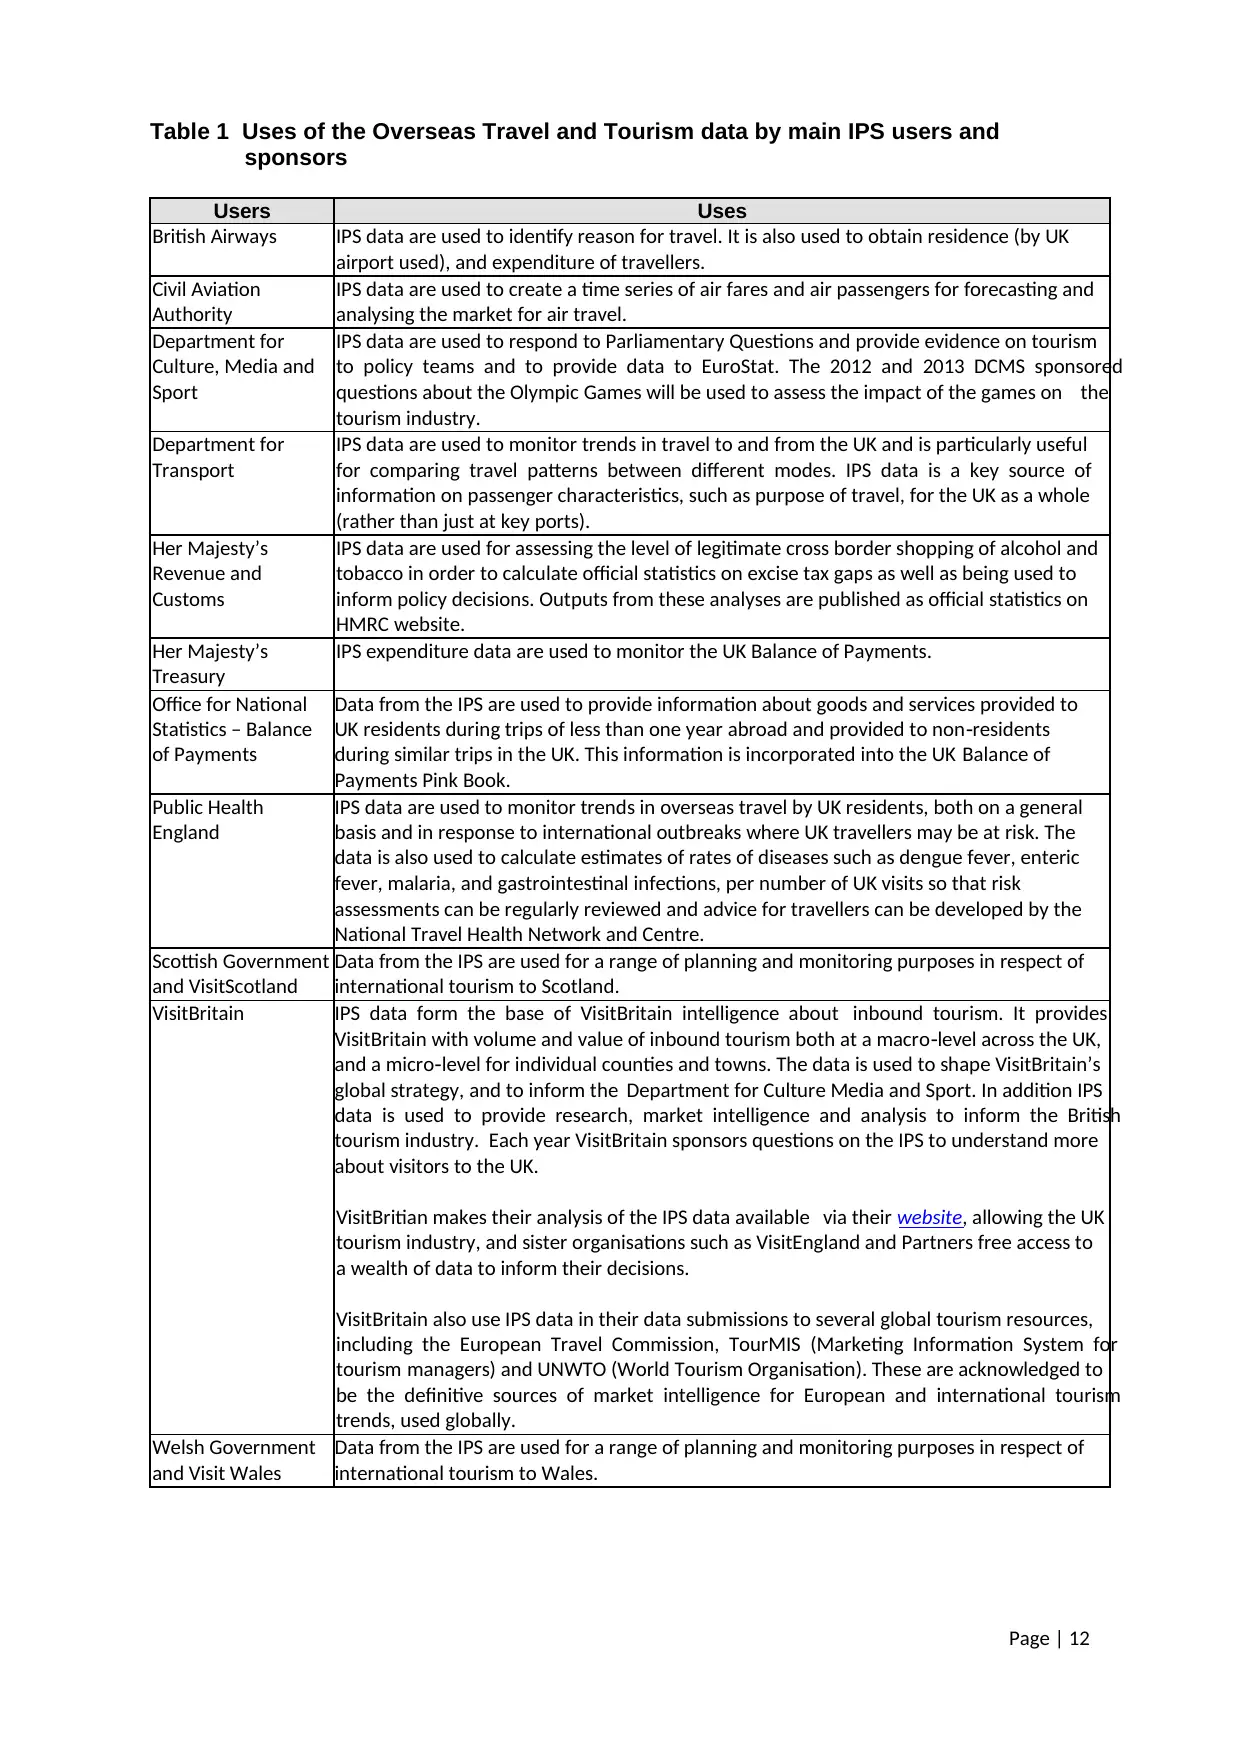
3.3 Uses of the IPS Overseas Travel and Tourism data
A 2012 user engagement study, which focused on users of the Overseas Travel and
Tourism statistics, suggested that the IPS Overseas Travel and Tourism estimates are used
for a variety of reasons including to facilitate research (58.3% of users) and to provide
general background information (52.1% of users).
Figure A Uses of IPS Overseas Travel and Tourism Estimates
The full Overseas Travel and Tourism 2012 User Engagement Report is available on the ONS
website through this link. Table 1 provides a summary of the uses of the Overseas Travel
and Tourism data by main IPS users and sponsors.
Page | 12
Table 1 Uses of the Overseas Travel and Tourism data by main IPS users and
sponsors
Users Uses
British Airways IPS data are used to identify reason for travel. It is also used to obtain residence (by UK
airport used), and expenditure of travellers.
Civil Aviation
Authority
IPS data are used to create a time series of air fares and air passengers for forecasting and
analysing the market for air travel.
Department for
Culture, Media and
Sport
IPS data are used to respond to Parliamentary Questions and provide evidence on tourism
to policy teams and to provide data to EuroStat. The 2012 and 2013 DCMS sponsored
questions about the Olympic Games will be used to assess the impact of the games on the
tourism industry.
Department for
Transport
IPS data are used to monitor trends in travel to and from the UK and is particularly useful
for comparing travel patterns between different modes. IPS data is a key source of
information on passenger characteristics, such as purpose of travel, for the UK as a whole
(rather than just at key ports).
Her Majesty’s
Revenue and
Customs
IPS data are used for assessing the level of legitimate cross border shopping of alcohol and
tobacco in order to calculate official statistics on excise tax gaps as well as being used to
inform policy decisions. Outputs from these analyses are published as official statistics on
HMRC website.
Her Majesty’s
Treasury
IPS expenditure data are used to monitor the UK Balance of Payments.
Office for National
Statistics – Balance
of Payments
Data from the IPS are used to provide information about goods and services provided to
UK residents during trips of less than one year abroad and provided to non residents‐
during similar trips in the UK. This information is incorporated into the UK Balance of
Payments Pink Book.
Public Health
England
IPS data are used to monitor trends in overseas travel by UK residents, both on a general
basis and in response to international outbreaks where UK travellers may be at risk. The
data is also used to calculate estimates of rates of diseases such as dengue fever, enteric
fever, malaria, and gastrointestinal infections, per number of UK visits so that risk
assessments can be regularly reviewed and advice for travellers can be developed by the
National Travel Health Network and Centre.
Scottish Government
and VisitScotland
Data from the IPS are used for a range of planning and monitoring purposes in respect of
international tourism to Scotland.
VisitBritain IPS data form the base of VisitBritain intelligence about inbound tourism. It provides
VisitBritain with volume and value of inbound tourism both at a macro level across the UK,‐
and a micro level for individual counties and towns. The data is used to shape VisitBritain’s‐
global strategy, and to inform the Department for Culture Media and Sport. In addition IPS
data is used to provide research, market intelligence and analysis to inform the British
tourism industry. Each year VisitBritain sponsors questions on the IPS to understand more
about visitors to the UK.
VisitBritian makes their analysis of the IPS data available via their website, allowing the UK
tourism industry, and sister organisations such as VisitEngland and Partners free access to
a wealth of data to inform their decisions.
VisitBritain also use IPS data in their data submissions to several global tourism resources,
including the European Travel Commission, TourMIS (Marketing Information System for
tourism managers) and UNWTO (World Tourism Organisation). These are acknowledged to
be the definitive sources of market intelligence for European and international tourism
trends, used globally.
Welsh Government
and Visit Wales
Data from the IPS are used for a range of planning and monitoring purposes in respect of
international tourism to Wales.
Page | 13
3.4 Assessment of User Needs and Perceptions
User engagement is undertaken to identify gaps between key User needs and the estimates
provided by the survey, as well as a means of finding out Users’ views of the statistical
products. The views of the main external and internal ONS sponsors and stakeholders of the
IPS are regularly sought through the six-monthly IPS Steering Group consultation meetings.
Liaison meetings are also routinely held with internal stakeholders.
The survey questionnaire is reviewed annually and question sponsors are consulted and
changes are suggested, discussed, piloted and where acceptable, implemented as a result
of changing User demands or policy requirements.
ONS also strives to understand the wider User community. Recent actions to engage with
Users include: presentations given to the Transport Statistics User Group in September
2011 and 2013; a User satisfaction survey with Users of Overseas Travel and Tourism data
was carried out in December 2011 and a follow-up User engagement study undertaken in
February 2012; and a workshop, co-hosted with the Economic and Social Data Service
(ESDS), was held in June 2012 at the University of Manchester.
The Overseas Travel and Tourism 2012 User Engagement Report is available on the ONS
website along with an update on progress towards the recommendations.
Paraphrase This Document
Need a fresh take? Get an instant paraphrase of this document with our AI Paraphraser
Page | 14
Design and Data Collection
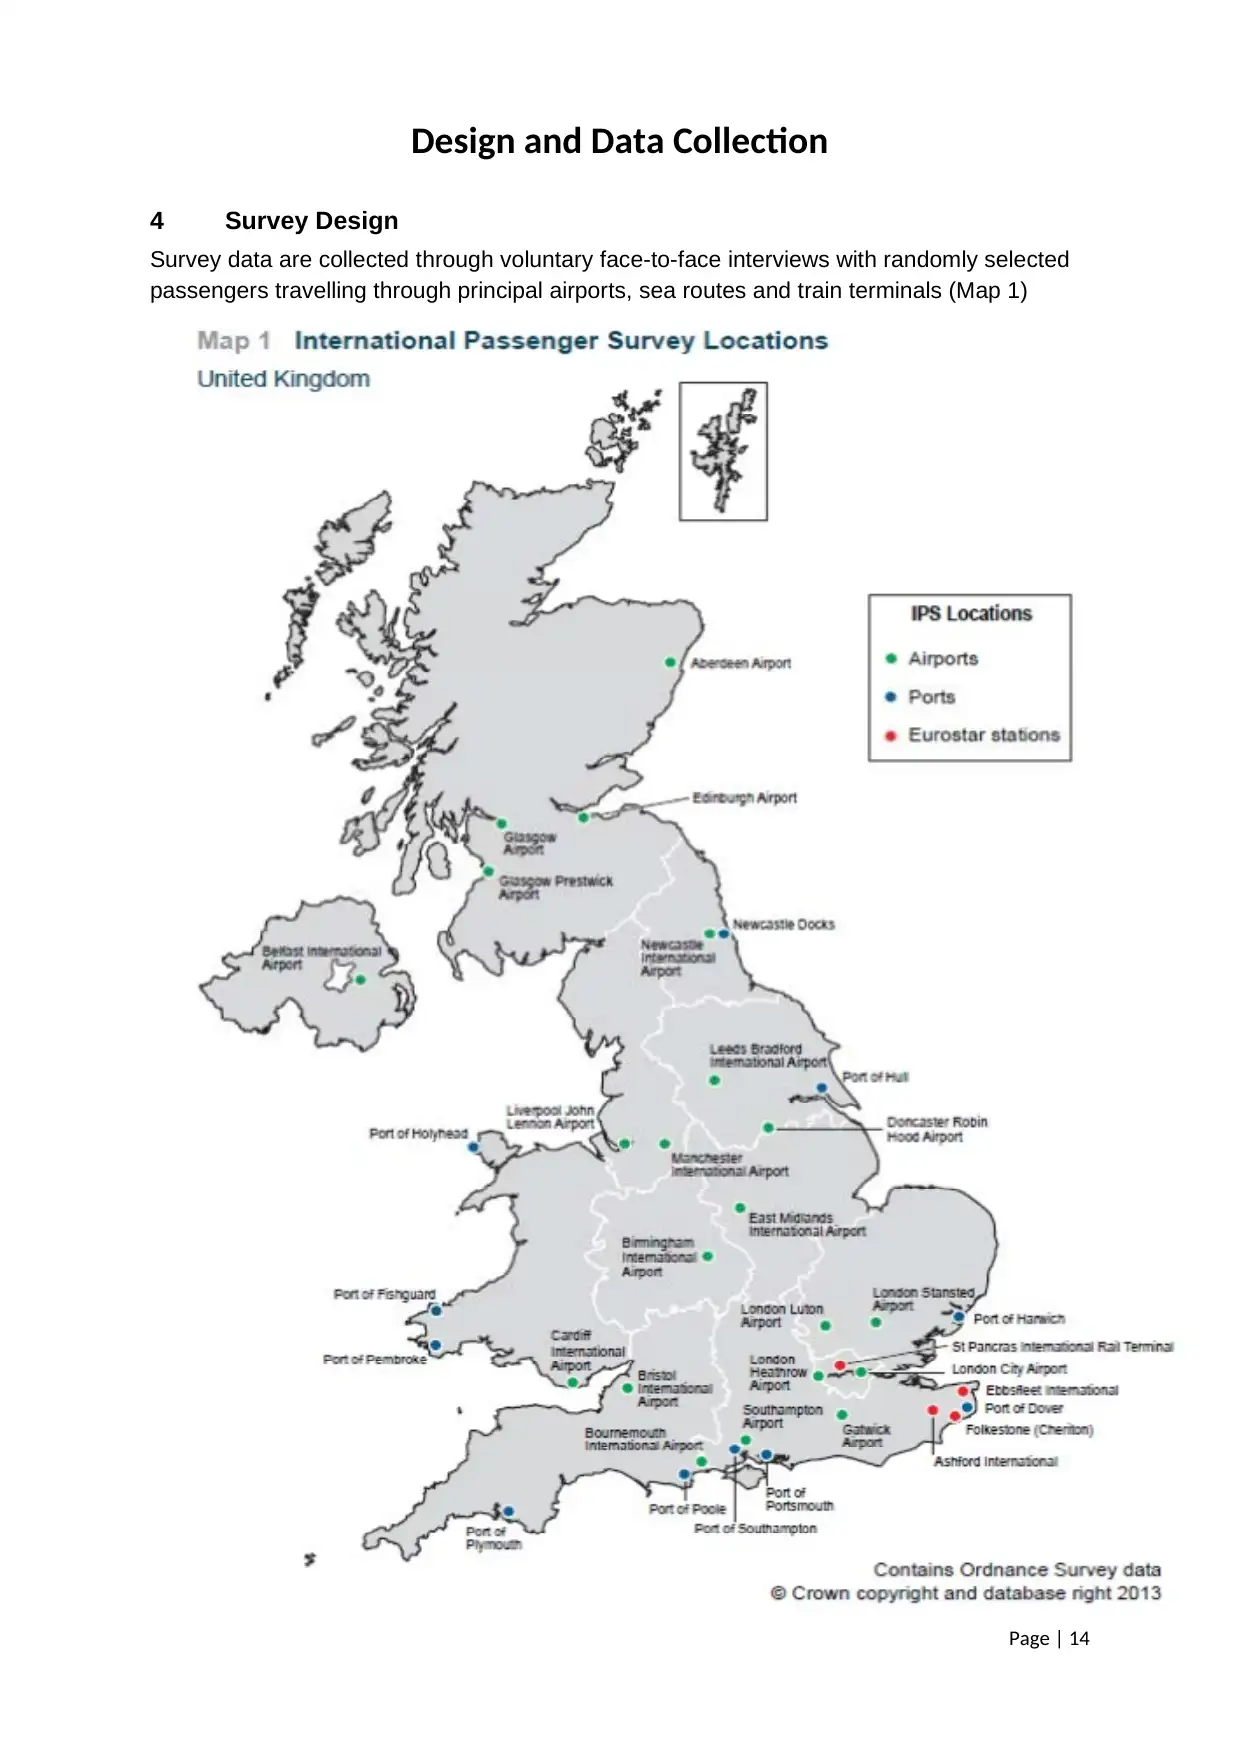
4 Survey Design
Survey data are collected through voluntary face-to-face interviews with randomly selected
passengers travelling through principal airports, sea routes and train terminals (Map 1)
Design and Data Collection
4 Survey Design
Survey data are collected through voluntary face-to-face interviews with randomly selected
passengers travelling through principal airports, sea routes and train terminals (Map 1)
Page | 15
Section 5 IPS Sampling design
The IPS sample is designed to be representative of passengers travelling to and from the
UK and to provide a robust measure of UK migration and travel and tourism. The achieved
sample comprises approximately 800,000 migrant screening interviews a year, of which over
250,000 are also used to produce estimates of Overseas Travel and Tourism patterns. This
large sample size allows reliable estimates to be produced for various groups of passengers
despite the low proportion of travellers interviewed.
The IPS incorporates the two sample requirements into a single sample design. The sample
is a two-stage design:
1. All eligible contacts are asked questions to identify whether they are migrating into or
out of the UK. If someone is identified as a migrant they are asked a migration trailer
questionnaire that collects information about their migration plans.
2. A pre-determined sub-sample of all eligible contacts are asked the Travel and
Tourism questionnaire.
The IPS sample is stratified to ensure it is representative by mode of travel (air, sea or
tunnel), port or route, and time of day. The frequency of sampling within each stratum is
determined according to the variability of tourist expenditure and interviewing cost
considerations. For example, where the expenditure quoted on a particular route varies
greatly across respondents, a higher sampling frequency is used to ensure that the
variability of expenditure is captured.
The IPS uses a multi-stage sample design which is carried out separately for air, sea and
tunnel travel. This involves randomly sampling a given port or entry/exit route on: (a) a given
day; (b) within a given time of the day (this is referred to as a ‘shift’); and then (c) within the
shift passengers are systematically selected at fixed intervals from a random start and
interviewed.
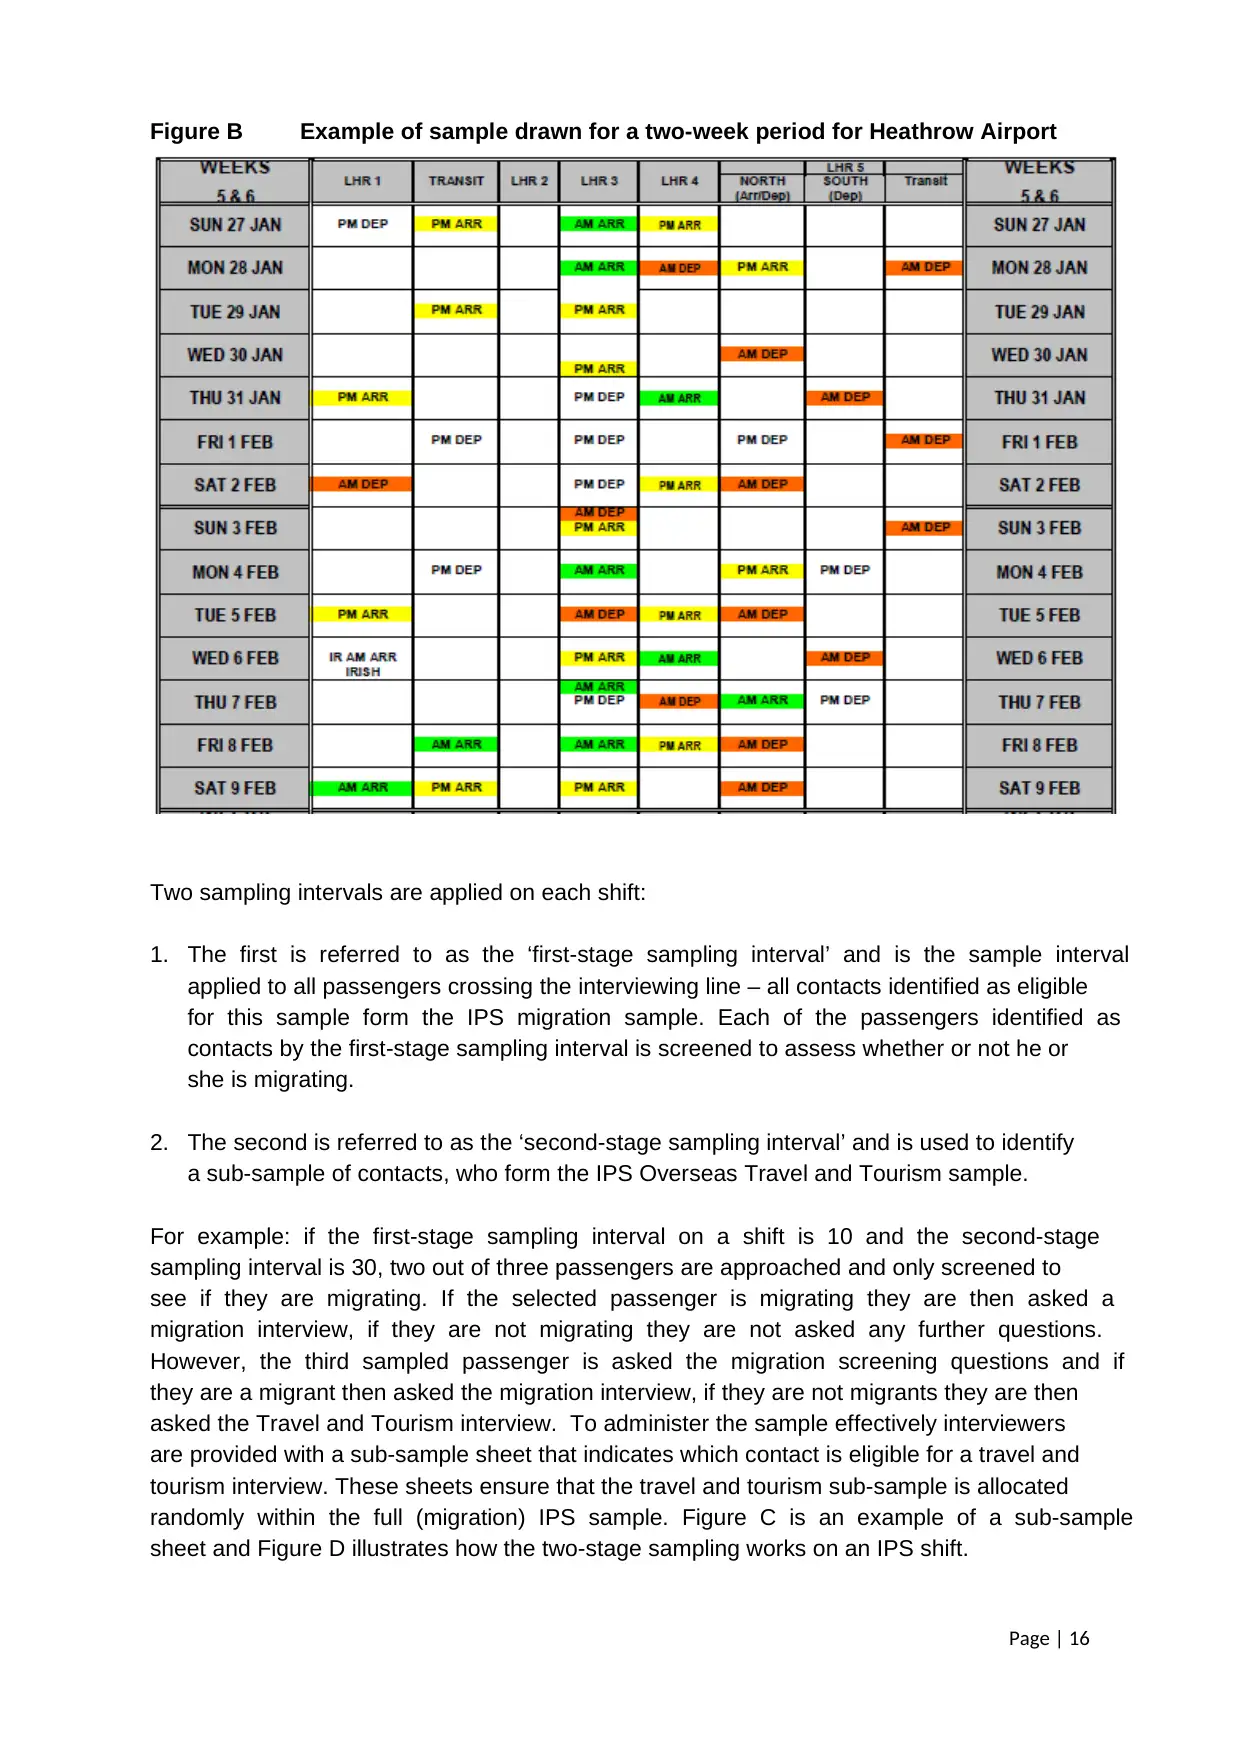
Figure B shows the sample drawn for a two-week period for Heathrow Airport. The sample
allocation (shifts) ensures that the IPS operates across different days of the week and at
different times of the day for arrival and departure passenger flows, during this time period.
There are two air shift times operating at all sampled airports: morning (typically 6am to
2pm) and afternoon (typically 2pm to 10pm); there is no data collection at airports during the
night (10pm – 6am). The sample design is additionally stratified by weekday/weekend to
ensure that the allocation of shifts reflects patterns in passenger traffic.
Section 5 IPS Sampling design
The IPS sample is designed to be representative of passengers travelling to and from the
UK and to provide a robust measure of UK migration and travel and tourism. The achieved
sample comprises approximately 800,000 migrant screening interviews a year, of which over
250,000 are also used to produce estimates of Overseas Travel and Tourism patterns. This
large sample size allows reliable estimates to be produced for various groups of passengers
despite the low proportion of travellers interviewed.
The IPS incorporates the two sample requirements into a single sample design. The sample
is a two-stage design:
1. All eligible contacts are asked questions to identify whether they are migrating into or
out of the UK. If someone is identified as a migrant they are asked a migration trailer
questionnaire that collects information about their migration plans.
2. A pre-determined sub-sample of all eligible contacts are asked the Travel and
Tourism questionnaire.
The IPS sample is stratified to ensure it is representative by mode of travel (air, sea or
tunnel), port or route, and time of day. The frequency of sampling within each stratum is
determined according to the variability of tourist expenditure and interviewing cost
considerations. For example, where the expenditure quoted on a particular route varies
greatly across respondents, a higher sampling frequency is used to ensure that the
variability of expenditure is captured.
The IPS uses a multi-stage sample design which is carried out separately for air, sea and
tunnel travel. This involves randomly sampling a given port or entry/exit route on: (a) a given
day; (b) within a given time of the day (this is referred to as a ‘shift’); and then (c) within the
shift passengers are systematically selected at fixed intervals from a random start and
interviewed.
Figure B shows the sample drawn for a two-week period for Heathrow Airport. The sample
allocation (shifts) ensures that the IPS operates across different days of the week and at
different times of the day for arrival and departure passenger flows, during this time period.
There are two air shift times operating at all sampled airports: morning (typically 6am to
2pm) and afternoon (typically 2pm to 10pm); there is no data collection at airports during the
night (10pm – 6am). The sample design is additionally stratified by weekday/weekend to
ensure that the allocation of shifts reflects patterns in passenger traffic.
Page | 16
Figure B Example of sample drawn for a two-week period for Heathrow Airport
Two sampling intervals are applied on each shift:
1. The first is referred to as the ‘first-stage sampling interval’ and is the sample interval
applied to all passengers crossing the interviewing line – all contacts identified as eligible
for this sample form the IPS migration sample. Each of the passengers identified as
contacts by the first-stage sampling interval is screened to assess whether or not he or
she is migrating.
2. The second is referred to as the ‘second-stage sampling interval’ and is used to identify
a sub-sample of contacts, who form the IPS Overseas Travel and Tourism sample.
For example: if the first-stage sampling interval on a shift is 10 and the second-stage
sampling interval is 30, two out of three passengers are approached and only screened to
see if they are migrating. If the selected passenger is migrating they are then asked a
migration interview, if they are not migrating they are not asked any further questions.
However, the third sampled passenger is asked the migration screening questions and if
they are a migrant then asked the migration interview, if they are not migrants they are then
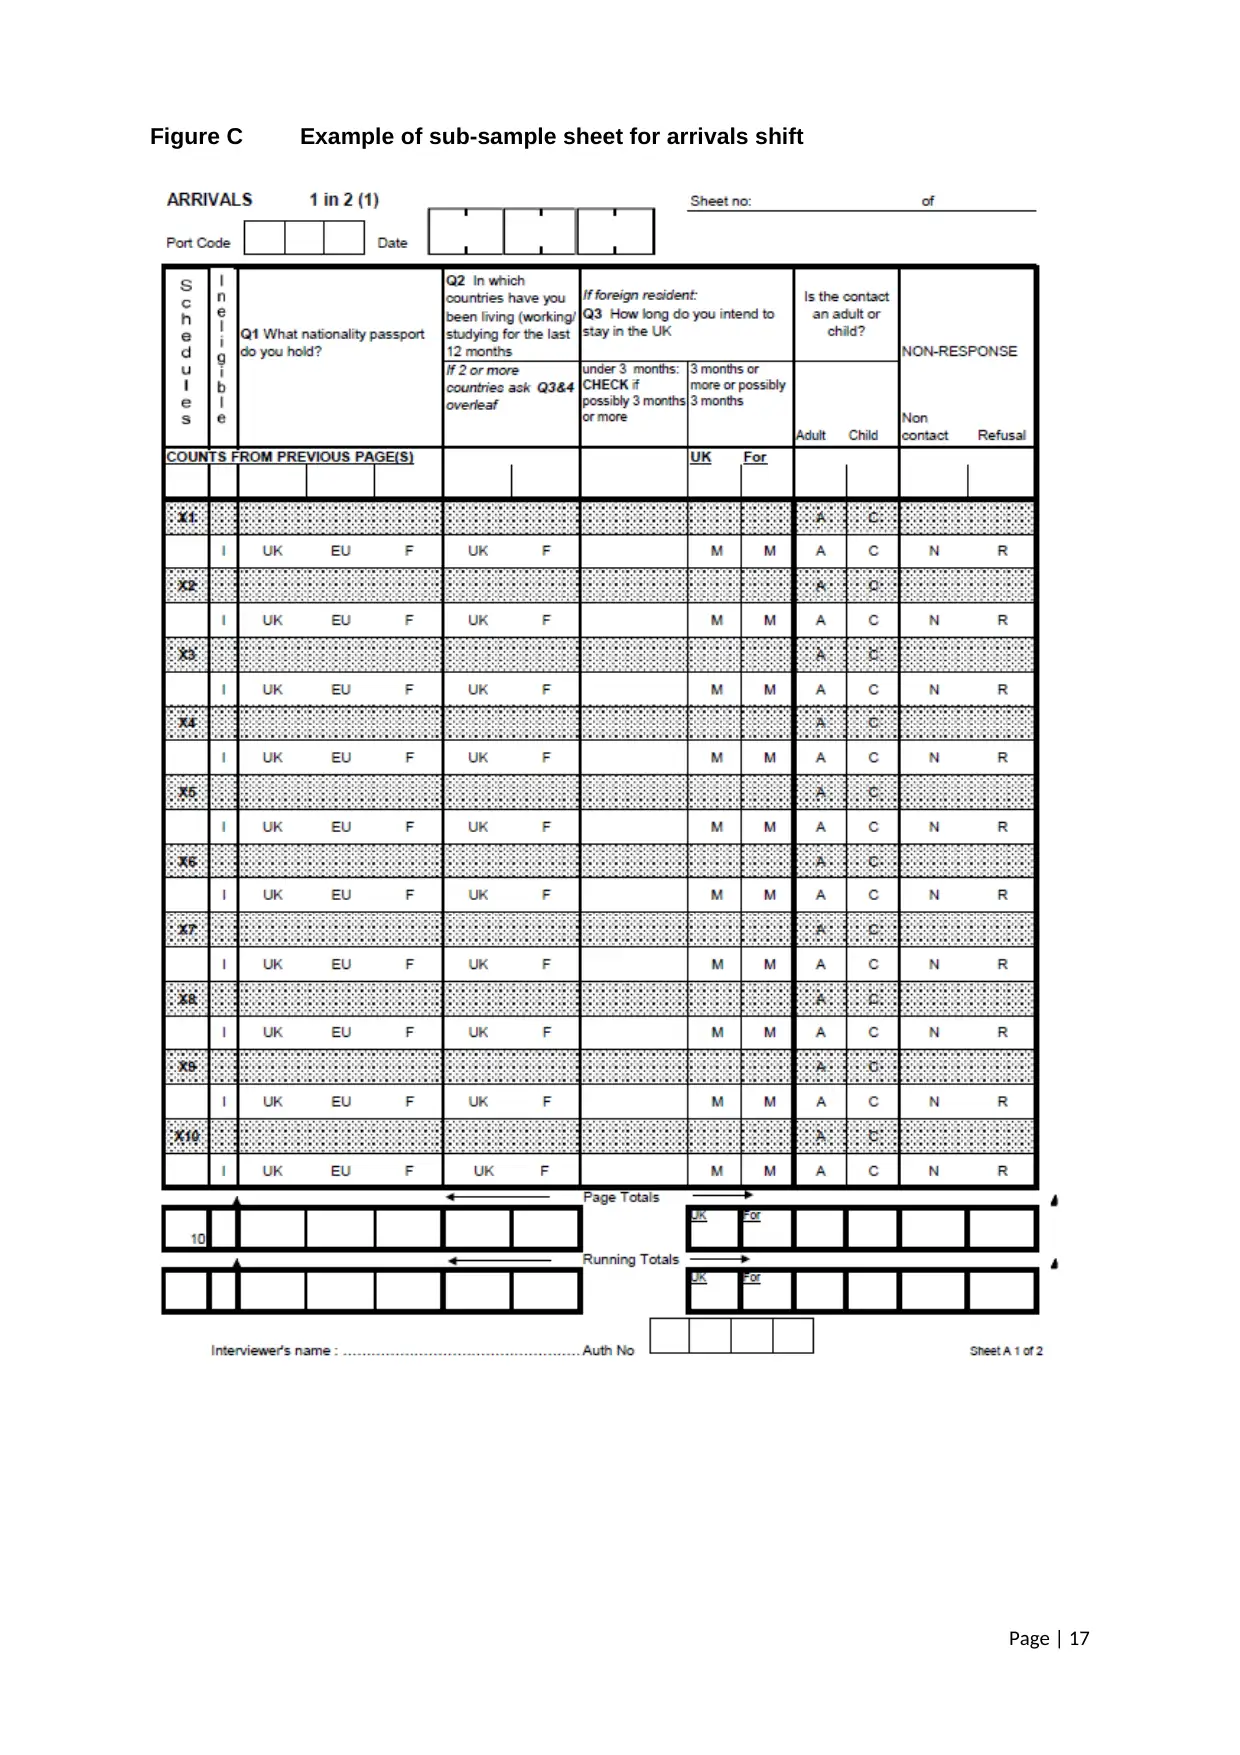
asked the Travel and Tourism interview. To administer the sample effectively interviewers
are provided with a sub-sample sheet that indicates which contact is eligible for a travel and
tourism interview. These sheets ensure that the travel and tourism sub-sample is allocated
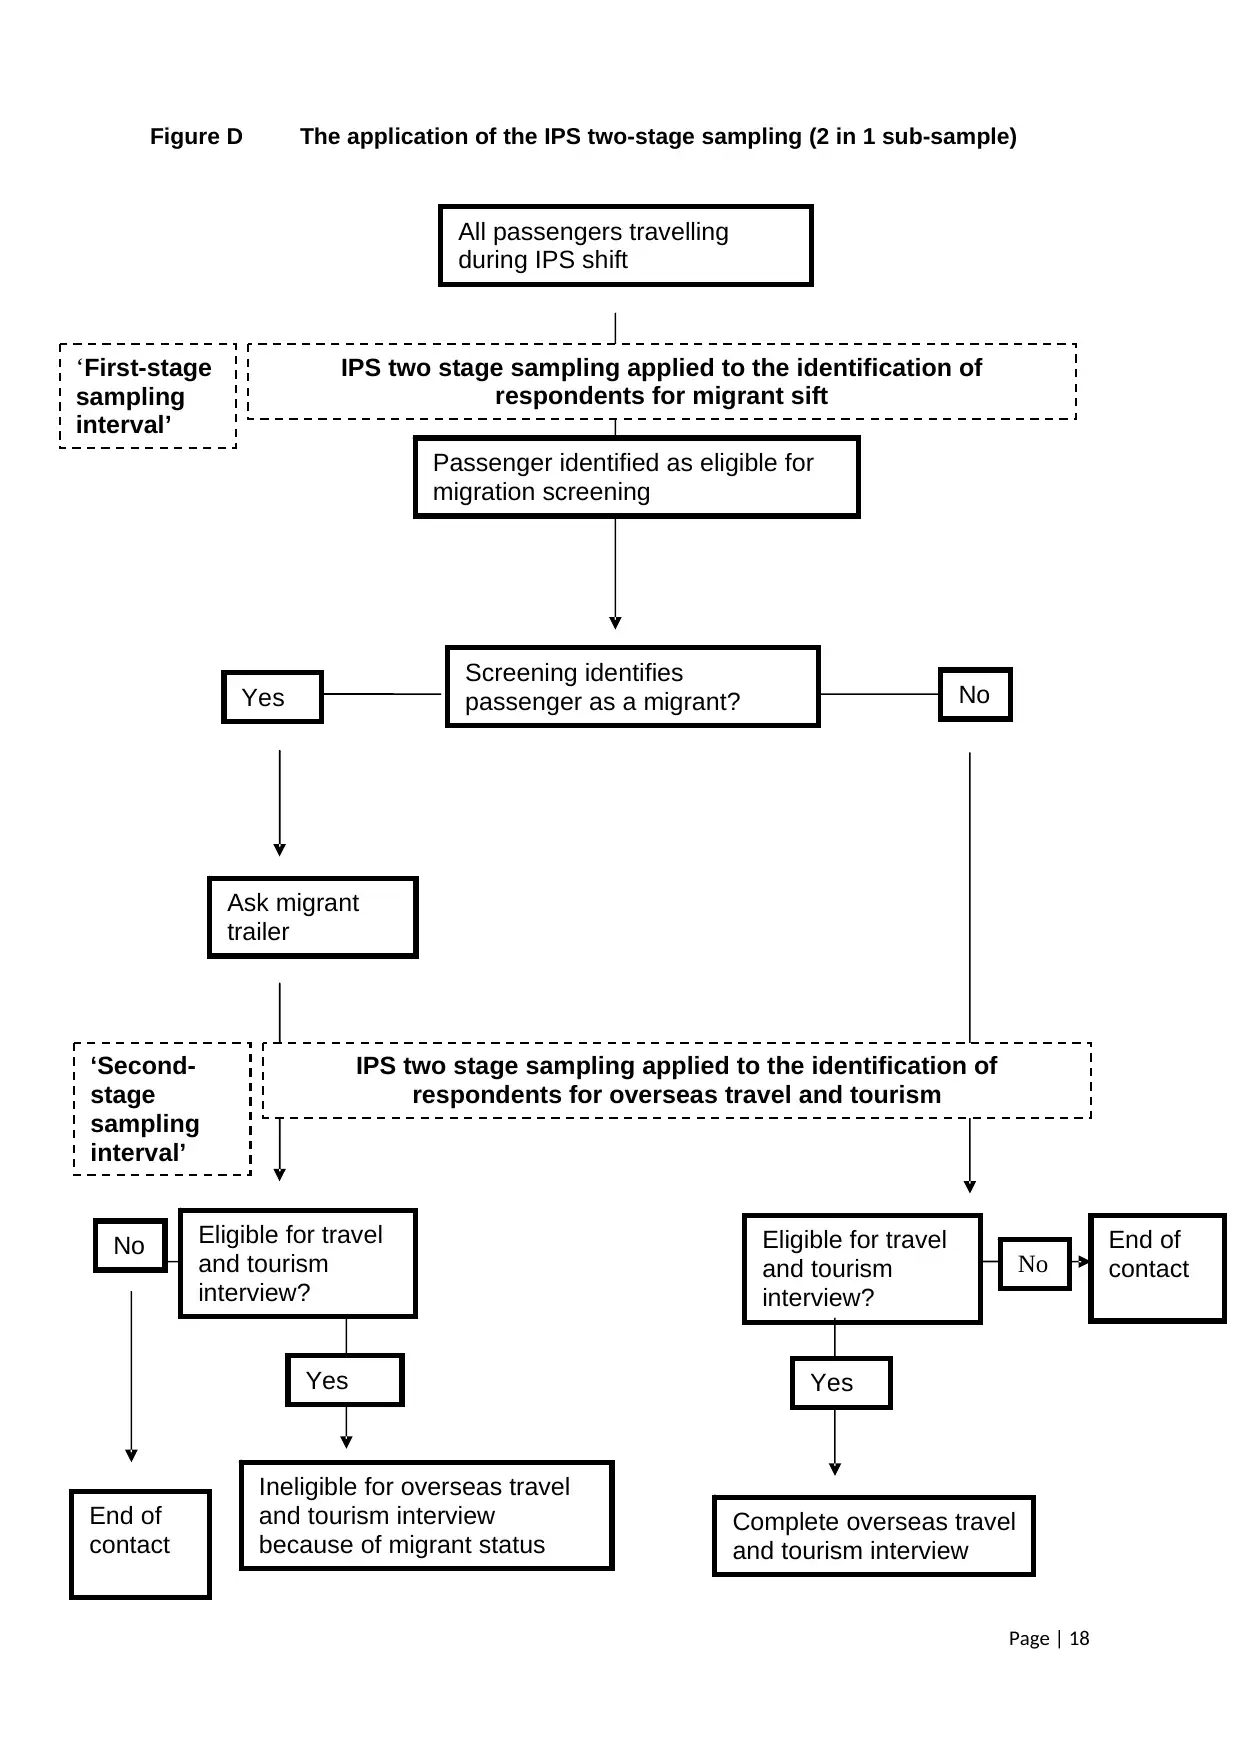
randomly within the full (migration) IPS sample. Figure C is an example of a sub-sample
sheet and Figure D illustrates how the two-stage sampling works on an IPS shift.
Figure B Example of sample drawn for a two-week period for Heathrow Airport
Two sampling intervals are applied on each shift:
1. The first is referred to as the ‘first-stage sampling interval’ and is the sample interval
applied to all passengers crossing the interviewing line – all contacts identified as eligible
for this sample form the IPS migration sample. Each of the passengers identified as
contacts by the first-stage sampling interval is screened to assess whether or not he or
she is migrating.
2. The second is referred to as the ‘second-stage sampling interval’ and is used to identify
a sub-sample of contacts, who form the IPS Overseas Travel and Tourism sample.
For example: if the first-stage sampling interval on a shift is 10 and the second-stage
sampling interval is 30, two out of three passengers are approached and only screened to
see if they are migrating. If the selected passenger is migrating they are then asked a
migration interview, if they are not migrating they are not asked any further questions.
However, the third sampled passenger is asked the migration screening questions and if
they are a migrant then asked the migration interview, if they are not migrants they are then
asked the Travel and Tourism interview. To administer the sample effectively interviewers
are provided with a sub-sample sheet that indicates which contact is eligible for a travel and
tourism interview. These sheets ensure that the travel and tourism sub-sample is allocated
randomly within the full (migration) IPS sample. Figure C is an example of a sub-sample
sheet and Figure D illustrates how the two-stage sampling works on an IPS shift.
Secure Best Marks with AI Grader
Need help grading? Try our AI Grader for instant feedback on your assignments.
Page | 17
Figure C Example of sub-sample sheet for arrivals shift
Figure C Example of sub-sample sheet for arrivals shift
Page | 18
Figure D The application of the IPS two-stage sampling (2 in 1 sub-sample)
All passengers travelling
during IPS shift
Passenger identified as eligible for
migration screening
Screening identifies
passenger as a migrant?Yes No
Ask migrant
trailer
Eligible for travel
and tourism
interview?
End of
contact
Eligible for travel
and tourism
interview?
End of
contact
Ineligible for overseas travel
and tourism interview
because of migrant status Complete overseas travel
and tourism interview
‘First-stage
sampling
interval’
‘Second-
stage
sampling
interval’
YesYes
No
No
IPS two stage sampling applied to the identification of
respondents for migrant sift
IPS two stage sampling applied to the identification of
respondents for overseas travel and tourism
Page | 19
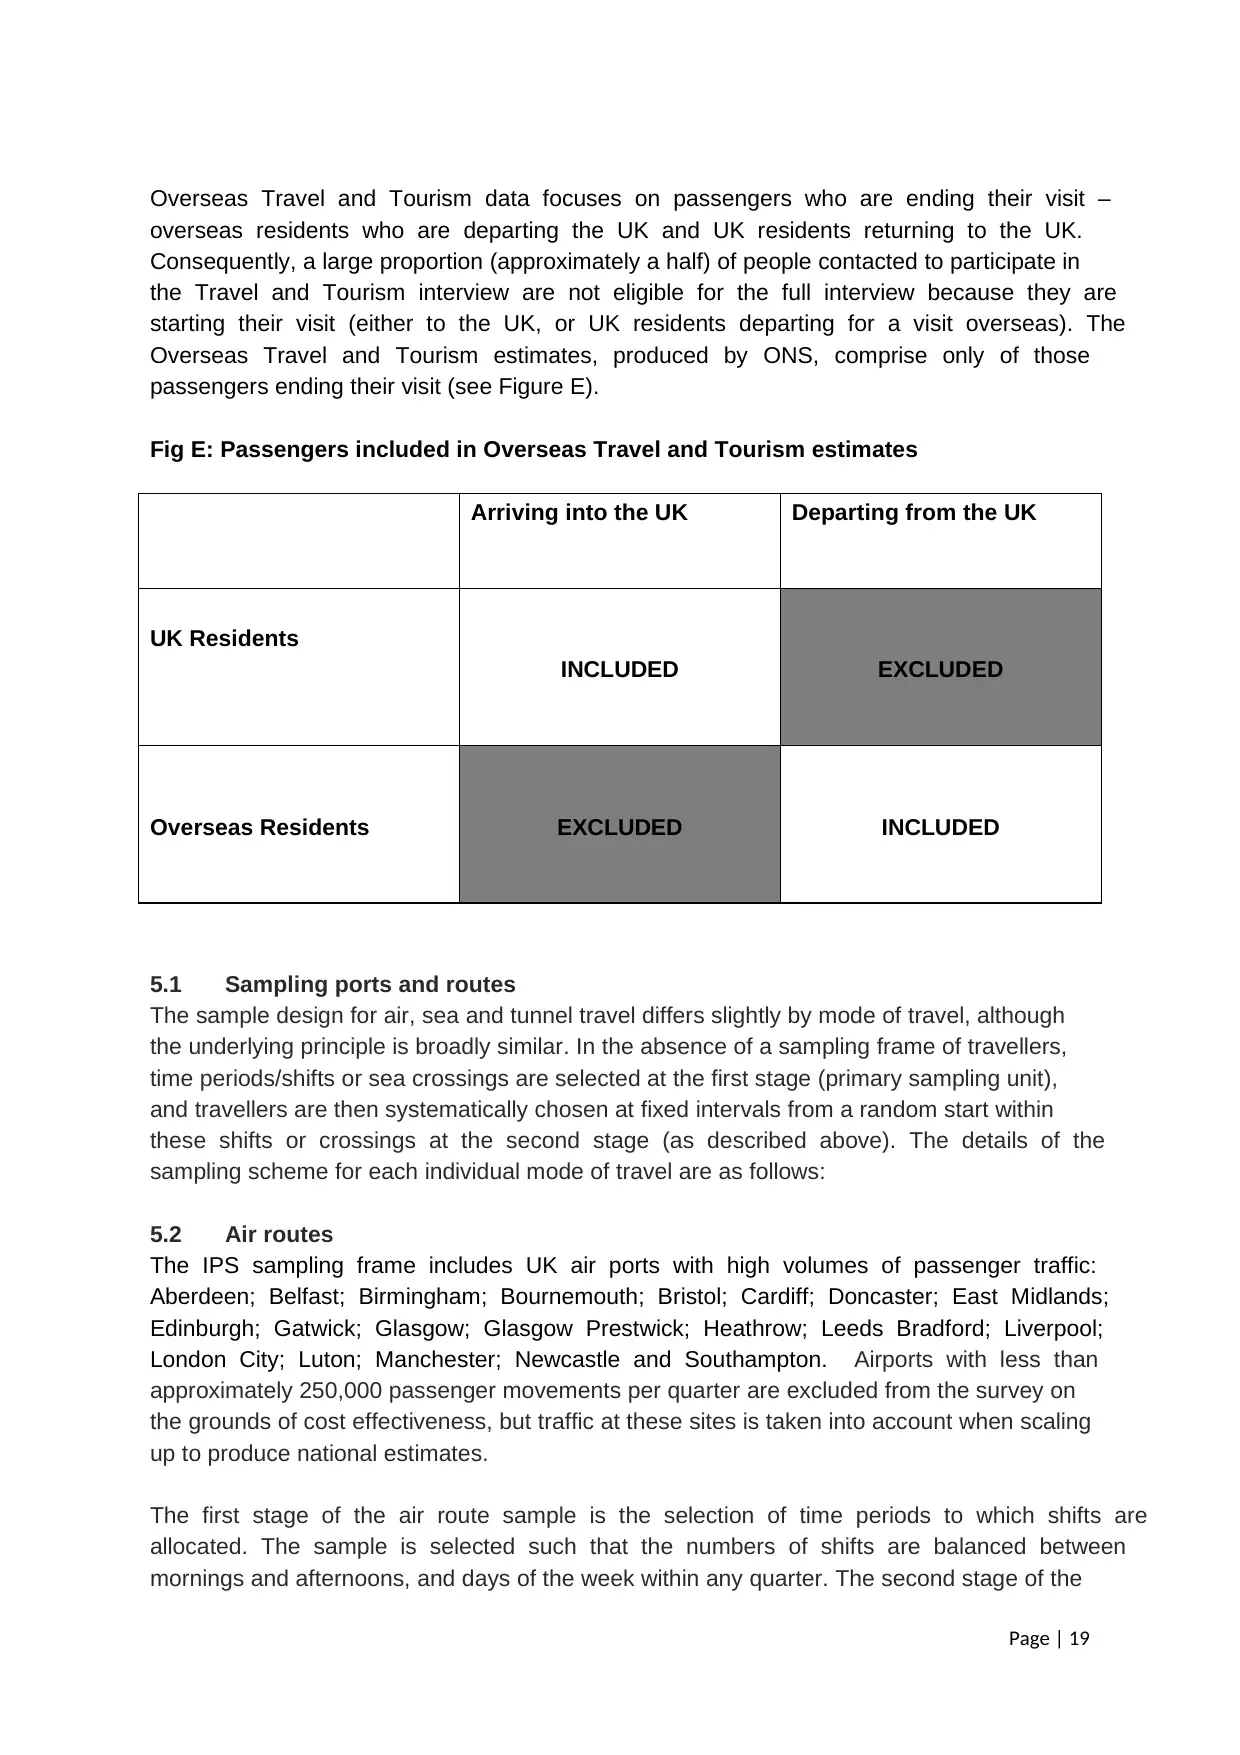
Overseas Travel and Tourism data focuses on passengers who are ending their visit –
overseas residents who are departing the UK and UK residents returning to the UK.
Consequently, a large proportion (approximately a half) of people contacted to participate in
the Travel and Tourism interview are not eligible for the full interview because they are
starting their visit (either to the UK, or UK residents departing for a visit overseas). The
Overseas Travel and Tourism estimates, produced by ONS, comprise only of those
passengers ending their visit (see Figure E).
Fig E: Passengers included in Overseas Travel and Tourism estimates
Arriving into the UK Departing from the UK
UK Residents
INCLUDED EXCLUDED
Overseas Residents EXCLUDED INCLUDED
5.1 Sampling ports and routes
The sample design for air, sea and tunnel travel differs slightly by mode of travel, although
the underlying principle is broadly similar. In the absence of a sampling frame of travellers,
time periods/shifts or sea crossings are selected at the first stage (primary sampling unit),
and travellers are then systematically chosen at fixed intervals from a random start within
these shifts or crossings at the second stage (as described above). The details of the
sampling scheme for each individual mode of travel are as follows:
5.2 Air routes
The IPS sampling frame includes UK air ports with high volumes of passenger traffic:
Aberdeen; Belfast; Birmingham; Bournemouth; Bristol; Cardiff; Doncaster; East Midlands;
Edinburgh; Gatwick; Glasgow; Glasgow Prestwick; Heathrow; Leeds Bradford; Liverpool;
London City; Luton; Manchester; Newcastle and Southampton. Airports with less than
approximately 250,000 passenger movements per quarter are excluded from the survey on
the grounds of cost effectiveness, but traffic at these sites is taken into account when scaling
up to produce national estimates.
The first stage of the air route sample is the selection of time periods to which shifts are
allocated. The sample is selected such that the numbers of shifts are balanced between
mornings and afternoons, and days of the week within any quarter. The second stage of the
Paraphrase This Document
Need a fresh take? Get an instant paraphrase of this document with our AI Paraphraser
Page | 20
sampling process is the selection of passengers as they cross a predetermined line, with
every nth person being interviewed.
The passenger sampling interval (n) differs between sites and is determined by estimated
passenger flow and expected variance within key characteristics. Departing passengers are
sampled at a higher rate than arriving passengers because the expenditure information for
overseas residents visiting the UK is more variable than that for UK residents returning from
visits abroad.
The following larger airports are included in the IPS sample every quarter: Heathrow;
Gatwick; Manchester; Stansted and Luton. A small number of shifts every quarter are also
conducted at the other sampled international airports in the UK. However, the sample sizes
for these airports are insufficient to provide accurate estimates for most of these airports at
an individual airport level.
The most frequently sampled air port is Heathrow Terminal 3 departures with over 200
interviewing shifts a year. Across all airport terminals and routes included in the IPS sample
the average number of shifts run per year is around 100 (split fairly equally between arrivals
and departures).
5.3 Sea routes
Sea routes carrying at least 50,000 passengers a year are generally included in the IPS
sample. At some seaports, passengers are sampled and interviewed on the quayside as
they embark or disembark, while at others IPS interviewers travel on the boat itself with
interviewing being carried out on board. The choice between interviewing on the quayside or
on crossings is made on practical grounds such as cost, safety and permission.
Where interviewing is conducted on the quayside, the sample is designed to select shifts
that are balanced across different days of the week and times of day within a quarter, with
each individual shift covering several sailings. Where interviews are conducted on crossings,
a predetermined number of return crossings are selected for each route, spread across time
of day and days of the week, each quarter. As for sampling for air routes, sea passengers
are selected at fixed sampling intervals from a random start within each shift or crossing.
The IPS also samples long haul ships capable of carrying more than 200 passengers at the
port of Southampton.
The most sampled sea route is Dover-Calais on which around 200 arrivals and 200
departures sailings are sampled a year.
5.4 Tunnel routes
The method used for the tunnel routes is different for Eurostar passenger trains and for
Eurotunnel vehicle shuttles.
The method for passenger trains is similar to that for air travel; time shifts are selected and
then passengers are selected at fixed intervals within the time shift. Passengers are
interviewed after crossing a predetermined line at Ebbsfleet, St. Pancras, and Ashford
Page | 21
International stations on arrival or departure. A total of 320 passenger trains are sampled in
each direction
In contrast, for vehicle shuttles, crossings are randomly selected and interviewing takes
place on board the shuttles themselves. Because of time constraints, only a certain number
of interviews can be carried out on any individual shuttle and the sampling interval used is
therefore dependent on traffic volumes.
5.5 Exclusions from the IPS sample
The IPS sampling frame includes approximately 95% of passengers travelling to and from
the UK. The sampling frame excludes the following passengers:
travelling outside of IPS interviewing times at all sampled airports;
travelling through routes not covered within the IPS sample;
travelling between the UK and the Channel Islands and the Isle of Man; and
travelling across the land border between Northern Ireland and the Republic of
Ireland
travelling on international cruises terminating at or departing from a UK port
ormaking a cruise port of call visit to the UK.
While data is not collected from these passengers they are taken account of within the IPS
weighting process, which uses total UK international passenger figures. In the case of traffic
between the UK and the Channel Islands, Isle of Man, across the Irish land border and
passengers on (foreign operated) cruises terminating in the UK, records are created to
represent these cases within the IPS data, based on external information about estimated
expenditure for these groups.
6 Historical changes to sampling
6.1 Changes made in 2009
Prior to 2009, the main UK airports – Heathrow, Gatwick and Manchester – were always
included in the sample. Other airports were included in sample if they had at least one
million passengers a year passing through them. Sea routes were treated similarly to the
smaller airports, in that they were included or excluded in the sample depending on the size
of the international traffic passing through.
Extra samples, referred to as migration filter shifts, were also carried out on the inward
(arrival) flows at the four Heathrow and two Gatwick terminals to boost the sample of
migrants. These were first run for departures (outflow) in 2007. Contacts were asked a brief
series of questions to identify whether or not they were migrants and only migrants were
given a full interview.
6.2 Changes made in 2009
In January 2009, changes were made to the sample design and data processing of the IPS.
These changes were introduced following a Port Survey Review in response to the
recommendation put forward by the Inter-Departmental Task Force on Migration Statistics in
Page | 22
2006. Further information on the Port Survey Review is available in Port Survey Review -
Stage Two Final Technical Report
The sample design changes consisted of:
increasing the number of shifts run at many air/sea/tunnel ports apart from at
Heathrow
decreasing the number of shifts run at Heathrow
new shifts being established at Aberdeen and Belfast airports and the Portsmouth to
Bilbao sea route
abolishing the migration filter shifts
introducing a primary sampling interval for screening migrants (around 1:10) and a
sub-sample interval for travel and tourism contacts (around 1:30) within the ordinary
shifts, i.e. travel and tourism contacts are a sub-sample of the migrant sample
The new sample design aimed to be both more migrant focused and more balanced in terms
of the routes that migrants use. An optimization exercise was undertaken using 2006 IPS
data to determine the distribution of IPS shifts by route that would be expected to deliver the
most statistical robust sample.
The sampling process is reviewed regularly at specific ports and approaches are undertaken
to ensure the sampling process is made more efficient. A reoptimisation of the sample was
undertaken in 2011, and a review of the IPS sample is taking place in 2014 and 2015 with
recommendations expected to be implemented in 2016.
6.3 Sample revisions during the 2012 Olympic/Paralympic Games
The London 2012 Olympics took place from 27 July to 12 August (with a few events starting
on 25 July), and the Paralympics from 29 August to 9 September. The time immediately
before, during and after the Olympics and Paralympics witnessed changes to passenger
flows at some airports and seaports.
During the period 1 to 16 August 2012 the following additions were made to interviewing
shifts run at certain ports:
The number of departures shifts run at each of Luton, Stansted, Gatwick North,
Gatwick South, Heathrow terminals 1, 4 and transits, together with St Pancras
Eurostar terminal, were doubled relative to the standard IPS sample.
The number of departures interviewing shifts run at each of London City,
Southampton and Bournemouth airports and Ebbsfleet and Ashford Eurostar
terminals were increased by a factor of four relative to the standard IPS sample.
Southend, Biggin Hill and Farnborough airports were each sampled four times in that
period.
Passengers passing through the temporary athletes’ terminal at Heathrow airport
were sampled as they entered the main departure terminal (terminals 1, 3, 4 or 5)
after being transported there from the temporary terminal.
In order to facilitate this additional sample coverage within the IPS field force the rate of
selection of passengers at most of these ports was widened during this period. The revised
probability of selection was reflected in the weighting of IPS data.
Secure Best Marks with AI Grader
Need help grading? Try our AI Grader for instant feedback on your assignments.

Page | 23
Further details regarding the expansion of the IPS sample in August 2012 specifically to
collect robust estimates of visits to the UK for the London 2012 Olympic Games and
Paralympics can be found on the ONS web site. Further information related to the Games
can also be found on the ONS website.
Further details regarding the expansion of the IPS sample in August 2012 specifically to
collect robust estimates of visits to the UK for the London 2012 Olympic Games and
Paralympics can be found on the ONS web site. Further information related to the Games
can also be found on the ONS website.
Page | 24
7 Changes in methodology
7.1 Changes to the collection of data from travellers to and from the Irish Republic
from 1999 onwards
From the second quarter of 1999, the IPS began interviewing on air and sea routes between
the UK and the Irish Republic. For the years up to and including 1998, estimates of visitor
numbers, their spending and nights stayed on routes between the UK and the Irish Republic
and their characteristics were based on data provided by the Central Statistical Office of the
Irish Republic.
From 1999, and for subsequent years, the Overseas Travel and Tourism estimates use IPS
interview data. To enable 1999 data to be analysed, data for the first quarter of 1999 were
constructed, based upon interviews conducted in the first quarter of 2000, but weighted to
the traffic volumes of the first quarter of 1999.
Analysis of the interview data from 1999 onwards has shown that a large number of Irish
visitors who would previously have been defined as tourists to the UK were transiting
through the UK on their overseas visits. Also, the data for 1999 onwards showed that a
number of European and Commonwealth visitors made combined visits to the UK and the
Irish Republic; these visits were previously recorded as visits from residents of the Irish
Republic.
These factors combined to reduce the number of overseas visitors to the UK from 1999
onwards, mainly the estimates of visitors from the Irish Republic, but they also increased the
number of visitors from certain other countries, particularly Australia, New Zealand, Canada,
Germany and the Netherlands.
The data from the IPS Irish interviews also affected estimates of spending and nights. These
showed that the previous estimates of spending per visit of Irish visitors to the UK were
overstated, while estimates of UK residents’ spending per visit in the Irish Republic were
previously understated.
The interview-based details of visitors from the Irish Republic have enabled more completed
duration of stay and regional breakdowns to be produced from 1999 onwards. This has led
to discontinuities between 1998 and 1999 in the duration of stay and regional profile from the
IPS.
In summary, the major effect resulting from IPS interviewing on routes to and from the Irish
Republic was to improve the quality and detail of estimates from 1999 onwards. The
discontinuities from this change affected time series estimates of visitors to and from the
Irish Republic, with some smaller effects for other countries.
7.2 Changes in methodology, 2005
Due to a rapid growth in traffic, in 2005 two new residual airports, Liverpool and Prestwick
were introduced into the IPS sample for the first time. The introduction of these two airports
has some implications for the results of the IPS.
Page | 25
The inclusion of these two ports means that there is more likelihood of picking up contacts
that reside in, or have visited areas close to, these airports.
The introduction of the new airports caused the IPS research team to review the way that
traffic from airports not sampled by the IPS is accounted for in the IPS processing systems.
As a result, the systems were modified slightly in order to prevent overestimates or
underestimates of traffic occurring at a regional level.
The introduction of the new airports and the subsequent changes made to the processing
systems causes a discontinuity in the IPS results. Any comparisons of IPS results for 2005
onwards with earlier years (and especially those of a UK regional nature) therefore should
be made with care.
7.3 Changes in methodology, 2007
- Imputing expenditure
The methods of computing expenditure (imputation) for cases where no expenditure
information is given by the contact changed in 2007. The new method takes account of the
duration of stay of the contact which had not been the case previously and means there may
be a discontinuity in the expenditure series from 2006 to 2007.
The new methodology compensates for possible overestimates of spending which may have
arisen in the past due to the average daily spending being generally lower on longer trips
than on shorter ones.
- Imputing fares
The costs of a package trip normally include fares to and from the country of visit. For
expenditure estimates the fares are deducted from the cost of a package in order to obtain
the amount of spending on the visit. The manual method of looking up fares from brochures
and from the web was replaced in 2007 by an automated system which uses fares data
provided by the respondent.
- Coding of UK towns
In 2007 a more comprehensive approach to coding UK towns was introduced. Interviewers
were provided with a more detailed list of towns and boroughs than in the past, meaning that
their recording of responses given by respondents was more accurate.
7.4 Changes in methodology, 2009
Aberdeen Airport was introduced to the sample, and as a result, the estimated number of
visits to cities and regions in Scotland will have been impacted positively. Belfast
International Airport was also introduced but visits to cities and regions in Northern Ireland
are not reported in the IPS Overseas Travel and Tourism estimates due to inability to record
Paraphrase This Document
Need a fresh take? Get an instant paraphrase of this document with our AI Paraphraser
Page | 26
details of visits made by crossing the Irish land border. Prior to 2009, known passenger
traffic passing through Belfast was allocated to airports in Great Britain. The allocation of this
traffic to interviews conducted in Belfast in 2009 will have had some downward impact on
estimates of visits to towns and regions in Great Britain.
More broadly, the overall methodology of the IPS was changed in 2009, in terms of both
sampling and data processing.
Sampling was revised to incorporate an increase in the number of shifts run at many ports
outside of Heathrow and a decrease in the number of shifts run at Heathrow. This change
was introduced following a Port Survey Review in response to the recommendations put
forward by the Inter-Departmental Task Force on Migration Statistics. Further, the way that
shifts are run was changed via the introduction of a system employing a primary sampling
interval for screening migrants and a sub-sample interval for travel and tourism contacts.
This approach didn’t affect the profile of travel and tourism contacts but it did require a
change in the way the data is processed.
The data processing involves weighting of all records and imputation of records with
information missing at certain questions. The basic principles behind the processing were
retained in 2009 but improvements were made in some aspects. This resulted in some
discontinuity with a downward impact of approx 2 per cent in visits to the UK and 3 per cent
in visits overseas and a further value of less than 1 per cent in earnings and expenditure.
Details are found on the ONS website here: http://www.ons.gov.uk/ons/guide-
method/method-quality/specific/travel-and-transport-methodology/international-passenger-
survey-methodology/changes-in-the-international-passenger-survey-methodology-1-jan-
2009.pdf
7.5 Changes in methodology, 2010
There were no changes in data collection methodology in 2010. However, the methodology
used to estimate the number of UK residents departing from or arriving at UK ports on
cruises was revised. The new methodology utilises new sources of data, including that
published by DfT, IRN Research and the European Cruise Council. This represents an
improvement in methodology and has the effect of increasing the estimated number of visits
to ‘rest of the world’ by UK residents by approximately 175,000 compared with 2009.
Page | 27
8 Fieldwork
8.1 The collection of IPS data
Interviews are carried out throughout the year, apart from on Christmas Eve, Christmas Day
and Boxing Day. The survey is therefore carried out 362 days a year and great emphasis is
placed upon the interviewers’ ability to capture data efficiently and accurately.
Nationally, IPS data are collected by a team of over 200 interviewers who are recruited and
trained specifically to work on the survey. All IPS interviewing staff undergo an intensive
initial training course and, once qualified, are regularly briefed and monitored by a support
team of Team Leaders and Site Managers. Some interviewing teams will cover a single
large port, such as Heathrow or Gatwick, while others may cover several smaller ports which
are generally in the same part of the UK. Site Managers have overall responsibility for a port
or group of ports and ensure that data quality is maintained.
Typically, an IPS shift will consist of a group of between three and ten interviewers led by a
Team Leader. The Team Leader is responsible for the organisation and running of a shift
and is available to offer advice to team members when required.
During the shift team members take it in turns to act as the ‘counter’. Their role is to count
the passengers as they cross the IPS counting line and to identify the passenger selected for
interview according to the sampling intervals appropriate for that port and shift.
Interviews are conducted on a voluntary and anonymous basis. They take place on a face-
to-face basis with the responses being initially recorded on paper questionnaires.
‘Self completion’ questionnaires, available in 13 languages, are used where an interviewer is
unable to conduct an interview because of language difficulties. These questionnaires do not
cover the complete range of questions asked within a full IPS interview.
Due to the layout and facilities at some seaports it is not always possible to interview
passengers as they arrive. In such cases, interviewers travel to seaports in France to sample
passengers and conduct interviews on board the vessels leaving and returning to the UK.
Shortly after the interview has taken place, the data are transferred to a computer system in
which electronic checks are made of the data being input. Once the interview information
has been captured electronically, it is transmitted to ONS headquarters where a series of
further quality and accuracy checks are made on the data before they are ready for
processing and the survey estimates published.

Page | 28
9 The IPS questionnaire
There are two main questionnaires used on the survey for the two main passenger flows –
arrivals and departures.
In addition, there are short ‘trailers’ that have been designed to collect information from
specific subgroups: students; foreign employees; and migrants.
9.1 Main concepts
The following are key concepts that form the basis of the IPS.
a) Nationality
This is the country to which an individual belongs and is usually where they were born and
where their origins lie, although some people may change their nationality when they move
to a different country.
In IPS terms, nationality is defined as . . .
. . . the country which issued their passport.
b) Residence
The international definition of residence as used for the IPS is as follows:
Living in a country for 12 months or more.
Respondents are residents of a country if:
they have been staying in a country for the last 12 months or more (apart from holidays
and business trips away). This includes people who have been working in that country for
at least 12 months (excluding commuters) or have been studying in that country for more
than one academic year;
they have set up home in the country during the last 12 months and intend to complete 12
months there;
they have begun work / study there during the last 12 months and intend to be still
working / studying there for 12 or more months after they arrived;
they have been living in the country for 12 months but are in the process of moving to live
in another country for at least 12 months;
the country in which they have their main home but commute weekly or fortnightly to
another country where they work: e.g. spend weekends in one country but spend Monday
to Friday in another country, or commutes to work on an oil rig or fishing fleet.
Secure Best Marks with AI Grader
Need help grading? Try our AI Grader for instant feedback on your assignments.
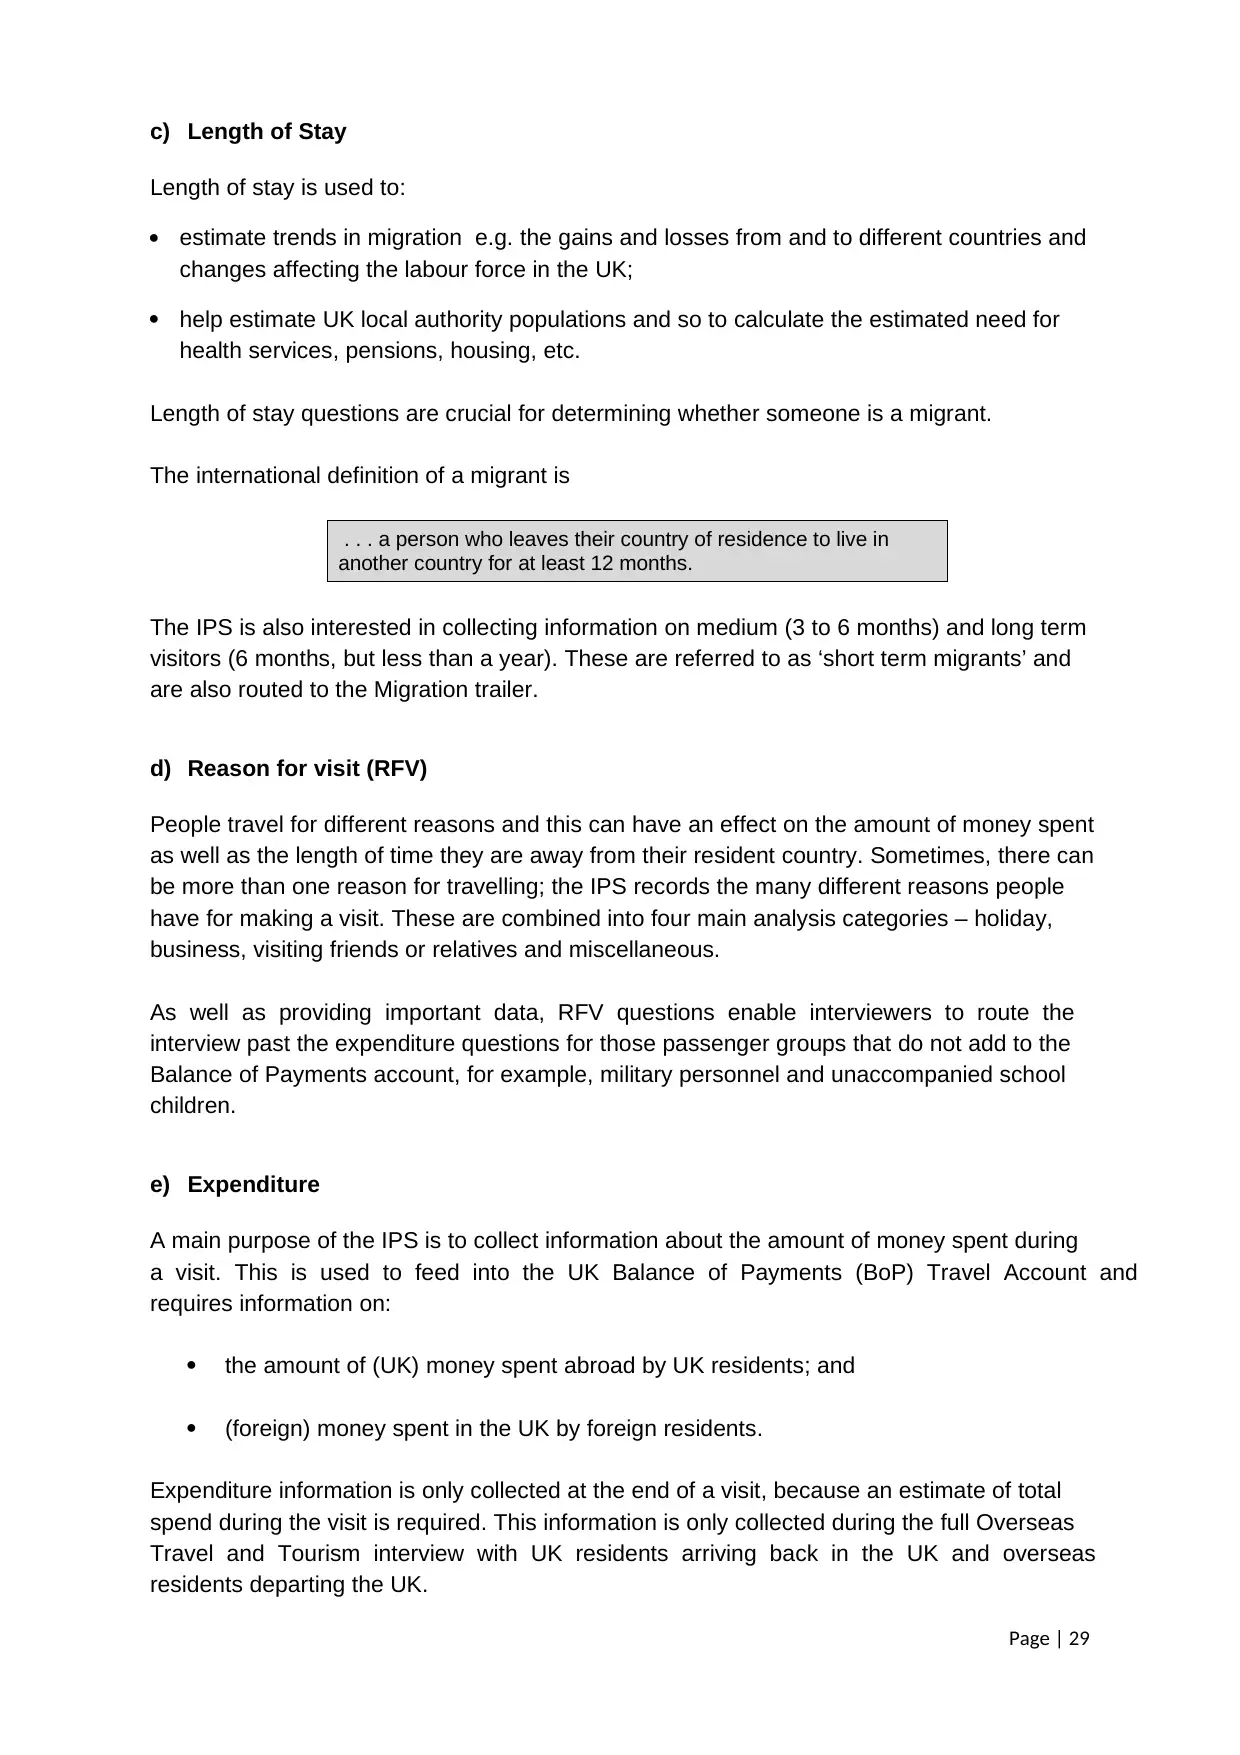
Page | 29
c) Length of Stay
Length of stay is used to:
estimate trends in migration e.g. the gains and losses from and to different countries and
changes affecting the labour force in the UK;
help estimate UK local authority populations and so to calculate the estimated need for
health services, pensions, housing, etc.
Length of stay questions are crucial for determining whether someone is a migrant.
The international definition of a migrant is
. . . a person who leaves their country of residence to live in
another country for at least 12 months.
The IPS is also interested in collecting information on medium (3 to 6 months) and long term
visitors (6 months, but less than a year). These are referred to as ‘short term migrants’ and
are also routed to the Migration trailer.
d) Reason for visit (RFV)
People travel for different reasons and this can have an effect on the amount of money spent
as well as the length of time they are away from their resident country. Sometimes, there can
be more than one reason for travelling; the IPS records the many different reasons people
have for making a visit. These are combined into four main analysis categories – holiday,
business, visiting friends or relatives and miscellaneous.
As well as providing important data, RFV questions enable interviewers to route the
interview past the expenditure questions for those passenger groups that do not add to the
Balance of Payments account, for example, military personnel and unaccompanied school
children.
e) Expenditure
A main purpose of the IPS is to collect information about the amount of money spent during
a visit. This is used to feed into the UK Balance of Payments (BoP) Travel Account and
requires information on:
the amount of (UK) money spent abroad by UK residents; and
(foreign) money spent in the UK by foreign residents.
Expenditure information is only collected at the end of a visit, because an estimate of total
spend during the visit is required. This information is only collected during the full Overseas
Travel and Tourism interview with UK residents arriving back in the UK and overseas
residents departing the UK.
Page | 30
Further information and guidance about each of these concepts is available from the IPS
Research Team or from the interviewer instructions which are available via the ONS
website:
9.2 Trailer questionnaires
Trailer questionnaires are designed to collect more detailed information about particular
groups of travellers: Students, Foreign Employees and Migrants.
a) Student trailer
The student trailer applies to respondents who are studying at colleges and universities in
the UK and respondents who are studying abroad.
b) Employee trailer
The employee trailer applies to respondents who work in a country which is different to the
one in which they are resident. The 2 main groups which fall into this category are
international commuters (‘border’ workers) and people on short-term contracts (‘seasonal’
workers, who spend less than 12 months in their country of work). It is asked to arriving UK
residents and departing foreign residents,
The trailer is asked on behalf of ONS Balance of Payments. Under BPM5 (Balance of
Payments Manual 5), and the ESA 95 (European System of Accounts 1995) the expenditure
of UK residents while working abroad should be treated as a debit to the UK Balance of
Payments and their income from working abroad should be treated as a credit. The reverse
applies to foreign residents working in the UK.
c) Migration trailer
All UK residents who intend to stay away from the UK for more than three months, or foreign
residents who intend to stay in the UK for more than three months, are routed from Qs11-15
on the main questionnaire (arrivals for foreign residents and departures for UK residents) to
the migration trailer.
Those intending to stay for 3 months or more but less than 12 months are referred to as
short-term migrants, those staying for 12 months or more are referred to as long-term
migrants. Long-term migrants are asked a small number of additional ‘migration’ questions
(Q34 to Q37).
Information from the migration trailer is used by ONS to feed into the calculation of long term
international migration estimates.
The following diagrams illustrate the flow of the IPS Overseas Travel and Tourism
questionnaire and how respondents are routed to the respective trailers (Figures F and G).
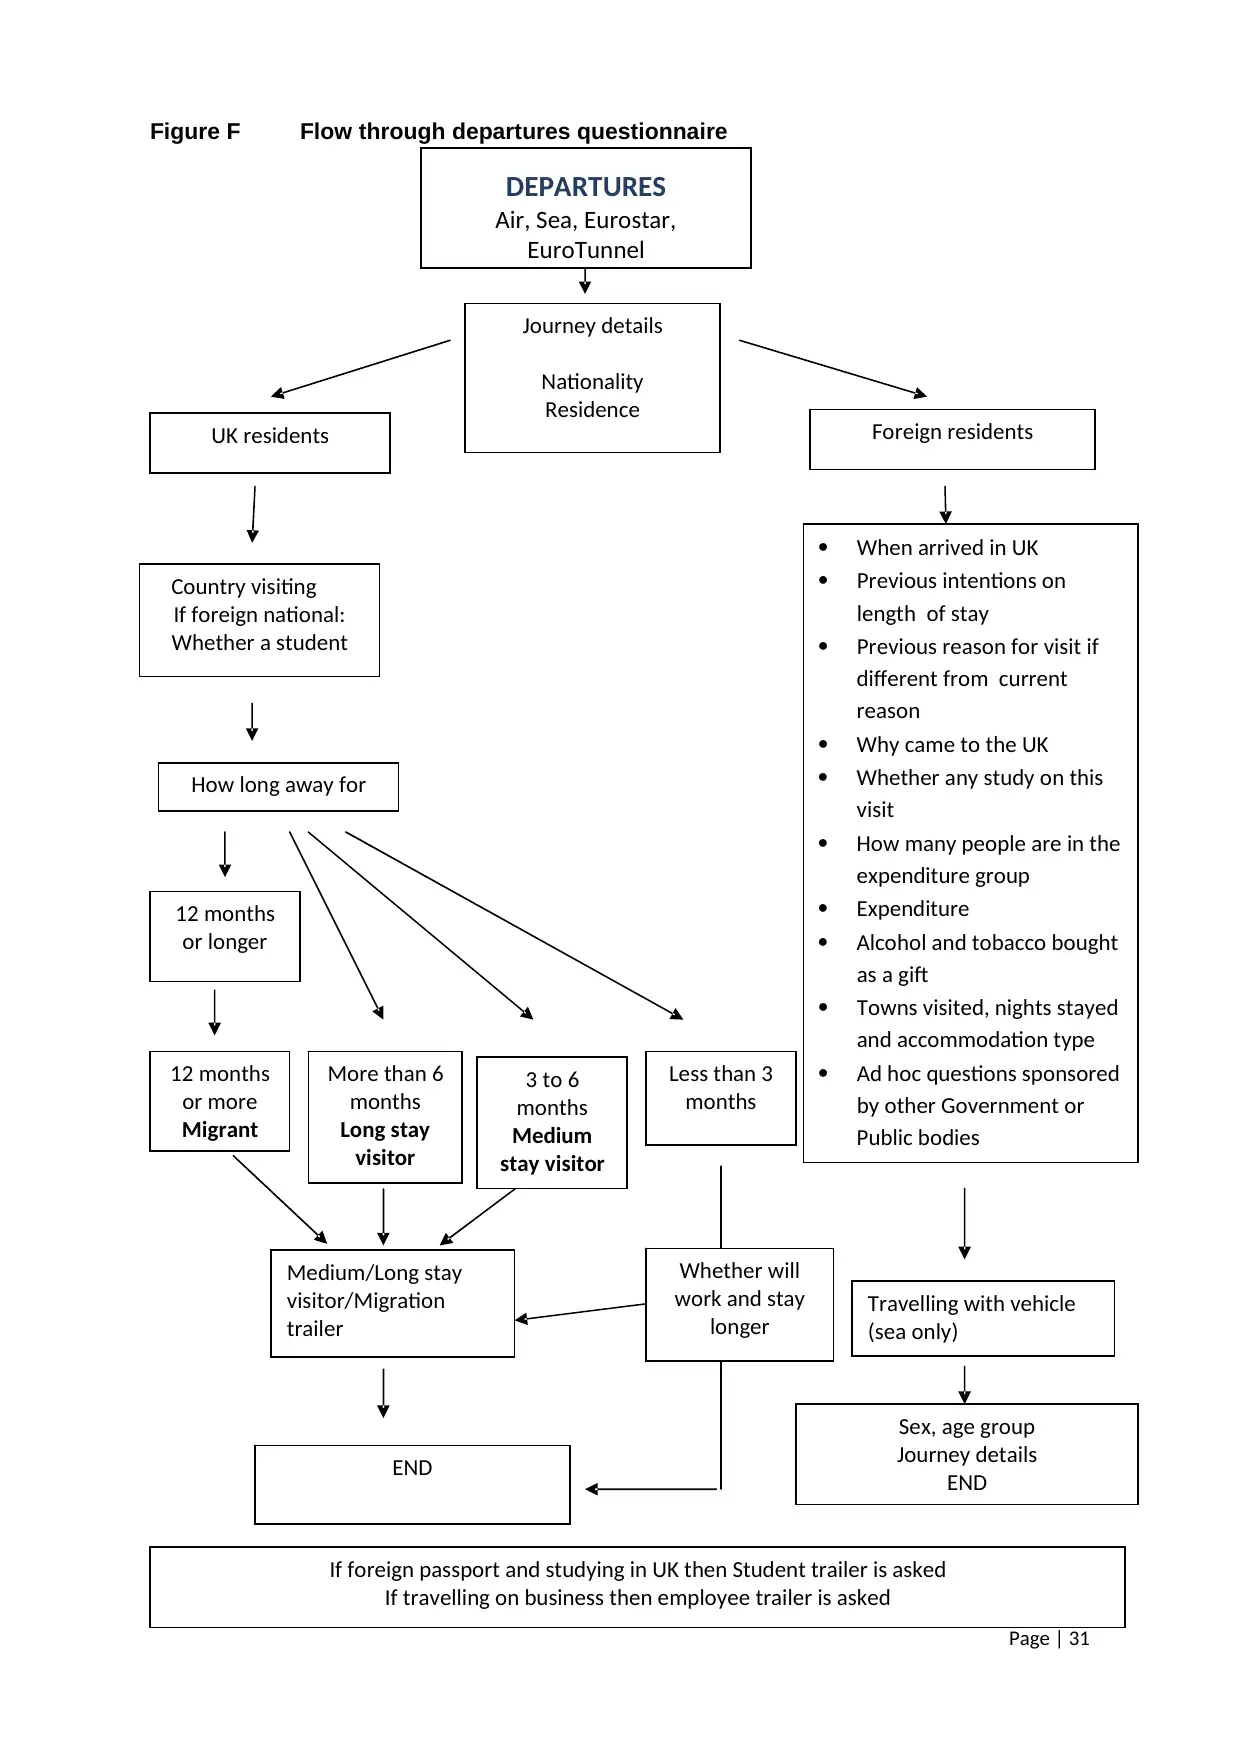
Page | 31
Figure F Flow through departures questionnaire
Need to update
Journey details
Nationality
Residence
UK residents
How long away for
12 months
or longer
12 months
or more
Migrant
3 to 6
months
Medium
stay visitor
More than 6
months
Long stay
visitor
Medium/Long stay
visitor/Migration
trailer
END
If foreign passport and studying in UK then Student trailer is asked
If travelling on business then employee trailer is asked
Foreign residents
When arrived in UK
Previous intentions on
length of stay
Previous reason for visit if
different from current
reason
Why came to the UK
Whether any study on this
visit
How many people are in the
expenditure group
Expenditure
Alcohol and tobacco bought
as a gift
Towns visited, nights stayed
and accommodation type
Ad hoc questions sponsored
by other Government or
Public bodies
Sex, age group
Journey details
END
Less than 3
months
DEPARTURES
Air, Sea, Eurostar,
EuroTunnel
Country visiting
If foreign national:
Whether a student
Whether will
work and stay
longer
Travelling with vehicle
(sea only)
Paraphrase This Document
Need a fresh take? Get an instant paraphrase of this document with our AI Paraphraser
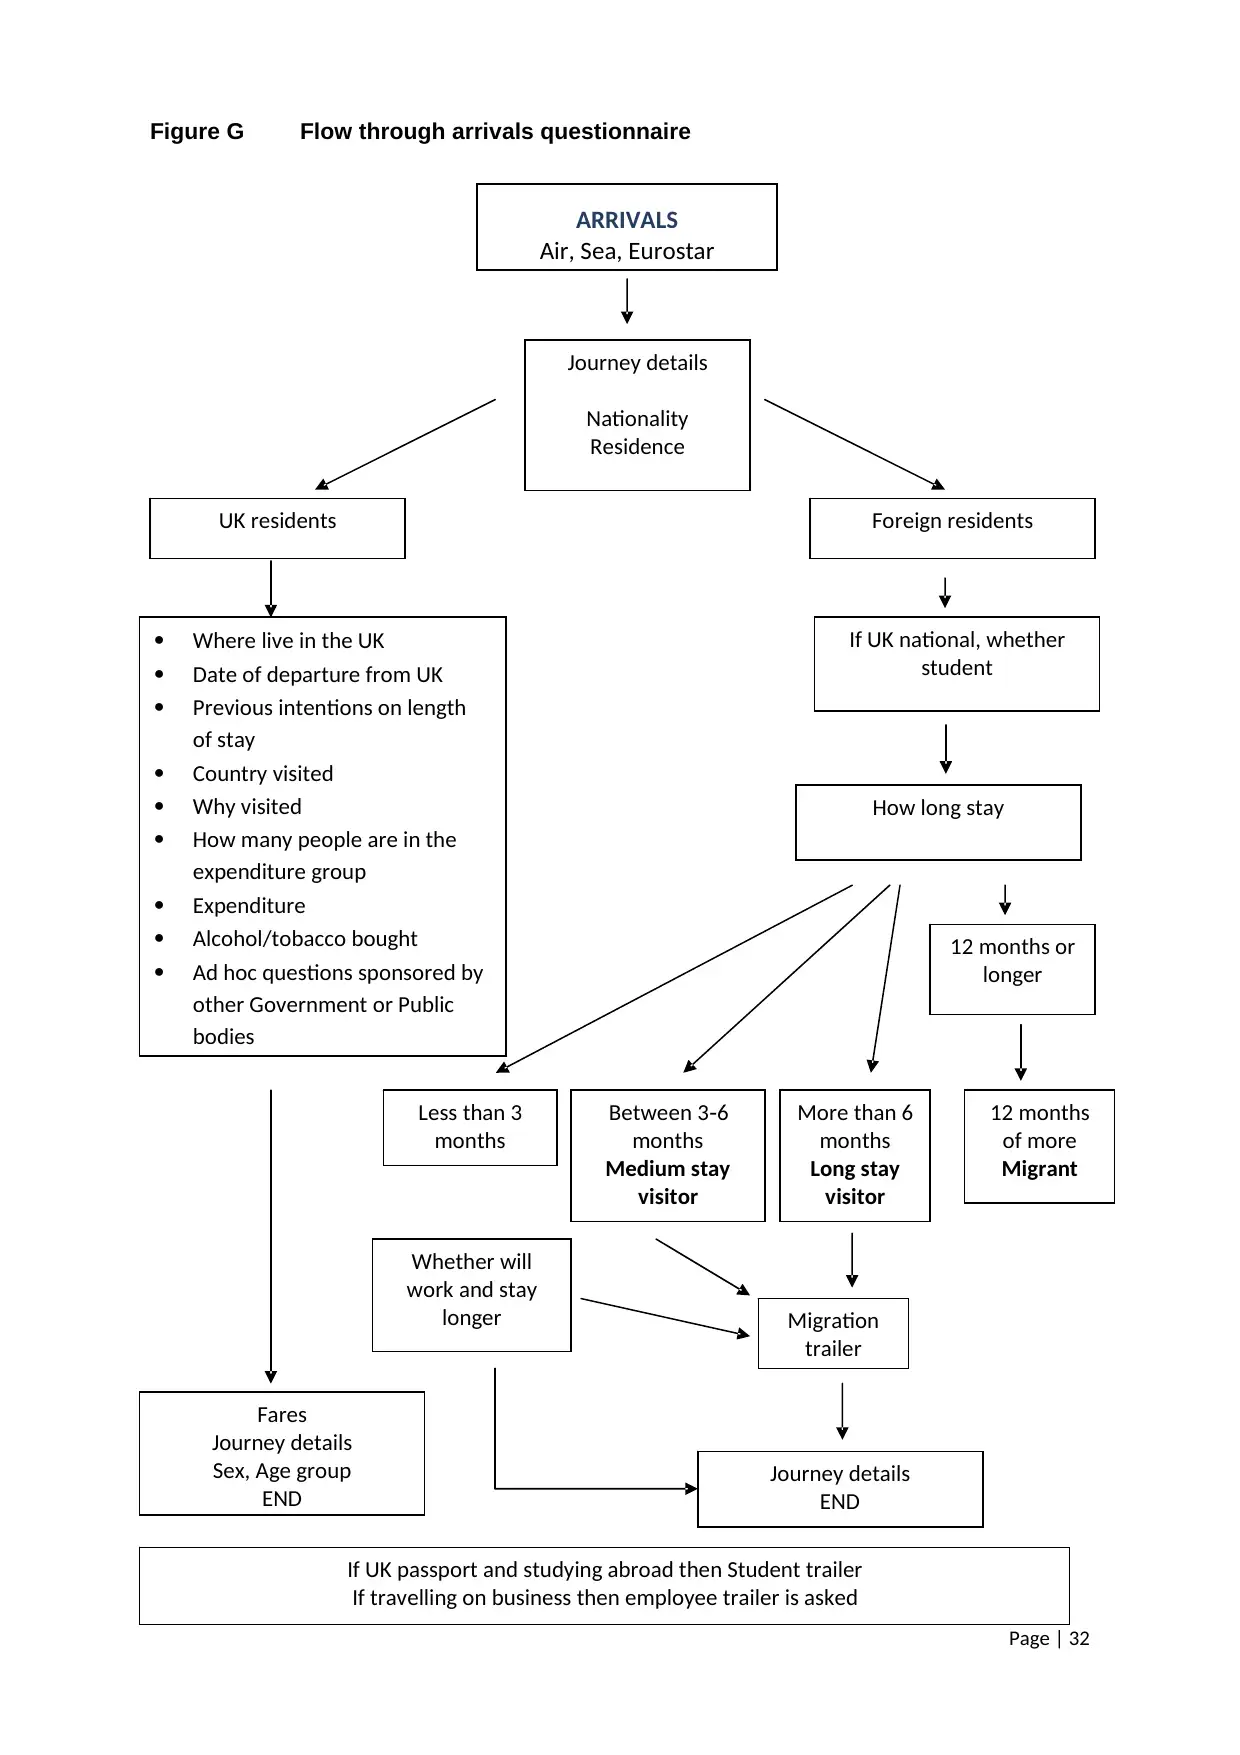
Page | 32
Figure G Flow through arrivals questionnaire
ARRIVALS
Air, Sea, Eurostar
Journey details
Nationality
Residence
UK residents
Where live in the UK
Date of departure from UK
Previous intentions on length
of stay
Country visited
Why visited
How many people are in the
expenditure group
Expenditure
Alcohol/tobacco bought
Ad hoc questions sponsored by
other Government or Public
bodies
Foreign residents
How long stay
12 months or
longer
More than 6
months
Long stay
visitor
Less than 3
months
12 months
of more
Migrant
Journey details
END
Fares
Journey details
Sex, Age group
END
If UK passport and studying abroad then Student trailer
If travelling on business then employee trailer is asked
Between 3 6‐
months
Medium stay
visitor
Migration
trailer
If UK national, whether
student
Whether will
work and stay
longer
Page | 33
9.3 Piloting the IPS questionnaire
Changes are made to the IPS questionnaire following sponsor consultation. Changes
introduced to the questionnaire undergo extensive testing before they are approved by the
IPS steering group.
The annual survey timetable includes:
asking question sponsors or main users for any change requirements in January;
discussing these requirements at the IPS steering group meeting in March;
conducting questionnaire pilot testing between May and July;
recommendations from the pilot agreed by the steering group in September; and
changes to the questionnaire implemented from January the following year.
The IPS questionnaire pilot involves testing proposed major questionnaire changes at three
IPS interviewing sites. Iterative pilot testing is used so that issues identified during the first
pilot can be addressed and changed for the second pilot, and similarly issues identified at
the second pilot can be addressed and tested at the third pilot. The pilot locations are
chosen to ensure that the questions to be tested can be adequately assessed on relevant
passengers. Heathrow airport, for instance, is a significant gateway that is used by a large
number of foreign residents and migrating passengers so is often used as a location for
questionnaire testing.
Pilot testing is an opportunity to assess: the clarity and suitability of the proposed questions
and answer categories; the flow of the interview; the quality of responses; and the length of
time it takes to complete the survey.
9.4 Primary purpose of the pilot
The aim of piloting the questionnaire is to qualitatively analyse and assess:
the clarity of the proposed questions (including response categories) i.e. whether or not
the questions are fully understood by interviewers and administered without difficulty;
whether or not the questions are fully understood by respondents and answered without
difficulty to minimise any respondent burden;
the impact of the new or revised questions on interview length, possible effects on future
co-operation and the rest of the questionnaire;
the suitability of other survey documentation such as interviewer instructions and prompt
cards; and
the ease with which questions can be administered within the context of a full interview.
9.5 Restrictions on the questionnaire
To ensure that the IPS is able to fulfil its key purposes to provide robust data to feed into the
compilation of UK migration data and travel and tourism estimates, the following restrictions
are placed on the questionnaire:
the interview length does not reach a level which would impact on sample size and
response rates;

Page | 34
the interview progresses smoothly so that it is completed quickly without interfering with
the free flow of passengers.
Consequently, recommendations from the pilot are intended to:
ensure that the estimated average interview length is not unduly extended;
reduce the risk of increasing partial interviews associated with poor quality information
due to passengers not completing the interview;
ensure the interview progresses smoothly; and
minimise any risk to the survey.
Secure Best Marks with AI Grader
Need help grading? Try our AI Grader for instant feedback on your assignments.
Page | 35
IPS Data Processing
The IPS overseas travel and tourism data are used by ONS, along with other sources of
information, to produce national estimates of different types of travellers. To ensure that the
IPS data is representative of the total UK passenger traffic a complex weighting process is
used.
10 Weighting
A weighting is applied to the IPS survey data so that sampled respondents at a port/route
represent the total passenger traffic known to have passed through that port/route in the
period in question. Actual passenger traffic information, used within the IPS weighting
process, is provided by the Civil Aviation Authority, the Department for Transport, Eurostar,
Eurotunnel, BAA and a number of individual airports.
Weighting is carried out for each port/route and direction of travel combination, employing
the same principles at each one. The IPS weighting approach incorporates a number of
stages which take account of all passengers selected for interview.
10.1 Weighting stages
The stages, listed in order of application, are as follows:
Stage 1
A Design weight is employed, to account for the probability of sampling every passenger
using the first-stage sampling interval. The calculation compares the number of shifts or
crossings sampled (at each port/route and direction of travel combination) with the number
of shifts or crossings that could have been sampled for that combination in the period.
In addition it takes into account the first-stage sampling interval. For example, in a case
where a contact was sampled at a port with the following details:
10 shifts were run in the period
100 shifts could have been run in the period
The contact was sampled employing a first-stage sampling interval of 20 (that is,
every 20th passenger was selected)
The design weight for this contact would be 200, calculated as (100/10) x 20. As well as
port/route and direction, this weight incorporates weekday or weekend, and am, pm or night
as weighting strata.
Stage 2
A Non-response weight factor is employed to take account of contacts selected for interview
but who were subsequently not interviewed, either because it was not possible to contact
them or they refused to participate.
The weight is applied at each port/route and direction travel combination and also
incorporates weekday versus weekend as weighting strata. It involves uplifting ‘complete’
and ‘minimums’ cases by a factor calculated as:
the sum of weights applied to all ‘completes’, ‘minimums’ and ‘non response’
records
Page | 36
divided by the sum of ‘completes’ and ‘minimums’ at that port/route and direction of
travel combination
Stage 3
A second Design weight is applied to account for the second-phase of the sample design
and relates to the sub-sampling of non-migrants. The weight for this factor is simply equal to:
the ratio second-stage sample interval: first-stage sample interval for non-migrants,
1 for migrants.
Stage 4
A weight factor is applied for discarding minimum respondents. Minimum interviews are
discarded in this step of the weighting, with other cases weighted up to compensate.
The purpose of applying this weight is that it is possible that the profile of minimums might
be skewed to certain nationalities or residents of a certain countries (for example driven by
language difficulties meaning that only minimal information is provided to the interviewer).
This weighting step works to the same principle as the non-response weight. It utilises
port/route and direction of travel as weighting strata.
Stage 5
Weighting to the sampling frame; here the population (that is, passenger traffic) or the ports
and routes covered by the sampling frame are used to weight the data.
The population excludes interlining passengers (those neither entering nor leaving the UK
from this port, that is, simply changing international flights) and out-of-hours traffic (that is,
arriving or departing outside the hours covered by the IPS interviewing at that port).
The weight is applied at each port/route and direction of travel combination.
Stage 6
Weighting for frame under coverage is applied to extend the above population weighting to
compensate for not covering certain ports and times of day (out-of-hours traffic) in the survey
sample.
The weight utilises port/route and direction of travel as weighting strata and also
incorporates region of the world that traffic has come from/gone to.
The weight reflects the fact that flights to and from some parts of the world are more likely
than others to arrive or take off at night when no interviewing is conducted at airports.
Stage 7
Weighting for observed imbalance is used to correct an observed imbalance between the
number of non-migrants entering and leaving the UK. These are applied as a series of fixed
factors, relating to direction of travel, port/route and country/residence.
It has been noted since spring 2009 that there has been an increase in the proportion of
respondents in the IPS overseas travel and tourism sample who are starting their visit
Page | 37
compared to the proportion ending their visit. This proportion of the two types of traveller in
the sample defines the estimates of travel and tourism.
There is no clear reason for this trend and ONS has taken steps to calibrate its overseas
travel and tourism estimates with external data, notably estimates from surveying conducted
at departure gates at main airports in the UK by the Civil Aviation Authority (CAA) and e-
borders data. This work has shown general consistency between the datasets with the result
that the factors used in the imbalance weight have been retained. More information about
the work undertaken to explore the imbalance, and planned future work can be found on the
ONS website.
Stage 8
A final weight is applied, which combines each of the weighting stages listed above.
10.2 Imputation
Imputation is applied where the responses or values for key items of interest are missing
from the survey data for an individual record. Imputation is applied to the following items:
Length of stay
Cost of fare (expressed in terms of cost of the single fare for the respondent)
Spend
Town of stay
For each of length of stay, cost of fare and spend, a value is calculated for the survey record
which had the information missing. The IPS employs a mean-value within class imputation
procedure where the missing value is replaced with the average value for records with
similar characteristics. The matching variables used for each of these items are:
Length of stay: Country of visit/visiting from
Purpose of visit
Cost of fare: Port in UK travelled to/from
Overseas port travelled to/from
Month of travel
Operator
Spend: Country of visit/visiting from
Duration
Purpose of visit
Where the respondent has travelled on a package holiday, the cost of the fare is imputed
and then deducted from the total cost of the package, and the residual cost (after removal of
a percentage to cover travel agent fees) is assigned to expenditure.
Overseas residents staying in the UK are asked about their total expenditure in the UK. This
information is then imputed across the towns stayed in, proportionate to the length of stay in
each one. It is recognised that people tend to spend more when they stay in London than in
other towns in the UK and therefore an uplift index is calculated and applied to the spend
allocated to London in cases where the respondent stayed in both London and other towns
in the UK.
Paraphrase This Document
Need a fresh take? Get an instant paraphrase of this document with our AI Paraphraser
Page | 38
In cases where an overseas resident hasn’t given details of all the towns in the UK they
stayed in, an uplift is applied to towns stayed in by similar records, using the same principles
as outlined above for the imputation of stay, fares and spend
10.3 Seasonal adjustment
The number of travellers and their spending both have a clear seasonal pattern, with more
visits and spending in the summer than in the winter. Statistical techniques are used by ONS
with the package X-12-ARIMA to produce seasonally adjusted figures. These figures show
visits and spending with an estimate for the seasonal component removed. They allow more
meaningful comparisons to be made between months and quarters of the year and help to
identify underlying trends.
More details on seasonal adjustment procedures can be obtained from the IPS Branch of
ONS.
10.4 Constant prices
Usually, spending by overseas residents in the UK and UK residents abroad grows each
year as the price of goods and services rise. Constant price figures are calculated by ONS to
show real spending across years with the effects of price inflation removed.
For overseas residents’ expenditure in the UK, an index is created by splitting spending into
its component parts (accommodation, meals and so on) using past IPS data and uprating
these components by their related retail price indices. The resulting index is then used to
rebase the overseas figures back to 1995 prices.
For UK residents abroad, spending is split by country of visit. Consumer price indices for
particular countries are used with currency conversion rates to produce an index of price
rises. The index is then used to rebase UK residents’ spending to 1995 prices.
10.5 Additional sources of data
The method above explains how the national estimates are produced based on the routes
sampled on the IPS. Unfortunately, as the IPS does not cover all passenger routes,
additional figures have to be obtained from other sources or estimates and added to the
totals derived from the IPS. These additions are:
• UK residents on cruises departing from or arriving at UK shores
• Channel Islands expenditure and receipts from tourism, from the Economic Advisor’s
office in Jersey
• rail fares purchased by overseas visitors to the UK and UK visitors abroad before the
start of their visit, and

Page | 39
• estimates of travel across the land border between Northern Ireland and the Irish
Republic, from the Irish Central Statistical Office. For years before 1999, information
was also provided regarding travel on air and sea routes between the UK and the
Irish Republic. However, since 1999, the air and sea routes have been covered by
the IPS sample
Page | 40
Quality of the IPS
11 Strengths and Limitations
11.1 Strengths
The IPS is the main source of information in the UK on international travel and tourism
and associated earnings and expenditure and has been running since 1961. The survey
provides a comprehensive time series of travel and tourism which can be used to identify
long- term trends and patterns or to undertake time series analysis and forecasting.
International travel and tourism involves the exchange of approximately £50 billion of
trade each year. Earnings to the UK account for over £18 billion of the £50 billion,
equating to approximately 10% of total export of services. Expenditure abroad accounts
for over 25% of total imports of services. The information in the IPS Overseas Travel and
Tourism data helps users in the following areas:
o Tracking earnings and expenditure, as an important input to measuring balance
of payments.
o Understanding how the volume of visits and earnings to the UK develops, which
can be compared with statistics from other countries to assess how effective the
UK is in attracting visits (a) from key parts of the world, (b) for different purposes
and (c) among different demographic groups.
o To help understand how particular events (for example, in 2012 the London 2012
Olympic Games and Paralympics) held in the UK link to visits and spending. This
can aid future decision making.
o To provide insights regarding how effective different parts of the UK are in
attracting visits and earnings, in total and from different parts of the world and for
different purposes.
o To provide profiles of UK residents travelling to different parts of the world, to aid
government and industry in developing policy and strategy.
Survey design. The IPS uses a two-stage stratified random sample to produce efficient
estimates of UK passenger traffic. Random sampling eliminates systematic bias by
giving all passengers an equal chance to be selected.
11.2 Limitations
The IPS is a sample survey and so is subject to weaknesses which also exist for other
surveys, including:
Non-sampling error.
Estimates from all sample surveys, including those derived from the IPS data, will
contain a degree of uncertainty due to non-sampling and sampling error. Non-
sampling error generally arises from errors in the collection, measurement and
processing of the data. To minimise non-sampling error, as a result of errors arising
from data collection, all IPS interviewers receive training prior to and during their
working on the survey.
Non-sampling error may also be due to non-response. Bias may occur when
passengers who do not respond to the survey have different characteristics to those
who do respond. Possible low levels of response that might be expected due to the
respondent not speaking English have been reduced in recent years by the use of
Secure Best Marks with AI Grader
Need help grading? Try our AI Grader for instant feedback on your assignments.
Page | 41
self-completion language questionnaires and the introduction of separate sampling
arrangements at the Port Health arrivals entrance at Heathrow Terminal 3.
Non-response and missing information. The information from a respondent may be
incomplete. This can be due to a couple of reasons: i) a partial refusal (for example,
to expenditure); or a particular item was missed because of a lack of understanding
or an error.
Sampling error
The estimates produced from the IPS are based upon one of a number of samples
that could have been drawn during the interview period. This means that there is a
degree of variability around the estimates produced. IPS Overseas Travel and
Tourism estimates are accompanied by confidence intervals, which provide a range
within which we could expect the true value to lie had all passengers been
interviewed. 95% confidence intervals are used, which is a widely accepted level,
meaning that we would expect the true value to lie within the interval on 19 out of 20
occasions. For example, if an IPS inflows estimate were 25 million, with a 95 per cent
confidence interval of +/- 2.0%, then it is expected that 95 per cent of the time, the
true IPS estimate will be within the range 24.5 million to 25.5 million. Caution should
be exercised when using an estimate with a large confidence interval. Furthermore,
the number of survey interviews on particular routes or for some main reason for visit
such as playing sports and getting married, are sometimes small and consequently
attract higher sampling errors. This also applies to visits to or from countries with low
visit numbers. Sampling errors for the Overseas Travel and Tourism estimates are
published each quarter in the Quarterly publication and annually in Travel Trends.
The IPS sampling frame ensures that approximately 95% of all passengers entering
and leaving the UK have a chance of being sampled in the survey. The remainder
are either passengers travelling at night, when interviewing is suspended, or on those
routes too small in volume or too expensive to be covered. The IPS weighting
process takes account of the excluded passengers, however there is a risk that the
assumptions made within this process are incorrect. Regular reviews of the IPS
sample design and weighting process reduce the risk of using incorrect assumptions
in both.
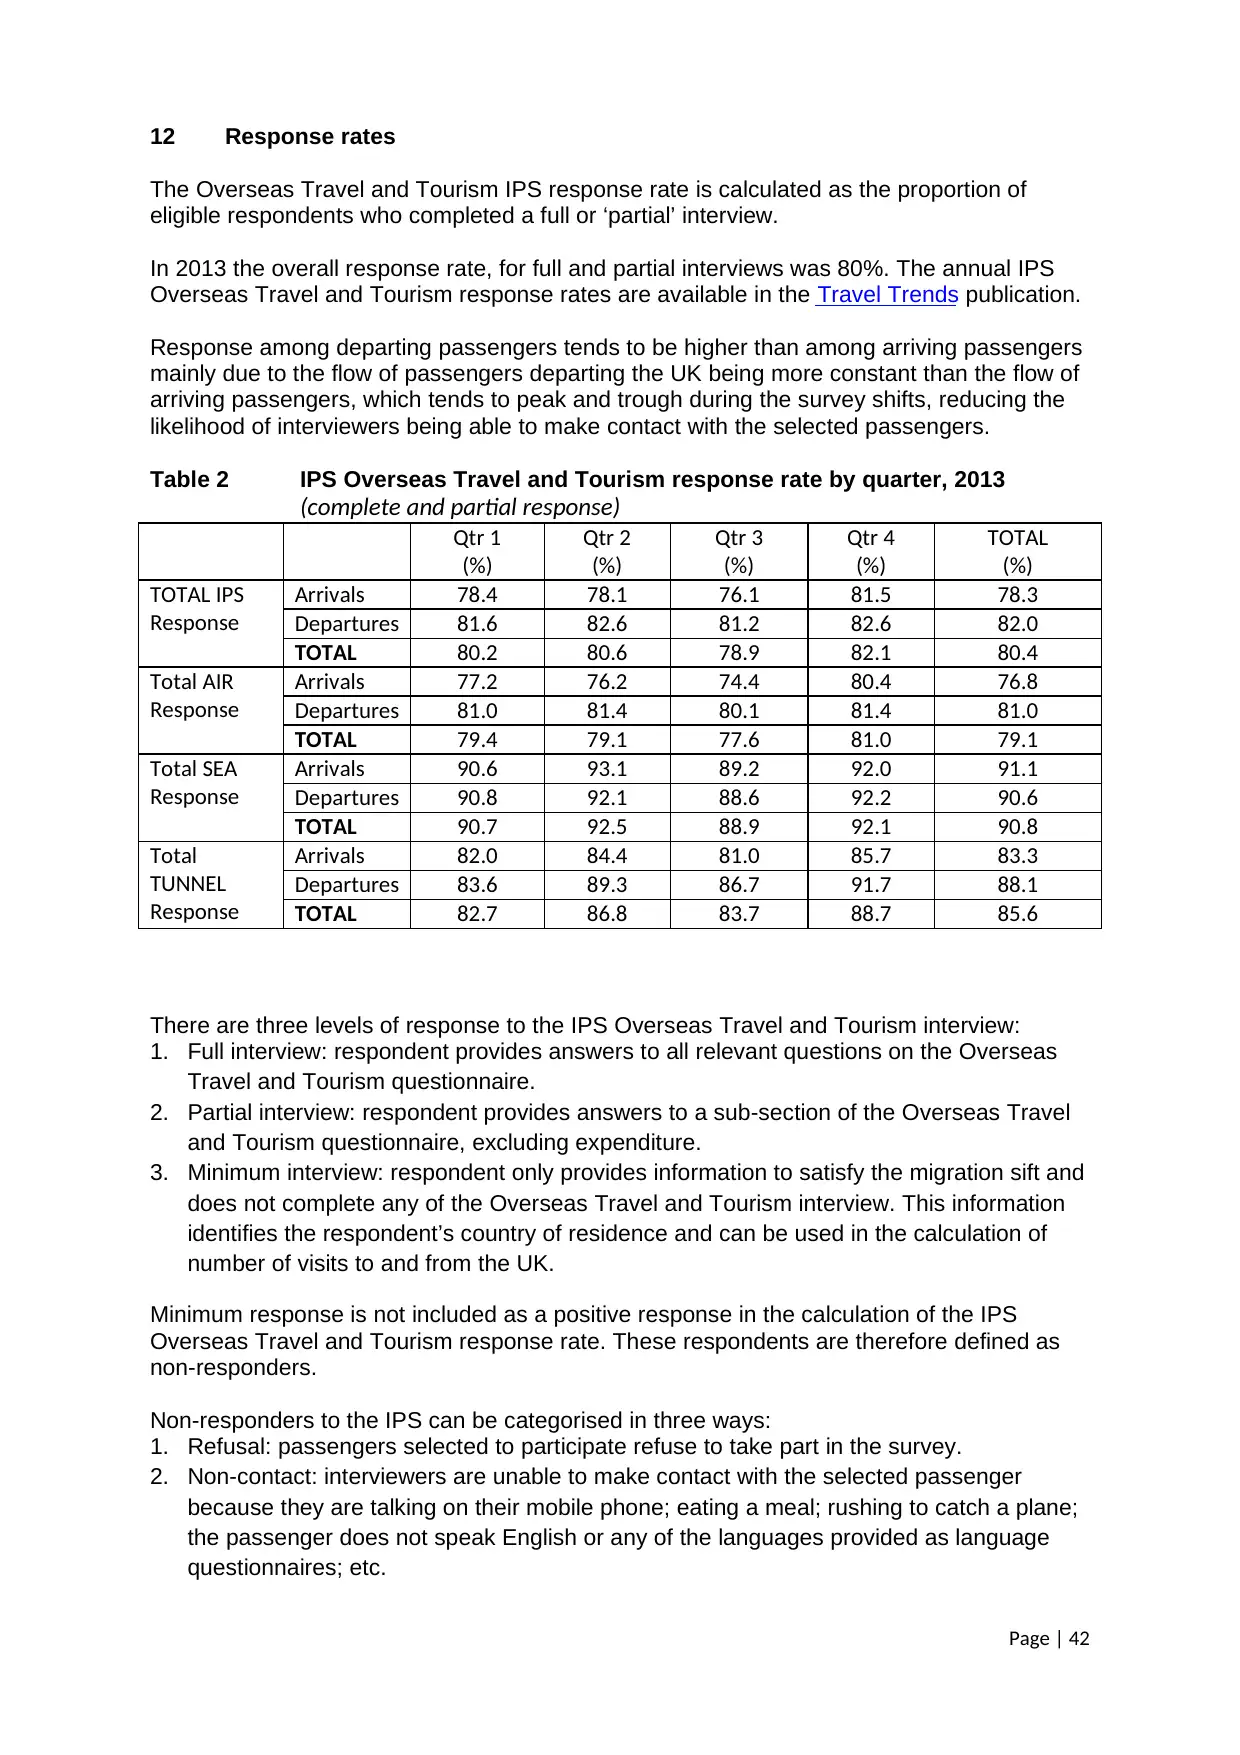
Page | 42
12 Response rates
The Overseas Travel and Tourism IPS response rate is calculated as the proportion of
eligible respondents who completed a full or ‘partial’ interview.
In 2013 the overall response rate, for full and partial interviews was 80%. The annual IPS
Overseas Travel and Tourism response rates are available in the Travel Trends publication.
Response among departing passengers tends to be higher than among arriving passengers
mainly due to the flow of passengers departing the UK being more constant than the flow of
arriving passengers, which tends to peak and trough during the survey shifts, reducing the
likelihood of interviewers being able to make contact with the selected passengers.
Table 2 IPS Overseas Travel and Tourism response rate by quarter, 2013
(complete and partial response)
Qtr 1
(%)
Qtr 2
(%)
Qtr 3
(%)
Qtr 4
(%)
TOTAL
(%)
TOTAL IPS
Response
Arrivals 78.4 78.1 76.1 81.5 78.3
Departures 81.6 82.6 81.2 82.6 82.0
TOTAL 80.2 80.6 78.9 82.1 80.4
Total AIR
Response
Arrivals 77.2 76.2 74.4 80.4 76.8
Departures 81.0 81.4 80.1 81.4 81.0
TOTAL 79.4 79.1 77.6 81.0 79.1
Total SEA
Response
Arrivals 90.6 93.1 89.2 92.0 91.1
Departures 90.8 92.1 88.6 92.2 90.6
TOTAL 90.7 92.5 88.9 92.1 90.8
Total
TUNNEL
Response
Arrivals 82.0 84.4 81.0 85.7 83.3
Departures 83.6 89.3 86.7 91.7 88.1
TOTAL 82.7 86.8 83.7 88.7 85.6
There are three levels of response to the IPS Overseas Travel and Tourism interview:
1. Full interview: respondent provides answers to all relevant questions on the Overseas
Travel and Tourism questionnaire.
2. Partial interview: respondent provides answers to a sub-section of the Overseas Travel
and Tourism questionnaire, excluding expenditure.
3. Minimum interview: respondent only provides information to satisfy the migration sift and
does not complete any of the Overseas Travel and Tourism interview. This information
identifies the respondent’s country of residence and can be used in the calculation of
number of visits to and from the UK.
Minimum response is not included as a positive response in the calculation of the IPS
Overseas Travel and Tourism response rate. These respondents are therefore defined as
non-responders.
Non-responders to the IPS can be categorised in three ways:
1. Refusal: passengers selected to participate refuse to take part in the survey.
2. Non-contact: interviewers are unable to make contact with the selected passenger
because they are talking on their mobile phone; eating a meal; rushing to catch a plane;
the passenger does not speak English or any of the languages provided as language
questionnaires; etc.
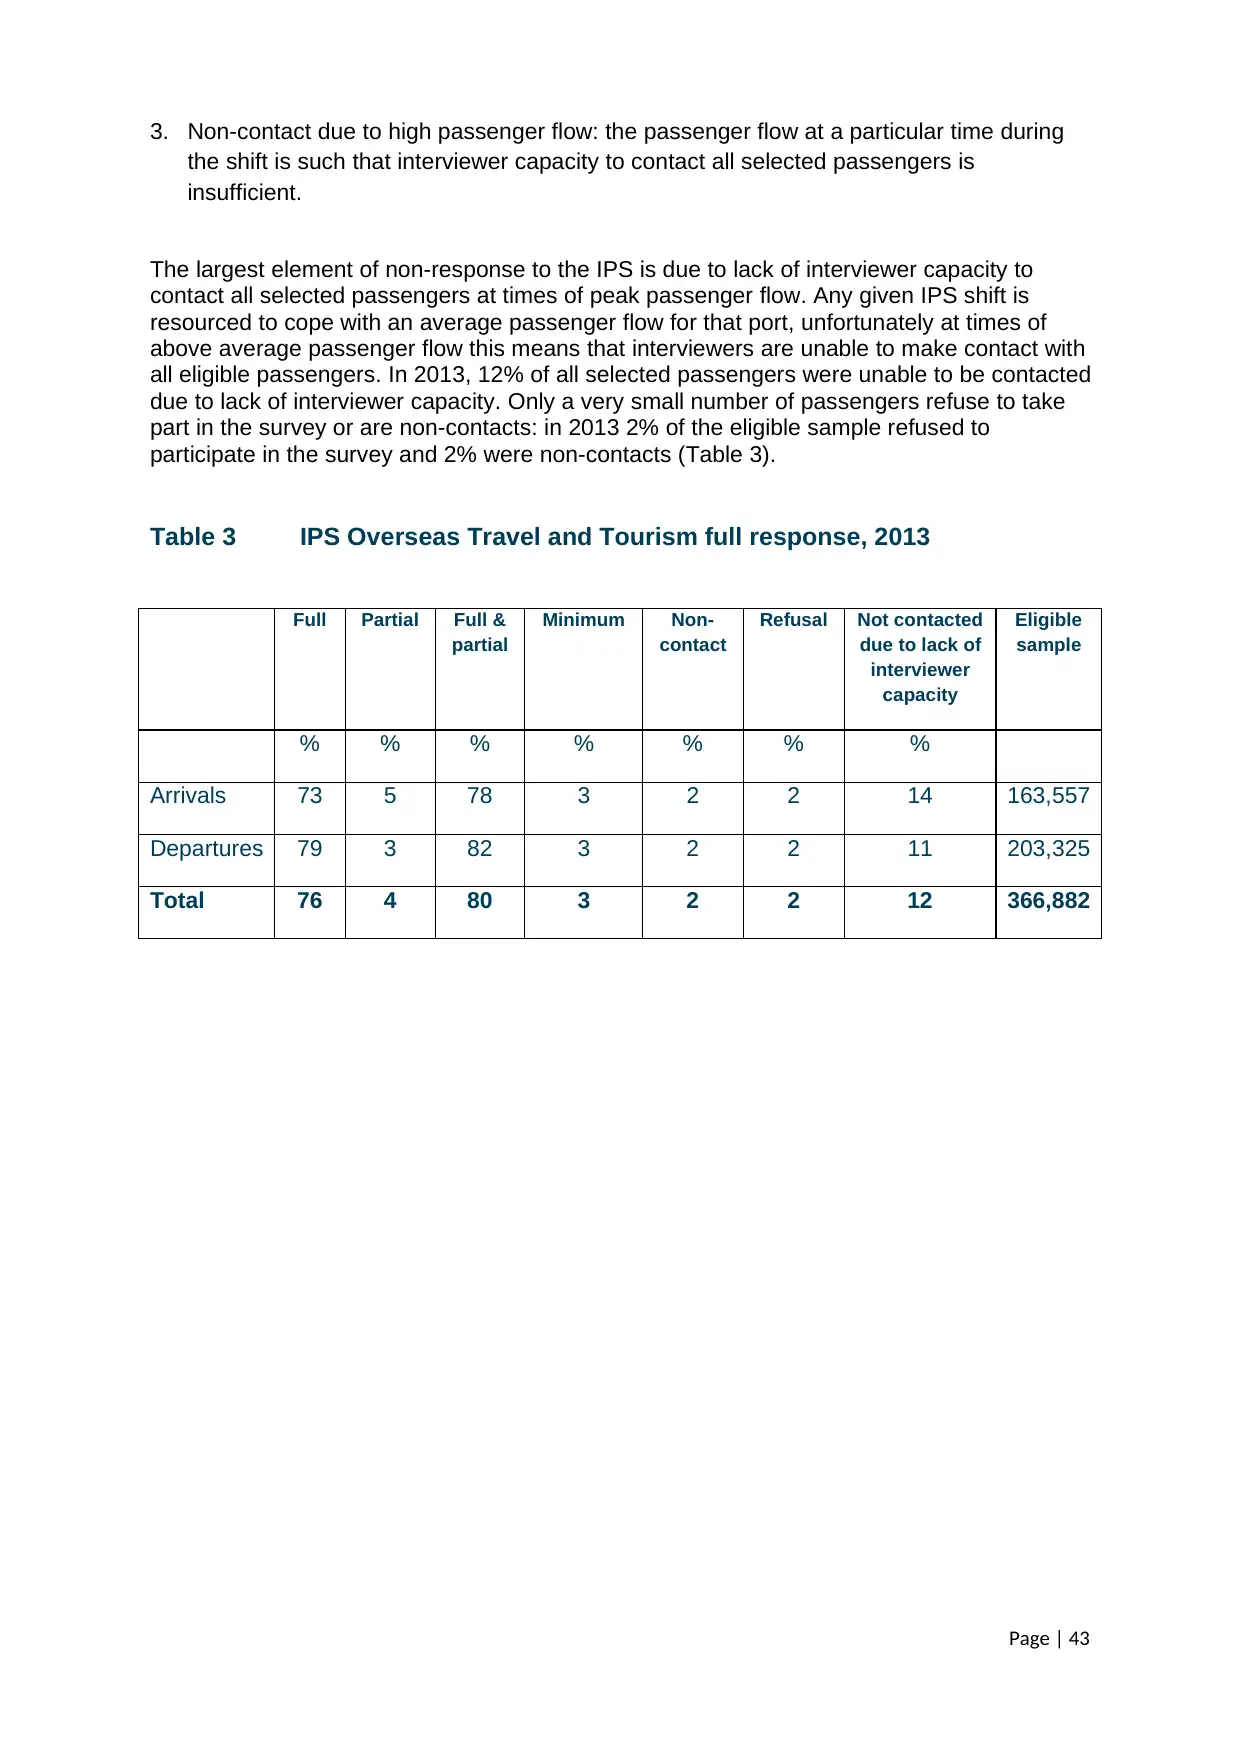
Page | 43
3. Non-contact due to high passenger flow: the passenger flow at a particular time during
the shift is such that interviewer capacity to contact all selected passengers is
insufficient.
The largest element of non-response to the IPS is due to lack of interviewer capacity to
contact all selected passengers at times of peak passenger flow. Any given IPS shift is
resourced to cope with an average passenger flow for that port, unfortunately at times of
above average passenger flow this means that interviewers are unable to make contact with
all eligible passengers. In 2013, 12% of all selected passengers were unable to be contacted
due to lack of interviewer capacity. Only a very small number of passengers refuse to take
part in the survey or are non-contacts: in 2013 2% of the eligible sample refused to
participate in the survey and 2% were non-contacts (Table 3).
Table 3 IPS Overseas Travel and Tourism full response, 2013
Full Partial Full &
partial
Minimum Non-
contact
Refusal Not contacted
due to lack of
interviewer
capacity
Eligible
sample
% % % % % % %
Arrivals 73 5 78 3 2 2 14 163,557
Departures 79 3 82 3 2 2 11 203,325
Total 76 4 80 3 2 2 12 366,882
Paraphrase This Document
Need a fresh take? Get an instant paraphrase of this document with our AI Paraphraser
Page | 44
Publications & Data Dissemination
13 IPS Dissemination and publications
13.1 Publications
ONS publishes the following regular IPS Overseas Travel and Tourism estimates, available
free of charge from the Office for National Statistics website:
Provisional Monthly estimates
Provisional Quarterly estimates
Annual estimates, published as Travel Trends
These publications, data tables from the IPS and other statistics relating to travel and
tourism are available at the Travel and Transport theme page on the Office for National
Statistics website.
Further information about the International Passenger Survey, including the current IPS
questionnaire and interviewer instructions, and methodology information can be found on
the IPS Methodology page on the Office for National Statistics website.
13.2 Accessing datasets
IPS Overseas Travel and Tourism data is available via:
1. TravelPac: this is a simplified version of the IPS Overseas Travel and Tourism dataset,
comprising of 14 of the most widely used variables, and is available quarterly and
annually on the Office for National Statistics website. Data are available online for each
year from 1993 onwards, in both SPSS and Excel formats.
2. Larger IPS Overseas Travel and Tourism datasets are available through the UK Data
Archive. These datasets are deposited quarterly and annually.
13.3 Other analyses
General enquiries about the IPS or requests for ad hoc analyses of the Overseas Travel and‐
Tourism data should be directed to:
Office for National Statistics
Data Advice Relations Team
Room 2201
Government Buildings
Cardiff Road
Newport
NP10 8XG
Telephone: +44 (0)1633 455678
E mail: socialsurveys@ons.gsi.gov.uk‐
1 out of 44
Related Documents


Your All-in-One AI-Powered Toolkit for Academic Success.
+13062052269
info@desklib.com
Available 24*7 on WhatsApp / Email
![[object Object]](/_next/static/media/star-bottom.7253800d.svg)
Unlock your academic potential
© 2024 | Zucol Services PVT LTD | All rights reserved.