Interpret Market Trends and Developments
VerifiedAdded on 2023/01/19
|21
|1501
|85
Presentation
AI Summary
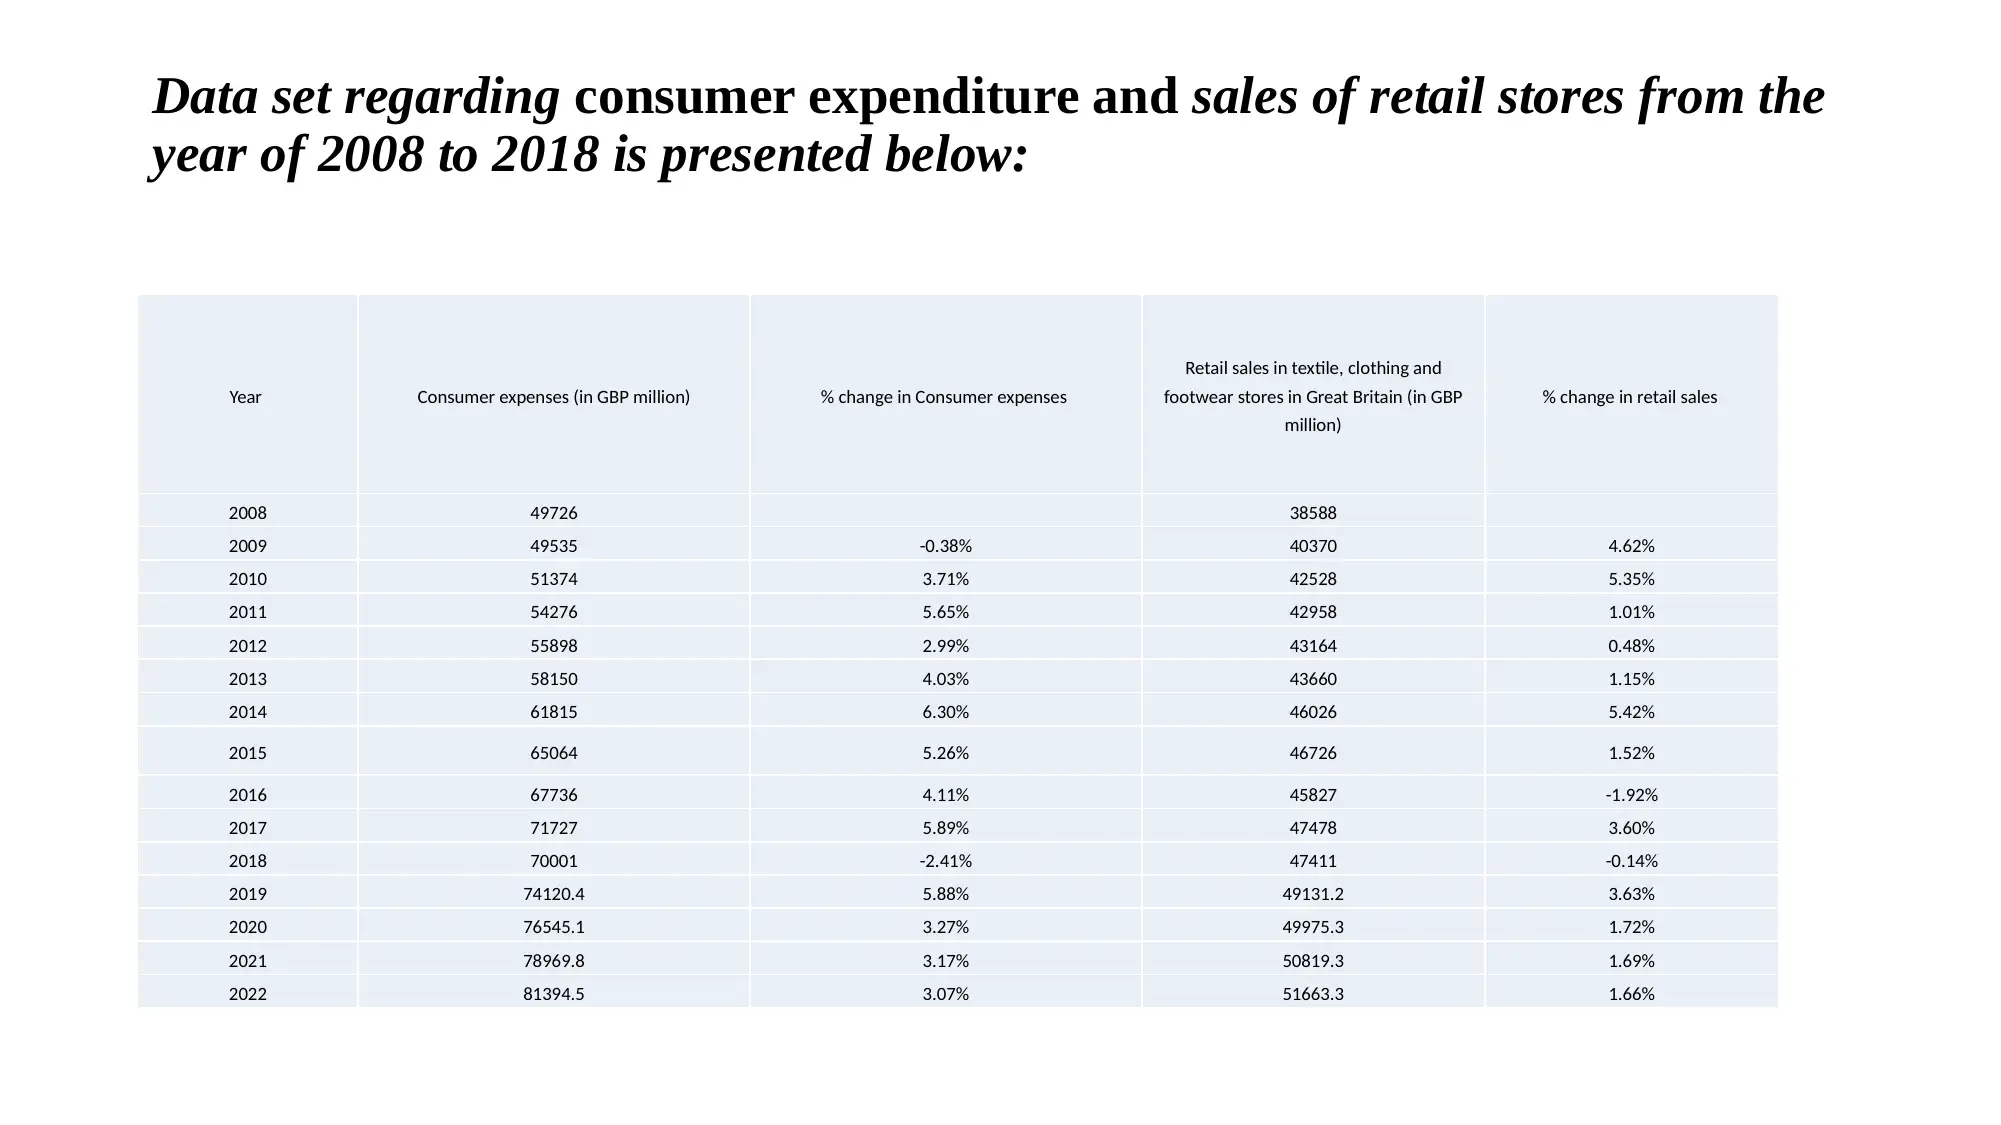
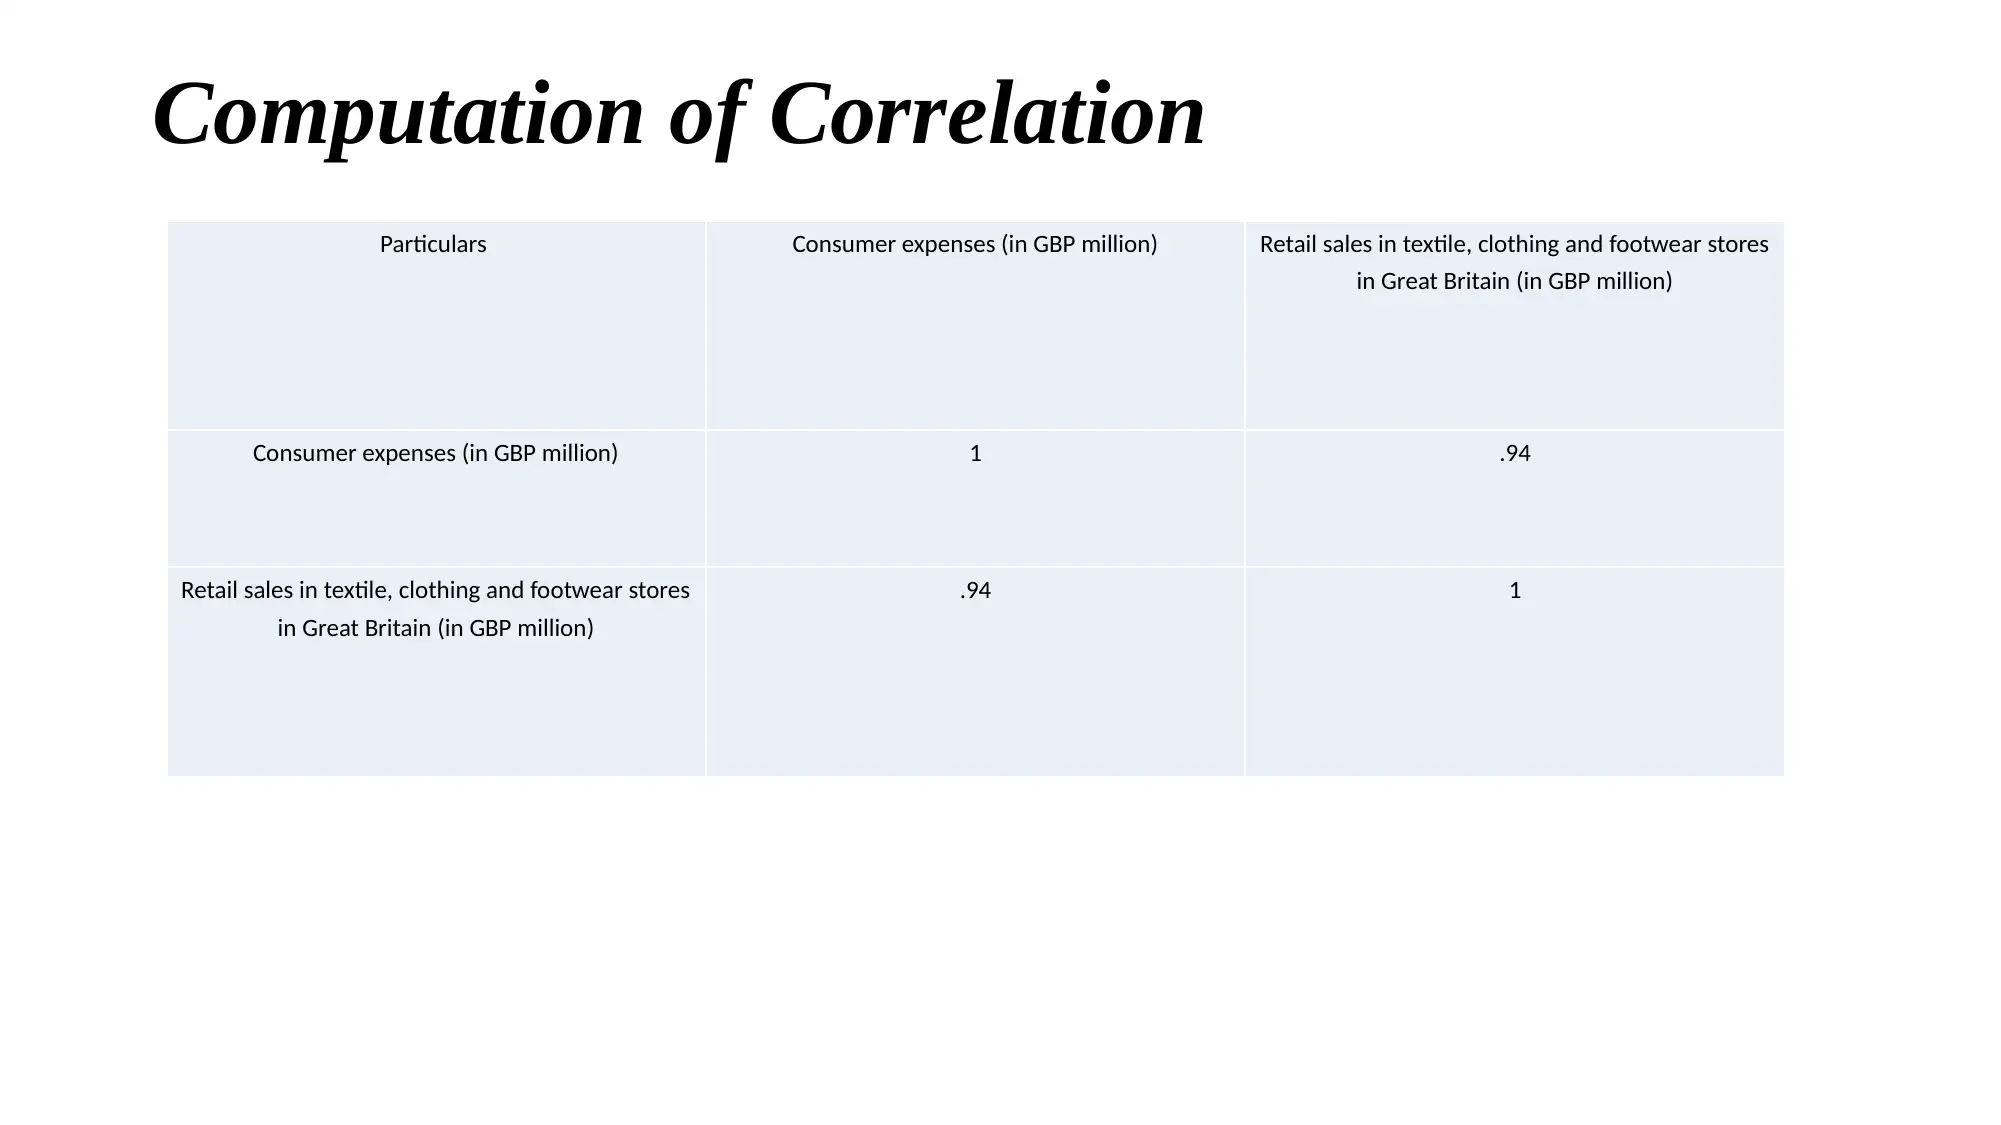
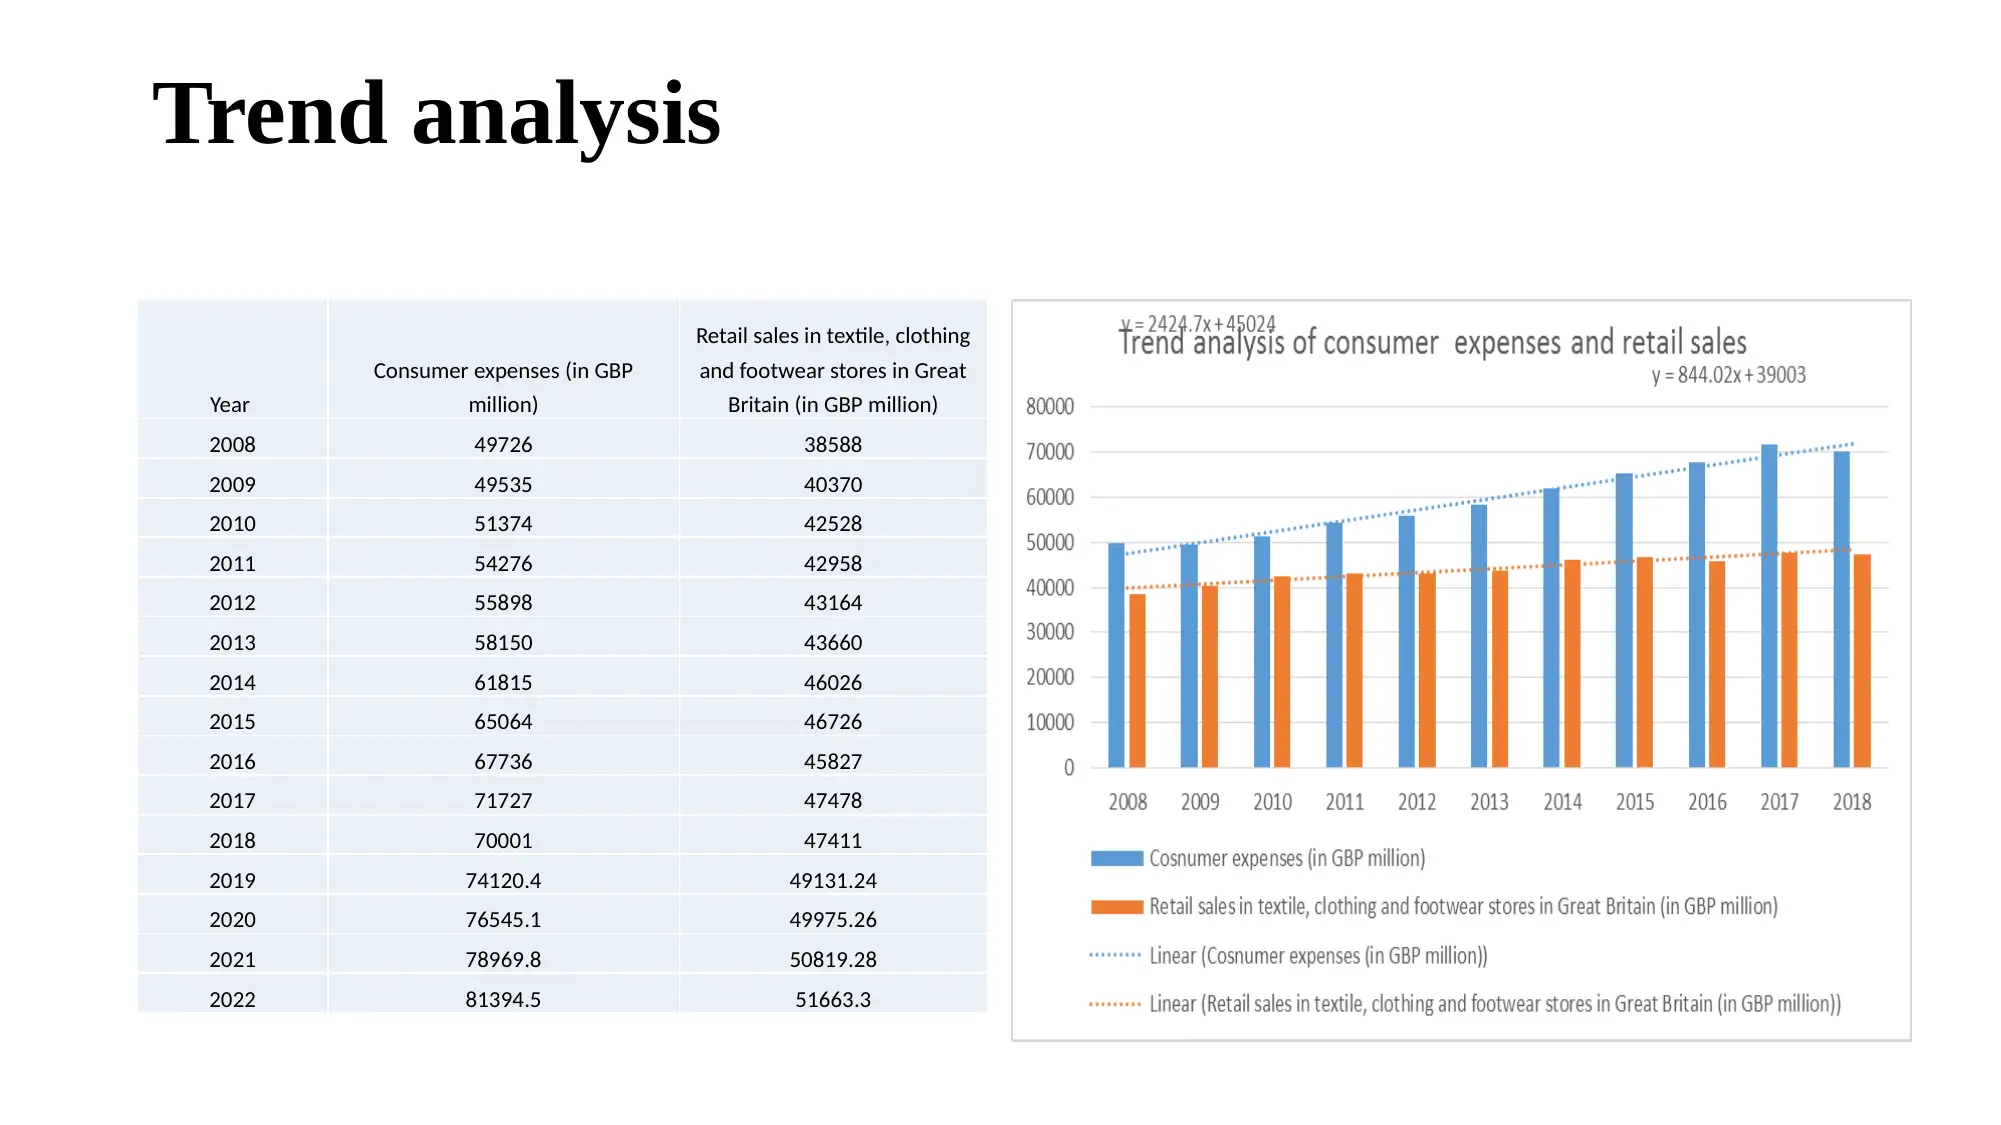
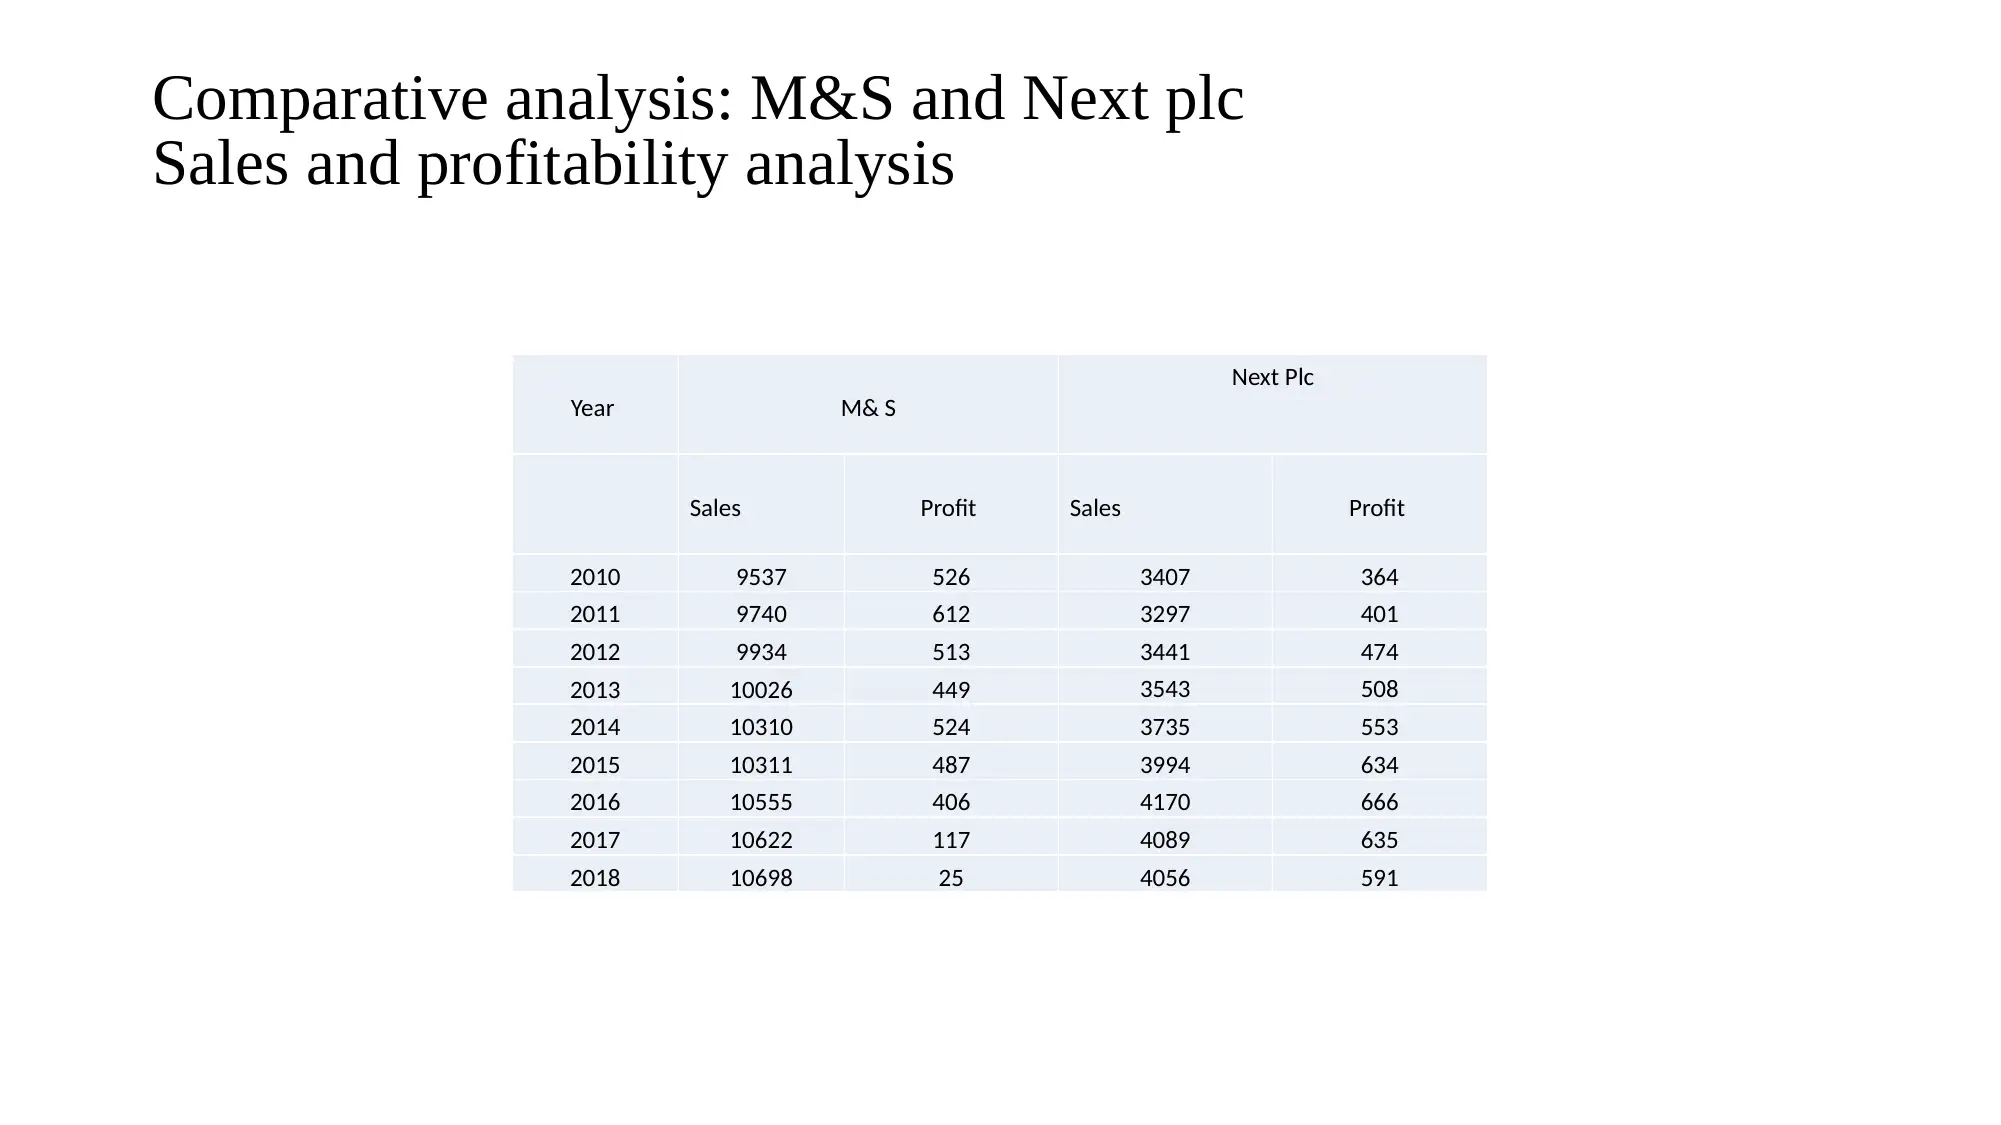
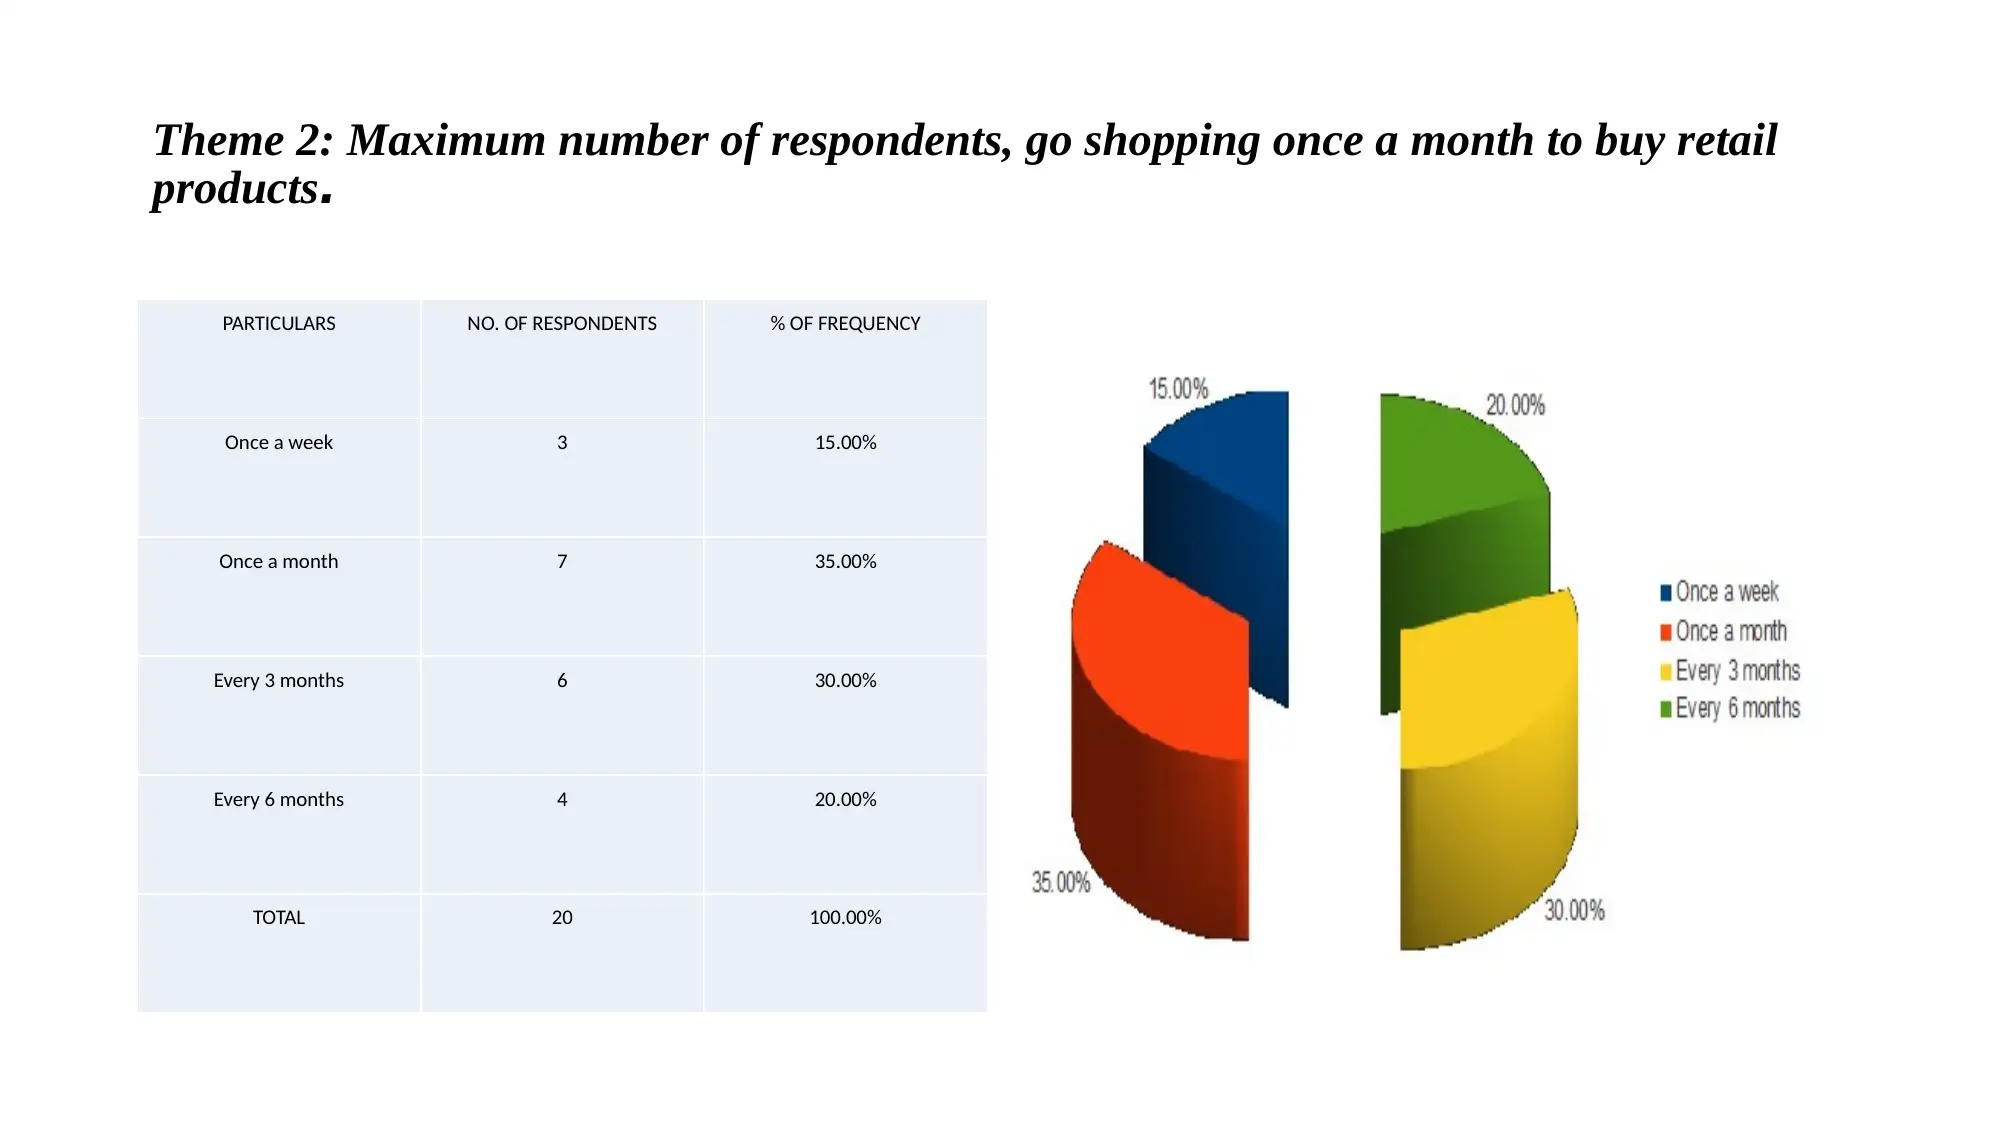
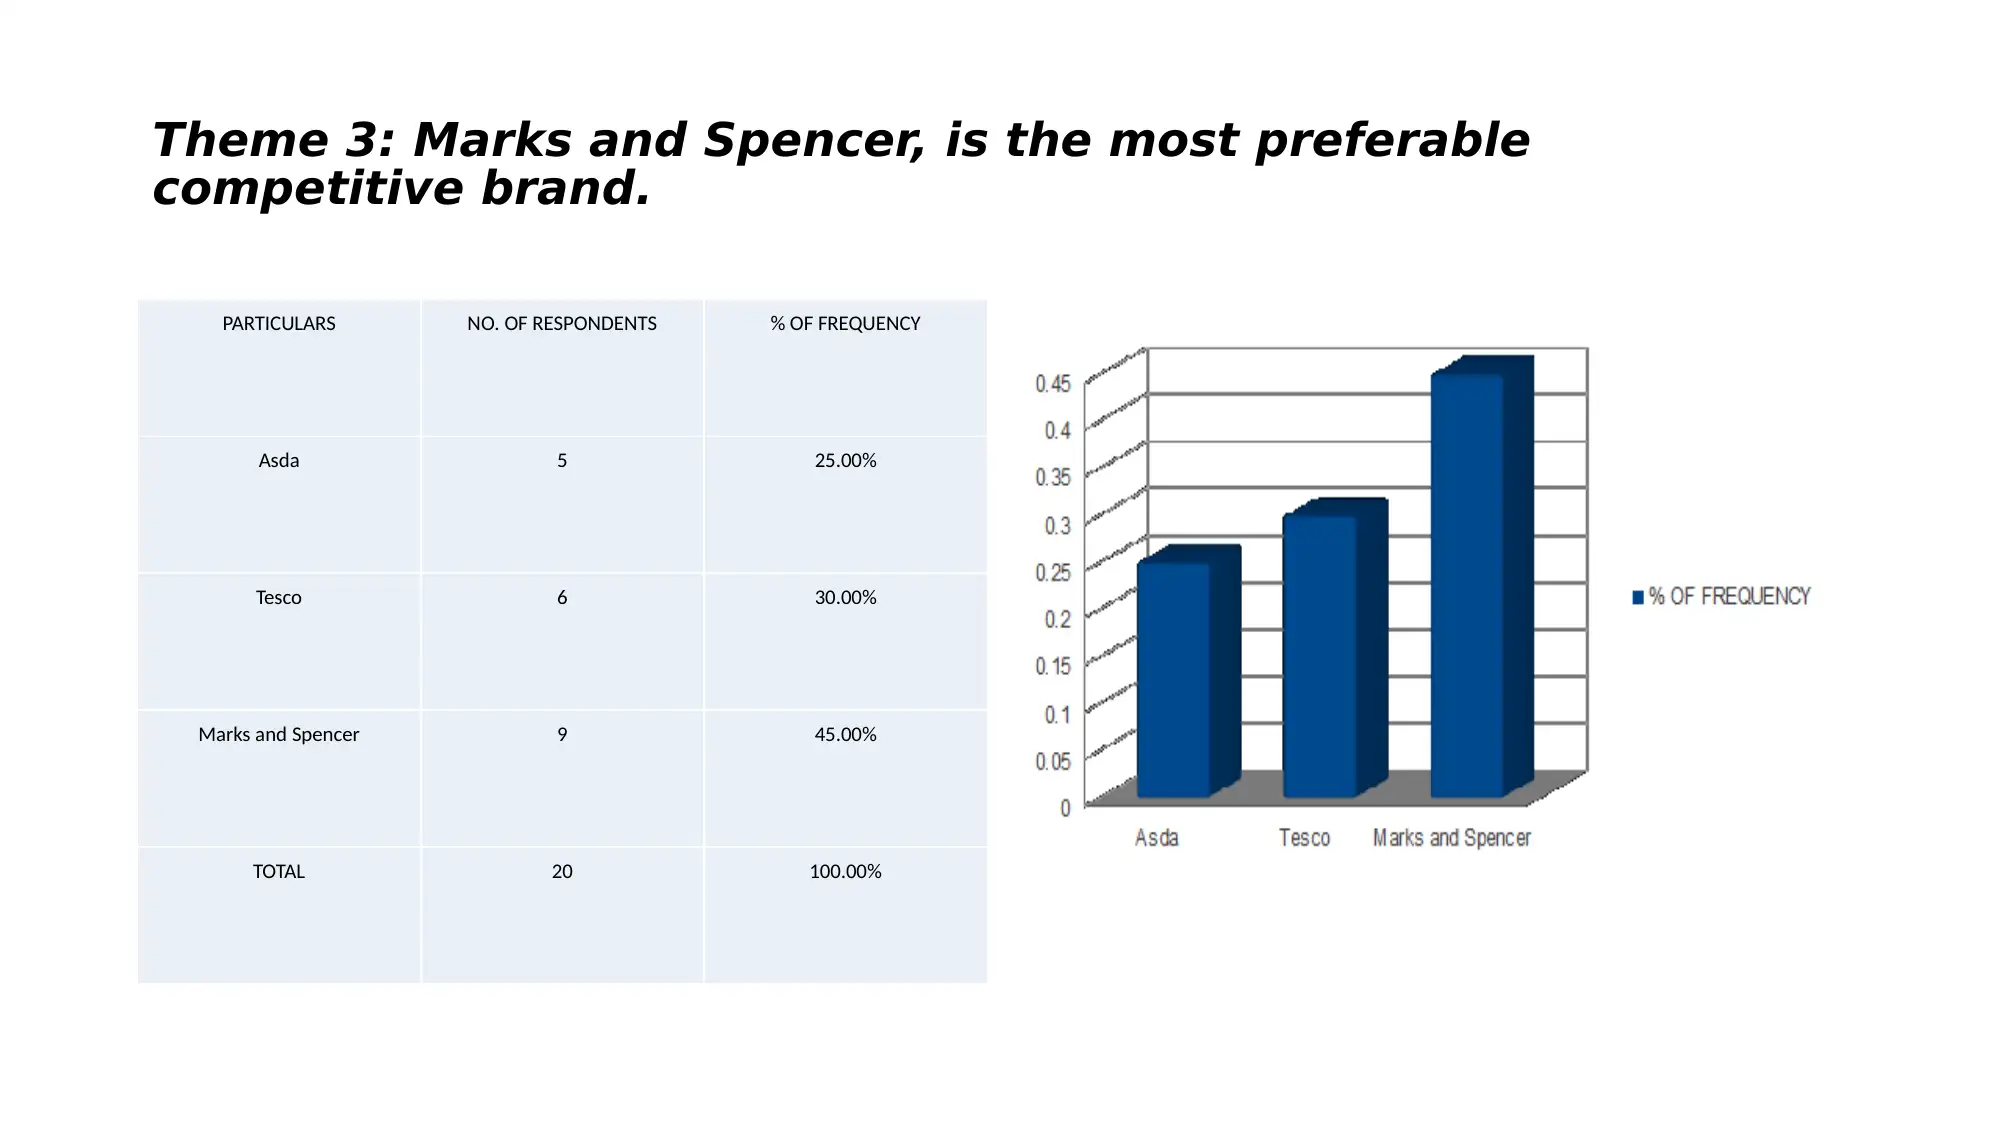
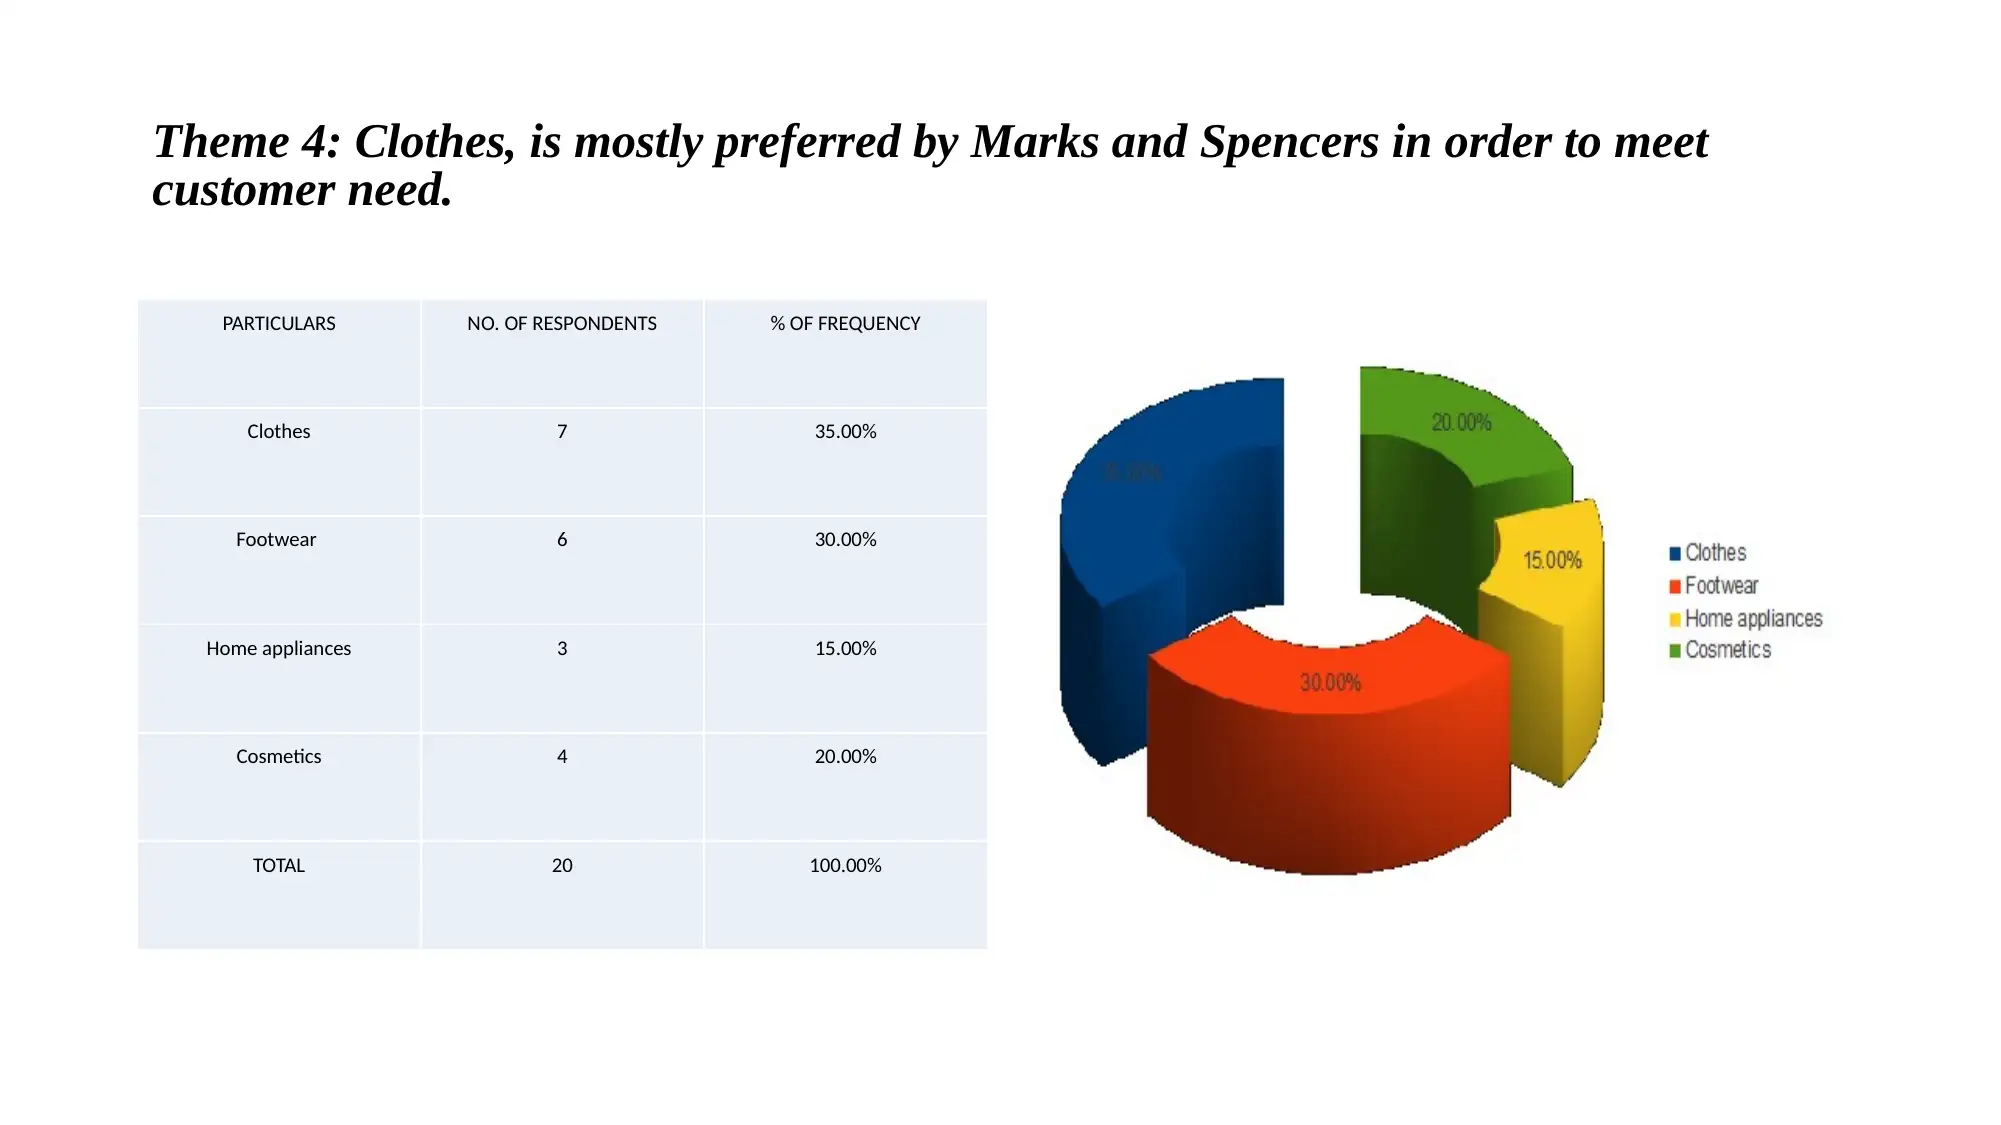
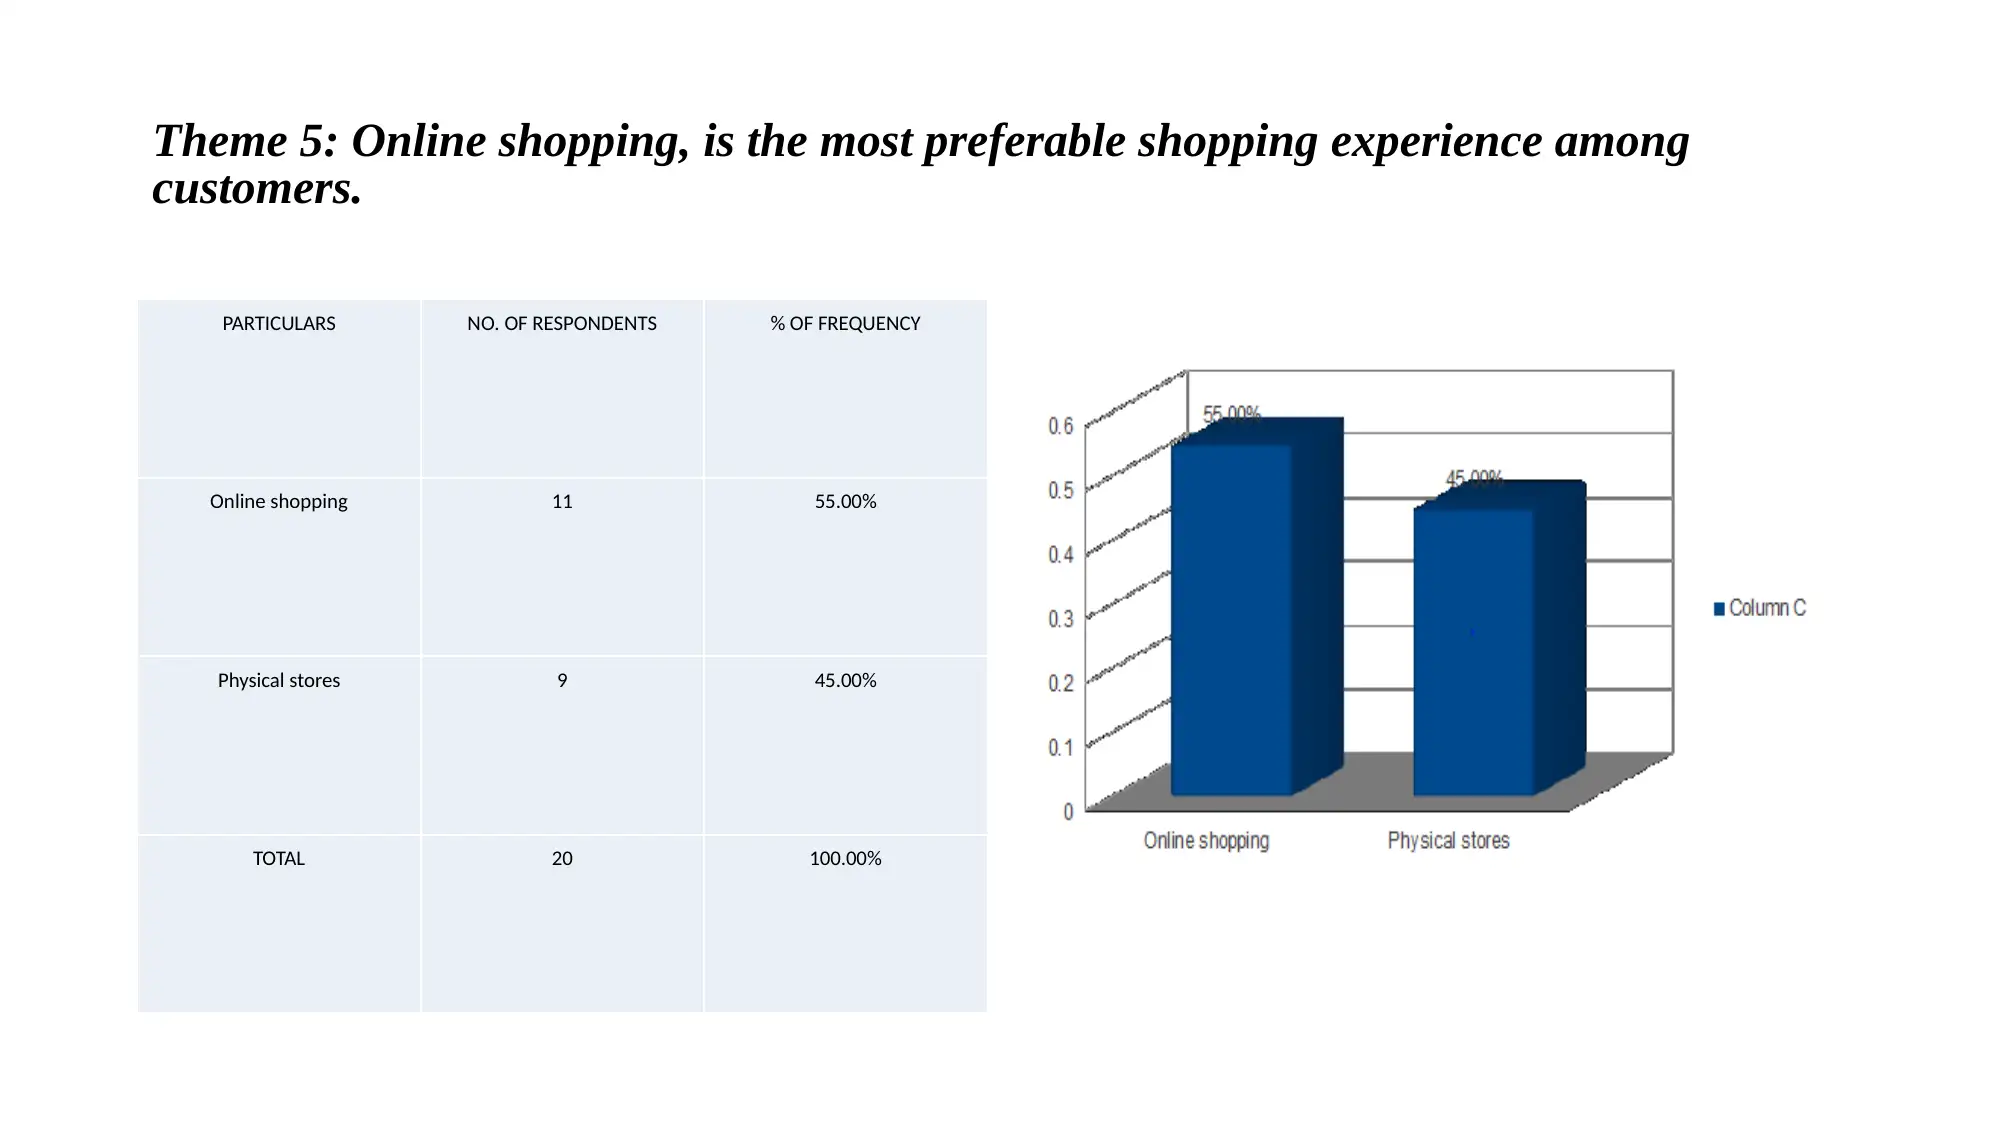
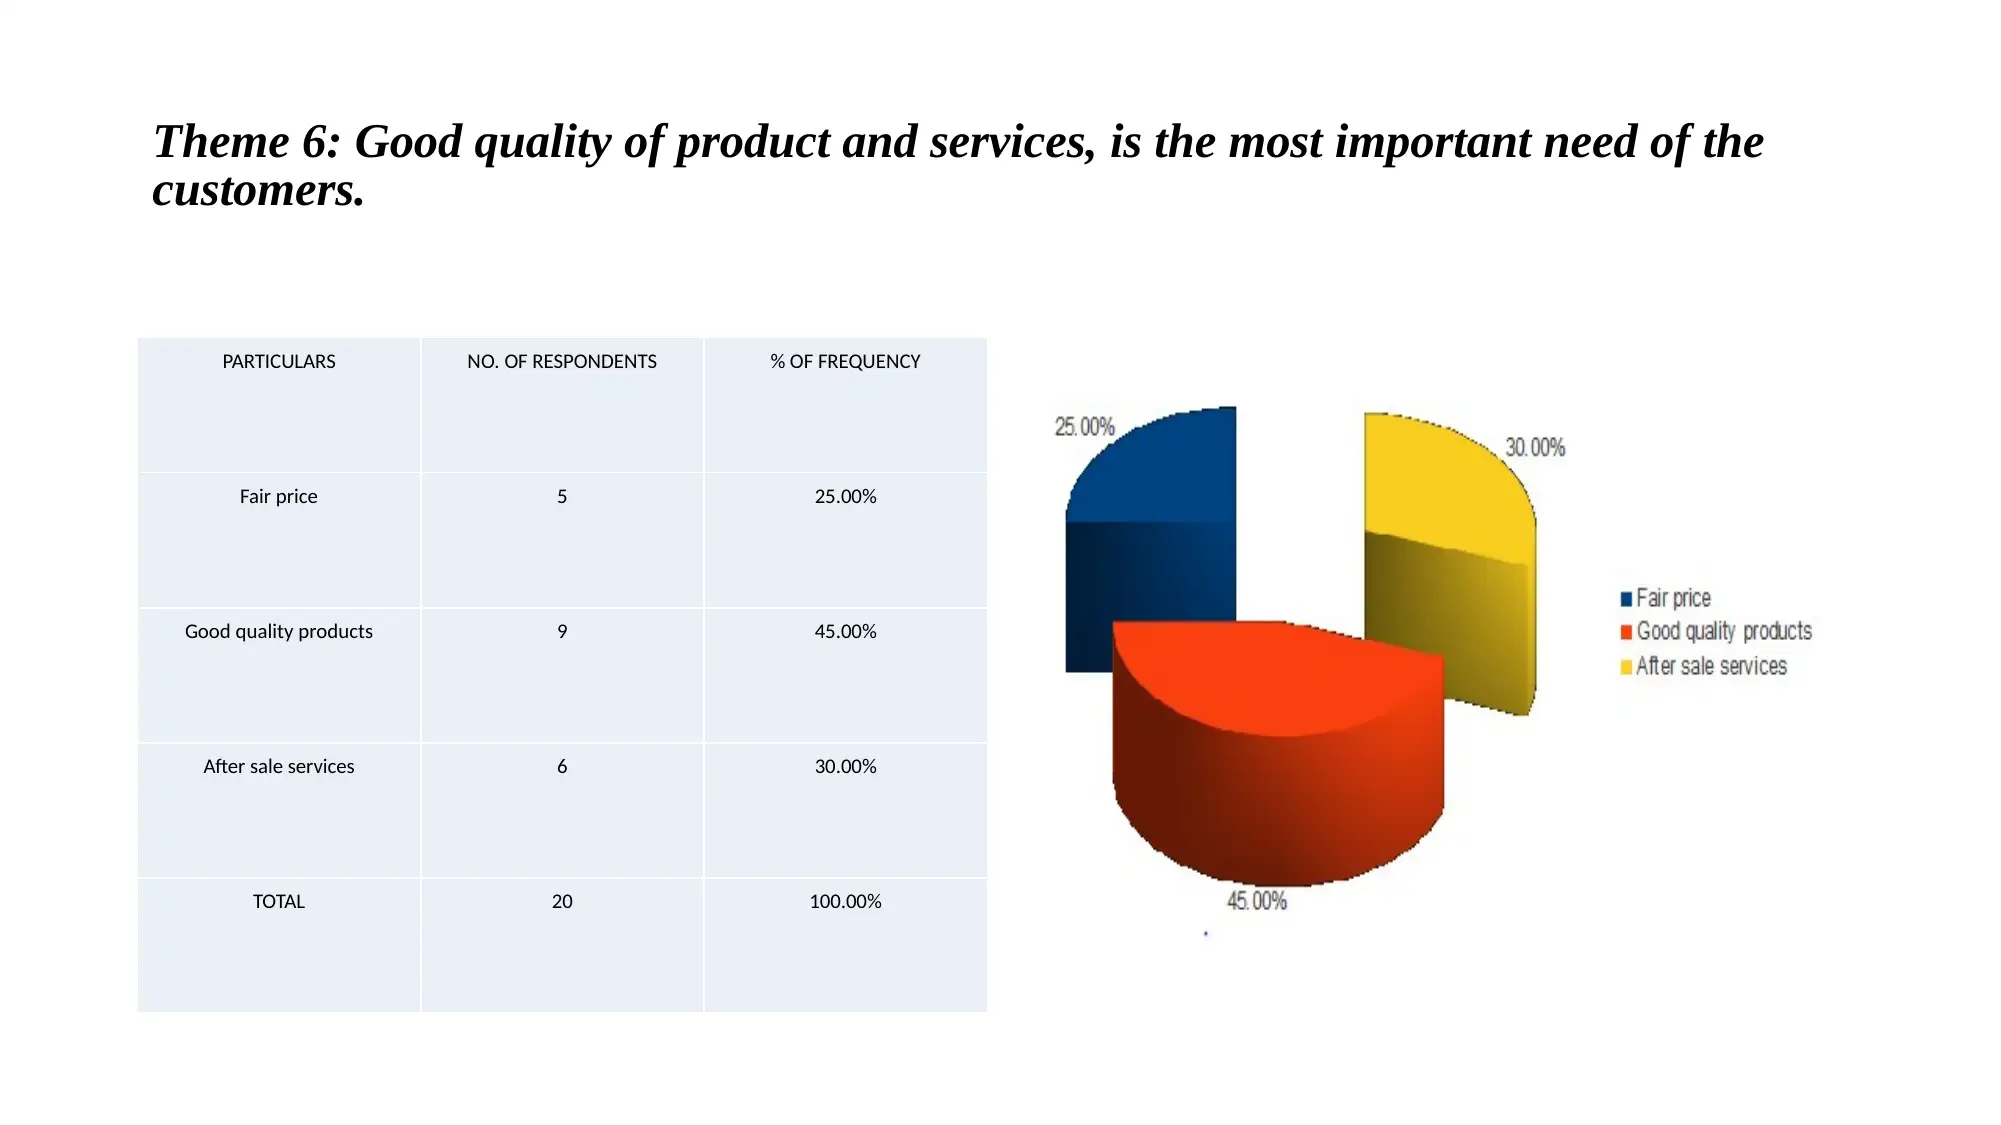
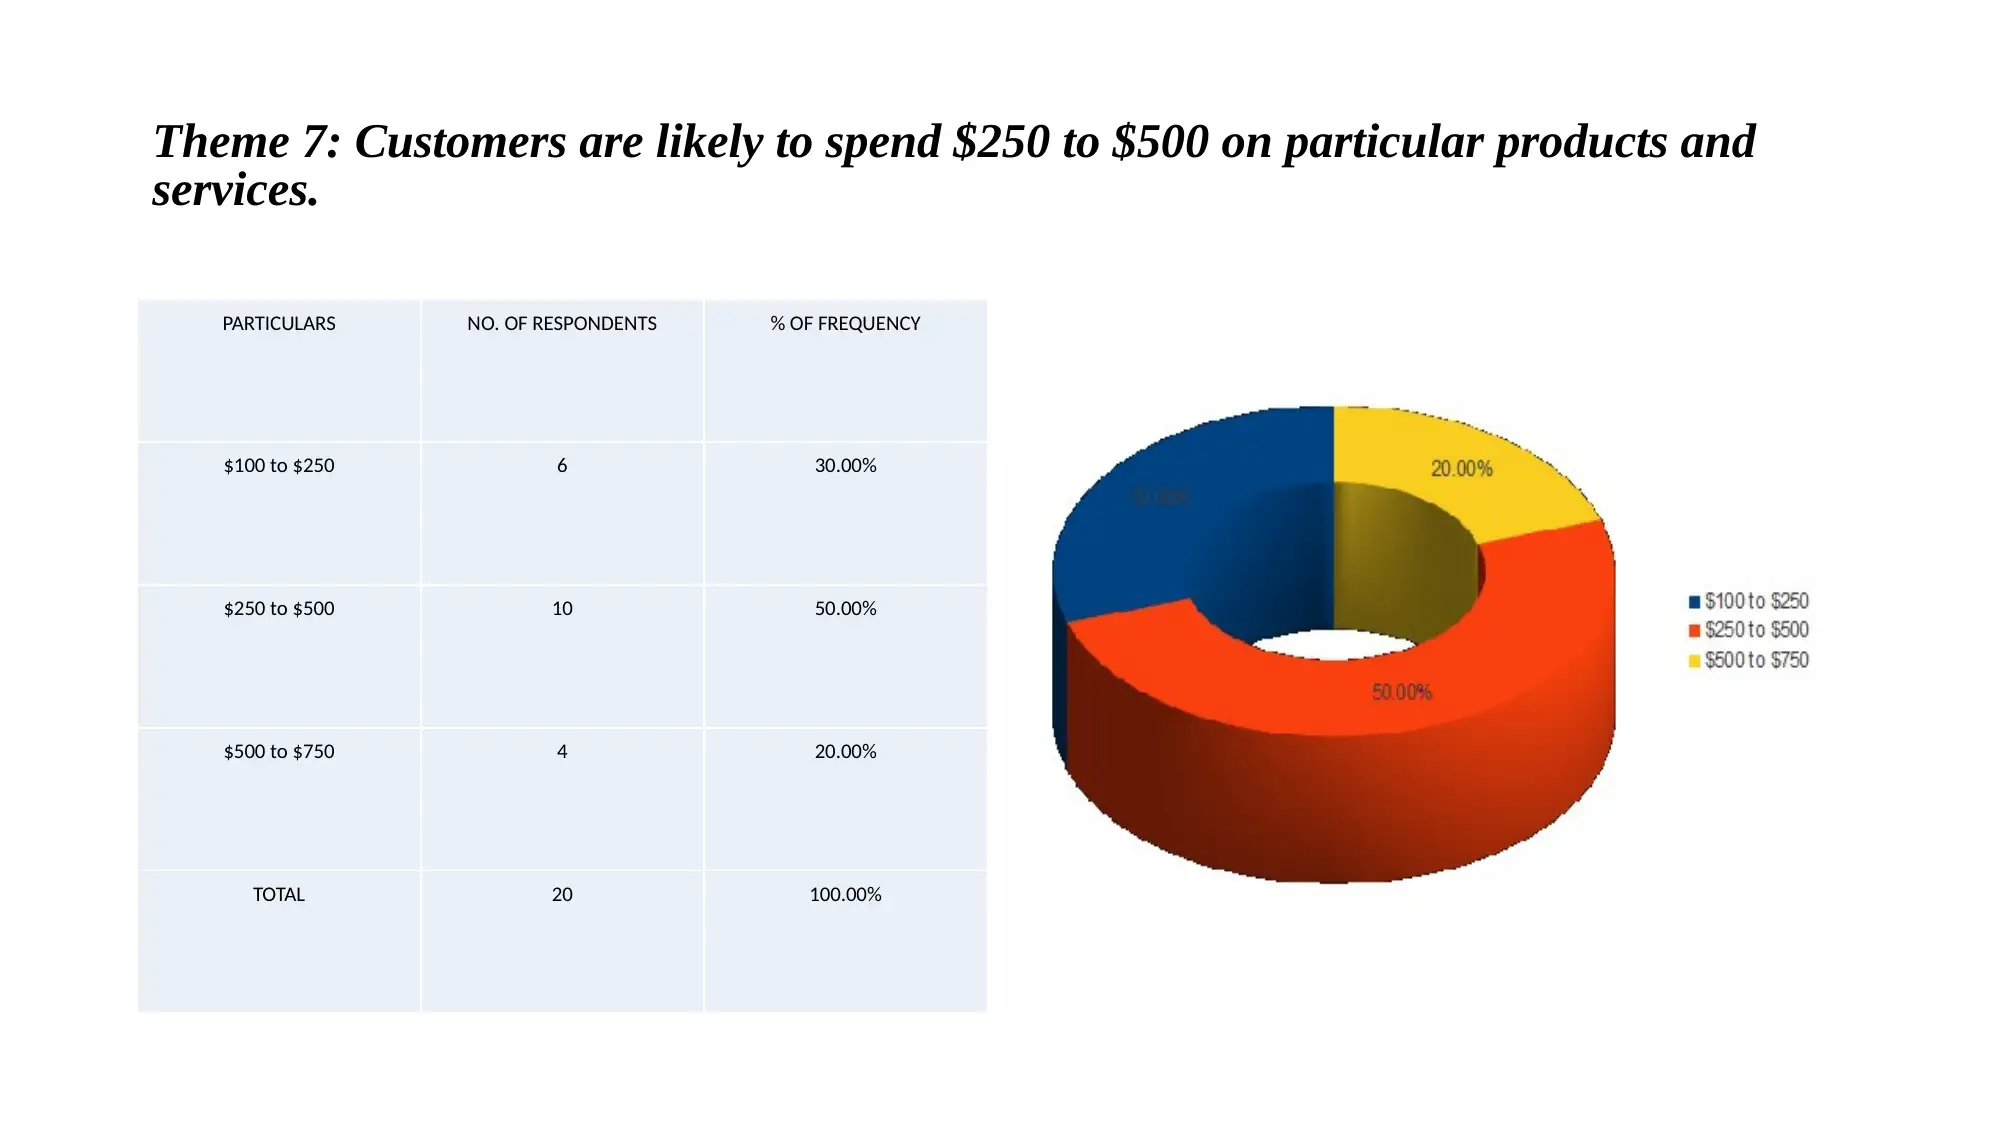
This presentation focuses on the interpretation of market trends and developments to effectively understand customer needs and analyze competitors. It explores the changing market trends and strategies for higher growth and expansion. The presentation includes data sets on consumer expenditure and retail sales, correlation computation, trend analysis, forecasting techniques, and a comparative analysis of M&S and Next plc. It also reviews the marketing plan strategies of Marks and Spencer and presents themes based on customer preferences and shopping habits.
Contribute Materials
Your contribution can guide someone’s learning journey. Share your
documents today.
Interpret market trends and developments
Secure Best Marks with AI Grader
Need help grading? Try our AI Grader for instant feedback on your assignments.
INTRODUCTION
• Interpretation of market trend helps in effectively understanding the
needs of the customers. Analysing market trend is useful in
determining the changing market trends of the competitors for higher
expansion and growth.
• Interpretation of market trend helps in effectively understanding the
needs of the customers. Analysing market trend is useful in
determining the changing market trends of the competitors for higher
expansion and growth.
Project 1
• Products and services
• Current market situation
• Current market strategy
• Internal and external sources
• Legislations, code of practice and regulations
• Products and services
• Current market situation
• Current market strategy
• Internal and external sources
• Legislations, code of practice and regulations
Data set regarding consumer expenditure and sales of retail stores from the
year of 2008 to 2018 is presented below:
Year Consumer expenses (in GBP million) % change in Consumer expenses
Retail sales in textile, clothing and
footwear stores in Great Britain (in GBP
million)
% change in retail sales
2008 49726 38588
2009 49535 -0.38% 40370 4.62%
2010 51374 3.71% 42528 5.35%
2011 54276 5.65% 42958 1.01%
2012 55898 2.99% 43164 0.48%
2013 58150 4.03% 43660 1.15%
2014 61815 6.30% 46026 5.42%
2015 65064 5.26% 46726 1.52%
2016 67736 4.11% 45827 -1.92%
2017 71727 5.89% 47478 3.60%
2018 70001 -2.41% 47411 -0.14%
2019 74120.4 5.88% 49131.2 3.63%
2020 76545.1 3.27% 49975.3 1.72%
2021 78969.8 3.17% 50819.3 1.69%
2022 81394.5 3.07% 51663.3 1.66%
Secure Best Marks with AI Grader
Need help grading? Try our AI Grader for instant feedback on your assignments.
Computation of Correlation
Particulars Consumer expenses (in GBP million) Retail sales in textile, clothing and footwear stores
in Great Britain (in GBP million)
Consumer expenses (in GBP million) 1 .94
Retail sales in textile, clothing and footwear stores
in Great Britain (in GBP million)
.94 1
Particulars Consumer expenses (in GBP million) Retail sales in textile, clothing and footwear stores
in Great Britain (in GBP million)
Consumer expenses (in GBP million) 1 .94
Retail sales in textile, clothing and footwear stores
in Great Britain (in GBP million)
.94 1
Trend analysis
Year
Consumer expenses (in GBP
million)
Retail sales in textile, clothing
and footwear stores in Great
Britain (in GBP million)
2008 49726 38588
2009 49535 40370
2010 51374 42528
2011 54276 42958
2012 55898 43164
2013 58150 43660
2014 61815 46026
2015 65064 46726
2016 67736 45827
2017 71727 47478
2018 70001 47411
2019 74120.4 49131.24
2020 76545.1 49975.26
2021 78969.8 50819.28
2022 81394.5 51663.3
Data pertaining to online sales from the year of 2010 to 2018 is enumerated below:
Year
Percentage change in annual internet textile, clothing and
footwear retail sales value in UK
2010 28.2%
2011 31.1%
2012 19.7%
2013 13.7%
2014 18%
2015 11.8%
2016 5.9%
2017 18.3%
2018 16.6%
Year
Percentage change in annual internet textile, clothing and
footwear retail sales value in UK
2010 28.2%
2011 31.1%
2012 19.7%
2013 13.7%
2014 18%
2015 11.8%
2016 5.9%
2017 18.3%
2018 16.6%
Paraphrase This Document
Need a fresh take? Get an instant paraphrase of this document with our AI Paraphraser
Descriptive statistics
Consumer expenses (in
GBP million)
Retail sales in textile, clothing and footwear stores in
Great Britain (in GBP million)
Mean 59572.90909 44066.91
Standard
Error 2462.098755 879.5119
Median 58150 43660
Mode #N/A #N/A
Standard
Deviation 8165.857768 2917.011
Sample
Variance 66681233.09 8508953
Range 22192 8890
Minimum 49535 38588
Maximum 71727 47478
Data
Year Sales Trend over the years
2010 9537
2011 9740 2.1%
2012 9934 2.0%
2013 10026 0.9%
2014 10310 2.8%
2015 10311 0.0%
2016 10555 2.4%
2017 10622 0.6%
2018 10698 0.7%
Year Sales Trend over the years
2010 9537
2011 9740 2.1%
2012 9934 2.0%
2013 10026 0.9%
2014 10310 2.8%
2015 10311 0.0%
2016 10555 2.4%
2017 10622 0.6%
2018 10698 0.7%
Comparative analysis: M&S and Next plc
Sales and profitability analysis
Year M& S
Next Plc
Sales Profit Sales Profit
2010 9537 526 3407 364
2011 9740 612 3297 401
2012 9934 513 3441 474
2013 10026 449 3543 508
2014 10310 524 3735 553
2015 10311 487 3994 634
2016 10555 406 4170 666
2017 10622 117 4089 635
2018 10698 25 4056 591
Sales and profitability analysis
Year M& S
Next Plc
Sales Profit Sales Profit
2010 9537 526 3407 364
2011 9740 612 3297 401
2012 9934 513 3441 474
2013 10026 449 3543 508
2014 10310 524 3735 553
2015 10311 487 3994 634
2016 10555 406 4170 666
2017 10622 117 4089 635
2018 10698 25 4056 591
Secure Best Marks with AI Grader
Need help grading? Try our AI Grader for instant feedback on your assignments.
Project 2
Reviewing marketing plan strategies of Marks and Spencer.
Marks and Spencer marketing plan strategies are very effective as it
helps in increasing the sales of the company by expanding and selling
business online. Effective pricing strategy helps in retaining prospective
customers. Offering good quality products at reasonable price leads to
higher sustainable growth of the company. The expenses of the
consumers are increasing which states that company needs to launch
varied products and services.
Forecasting techniques
• Surveys of intentions: It is an effective investment technique which
helps in investigating and analysing the market data in order to
identify emerging market needs. This method helps in determining the
current market needs for future growth and success. It helps in
analysing the thought process of the customer while purchasing certain
goods and services.
Theme 1: Maximum number of respondents are customer of Marks and Spencer from 10 to 15 years.
PARTICULARS NO. OF RESPONDENTS % OF FREQUENCY
0 to 5 years 3 15.00%
5 to 10 years 4 20.00%
10 to 15 years 8 40.00%
More than 15 years 5 25.00%
TOTAL 20 100.00%
PARTICULARS NO. OF RESPONDENTS % OF FREQUENCY
0 to 5 years 3 15.00%
5 to 10 years 4 20.00%
10 to 15 years 8 40.00%
More than 15 years 5 25.00%
TOTAL 20 100.00%
Paraphrase This Document
Need a fresh take? Get an instant paraphrase of this document with our AI Paraphraser
Theme 2: Maximum number of respondents, go shopping once a month to buy retail
products.
PARTICULARS NO. OF RESPONDENTS % OF FREQUENCY
Once a week 3 15.00%
Once a month 7 35.00%
Every 3 months 6 30.00%
Every 6 months 4 20.00%
TOTAL 20 100.00%
products.
PARTICULARS NO. OF RESPONDENTS % OF FREQUENCY
Once a week 3 15.00%
Once a month 7 35.00%
Every 3 months 6 30.00%
Every 6 months 4 20.00%
TOTAL 20 100.00%
Theme 3: Marks and Spencer, is the most preferable
competitive brand.
PARTICULARS NO. OF RESPONDENTS % OF FREQUENCY
Asda 5 25.00%
Tesco 6 30.00%
Marks and Spencer 9 45.00%
TOTAL 20 100.00%
competitive brand.
PARTICULARS NO. OF RESPONDENTS % OF FREQUENCY
Asda 5 25.00%
Tesco 6 30.00%
Marks and Spencer 9 45.00%
TOTAL 20 100.00%
Theme 4: Clothes, is mostly preferred by Marks and Spencers in order to meet
customer need.
PARTICULARS NO. OF RESPONDENTS % OF FREQUENCY
Clothes 7 35.00%
Footwear 6 30.00%
Home appliances 3 15.00%
Cosmetics 4 20.00%
TOTAL 20 100.00%
customer need.
PARTICULARS NO. OF RESPONDENTS % OF FREQUENCY
Clothes 7 35.00%
Footwear 6 30.00%
Home appliances 3 15.00%
Cosmetics 4 20.00%
TOTAL 20 100.00%
Secure Best Marks with AI Grader
Need help grading? Try our AI Grader for instant feedback on your assignments.
Theme 5: Online shopping, is the most preferable shopping experience among
customers.
PARTICULARS NO. OF RESPONDENTS % OF FREQUENCY
Online shopping 11 55.00%
Physical stores 9 45.00%
TOTAL 20 100.00%
customers.
PARTICULARS NO. OF RESPONDENTS % OF FREQUENCY
Online shopping 11 55.00%
Physical stores 9 45.00%
TOTAL 20 100.00%
Theme 6: Good quality of product and services, is the most important need of the
customers.
PARTICULARS NO. OF RESPONDENTS % OF FREQUENCY
Fair price 5 25.00%
Good quality products 9 45.00%
After sale services 6 30.00%
TOTAL 20 100.00%
customers.
PARTICULARS NO. OF RESPONDENTS % OF FREQUENCY
Fair price 5 25.00%
Good quality products 9 45.00%
After sale services 6 30.00%
TOTAL 20 100.00%
Theme 7: Customers are likely to spend $250 to $500 on particular products and
services.
PARTICULARS NO. OF RESPONDENTS % OF FREQUENCY
$100 to $250 6 30.00%
$250 to $500 10 50.00%
$500 to $750 4 20.00%
TOTAL 20 100.00%
services.
PARTICULARS NO. OF RESPONDENTS % OF FREQUENCY
$100 to $250 6 30.00%
$250 to $500 10 50.00%
$500 to $750 4 20.00%
TOTAL 20 100.00%
Paraphrase This Document
Need a fresh take? Get an instant paraphrase of this document with our AI Paraphraser
CONCLUSION
• From the above study it has been concluded that, interpret market trends and development for a
specific business. It further helps in establishing the products and services, current market
situation, current market strategy, internal and external sources and legislations for the particular
organization. This study further demonstrates, data set regarding consumer expenditure and sales
of retail stores. It has been evaluated that, the consumer expenses of the company has been
showing increasing trend in the future as compared with retail sales. Furthermore, this study
forecast the current market needs for future growth and success of the company using survey of
intentions. Furthermore, this study carries out qualitative analysis in order to demonstrate the
success of marketing activities. Lastly, this report helps in final market analysis.
REFERENCES
• Books and journals
• Edwards, R.D., Magee, J. and Bassetti, W.C., 2018. Technical analysis of stock trends. CRC press.
• McDonald, M. and Wilson, H., 2016. Marketing Plans: How to prepare them, how to profit from them. John Wiley & Sons.
• Armstrong, G.M and et.al., 2018. Marketing: an introduction. Pearson UK.
• Bai, J., Philippon, T. and Savov, A., 2016. Have financial markets become more informative?. Journal of Financial
Economics, 122(3), pp.625-654.
• Sik, O., 2017. Plan and market under socialism. Routledge.
• Wagner, W.P., 2017. Trends in expert system development: A longitudinal content analysis of over thirty years of expert system case
studies. Expert systems with applications, 76, pp.85-96.
• Lidstone, J. and MacLennan, J., 2017. Marketing planning for the pharmaceutical industry. Routledge.
• Kotler, P., Kartajaya, H. and Setiawan, I., 2016. Marketing 4.0: Moving from traditional to digital. John Wiley & Sons.
• Holmberg, J. ed., 2019. Policies for a small planet: from the international institute for environment and development (Vol. 4).
Routledge.
• Carley, M. and Christie, I., 2017. Managing sustainable development. Routledge.
• Online
• M&S to lose its decades long status as the number one clothing retailer to Primark. 2018. [Online]. Available through:
<https://www.globaldata.com/ms-lose-decades-long-status-number-one-clothing-retailer-primark/>
1 out of 21
Related Documents
Your All-in-One AI-Powered Toolkit for Academic Success.
+13062052269
info@desklib.com
Available 24*7 on WhatsApp / Email
Unlock your academic potential
© 2024 | Zucol Services PVT LTD | All rights reserved.