Research Report: E-commerce Impacts on Customer Behavior Analysis
VerifiedAdded on 2020/05/11
|29
|4508
|108
Report
AI Summary
This report details a research project investigating the impact of E-commerce on customer behavior. It begins with an introduction to data collection methods, including questionnaires, and identifies data sources such as malls, businesses, and social media. The report describes data pre-processing techniques like data reduction, cleaning, and transformation, as well as feature selection. The methodology employs a mixed-methods approach, combining qualitative and quantitative research. The questionnaire design, sample size considerations, and data analysis methods are outlined, including the use of tables and graphs for data representation. The report also covers experiment design and implementation, analysis of results, and summarization of findings, offering insights into how E-commerce influences customer purchasing decisions and online behavior. The research utilizes a questionnaire to gather data on customer demographics, their usage of E-commerce platforms, and their purchasing habits, culminating in an analysis of the collected data and presentation of results using tables and charts.

1
INTRODUCTION TO RESEARCH
The Name of the Student
The Name of the Course
The Name of the Professor
The Name of the School
The City and State where it is located
Date
INTRODUCTION TO RESEARCH
The Name of the Student
The Name of the Course
The Name of the Professor
The Name of the School
The City and State where it is located
Date
Paraphrase This Document
Need a fresh take? Get an instant paraphrase of this document with our AI Paraphraser
2
Table of Contents
List of Tables........................................................................................................................4
List of Figures.......................................................................................................................5
1.0 Data collection................................................................................................................6
1.1 The sources of data.......................................................................................................6
1.2 Collection of data.........................................................................................................7
1.3 Storage of data..............................................................................................................8
2.0 Experiment design and implementation......................................................................9
2.1 Data pre-processing......................................................................................................9
2.2 Feature selection or dimension reduction..................................................................11
2.3 Experiment designing.................................................................................................12
2.3.1 The steps of designing the questionnaire............................................................12
2.4 Implementation of the research..................................................................................16
2.4.1 The sample size...................................................................................................16
2.4.2 Analysis of the number of respondents who took place in the research.............17
3
2.4.3 Representation of the numbers of the respondents who took part in the research
using graphs...........................................................................................................................18
2.4.4 The results of the research...................................................................................22
2.4.5 Representation of the results using pie charts.....................................................23
3.0 Experiment result analysis and summary..................................................................24
3.1 The results estimation................................................................................................24
3.2 The summary of the results........................................................................................25
4.0 Outline of experiment and result analysis.................................................................26
References...........................................................................................................................28
⊘ This is a preview!⊘
Do you want full access?
Subscribe today to unlock all pages.
Trusted by 1+ million students worldwide
4
List of Tables
Table 1: Data collection table..............................................................................................5
Table 2: Data storage table..................................................................................................6
Table 3: A table of pre-processing, selection and reduction of data...............................9
Table 4: A table showing the classification of the respondents according to their
gender, age range, and background...........................................................................................11
Table 5: A table showing the numbers of the respondents who participated in the
research.........................................................................................................................................16
Table 6: A table showing the summary of the results of the research..........................20
Paraphrase This Document
Need a fresh take? Get an instant paraphrase of this document with our AI Paraphraser
5
List of Figures
Figure 1: Diagrammatic representation of data pre-processing techniques................10
Figure 2: A pie chart to represent the percentages of the respondents according to
their gender..................................................................................................................................18
Figure 3: A bar graph to represent the numbers of the respondents according to their
age range.......................................................................................................................................19
Figure 4: A bar graph to represent the numbers of the respondents classified
according to their background...................................................................................................20
Figure 5: A pie chart representing the percentages of the respondents who use and
those who don’t use the social media and or the internet to purchase their products or
services..........................................................................................................................................22
Figure 6: A pie chart representing the percentages of the male and the female
respondents who use the social media and or the internet to purchase their products or
services..........................................................................................................................................23
6
1.0 Data collection
Before we conduct any research, it is required to collect the data which will be used in the
research. Therefore, data collection is normally the first step which should be applied in any
research process. We have various methods which can be used in the data collection process. The
most commonly used data collection methods include questionnaire or survey data collection
method, conducting interviews, direct observation, and experimentation (Sullivan-Bolyai, Bova,
and Singh, 2014). The researchers should choose the best data collection method which will meet
their needs at a low cost and without spending so much of their time. Questionnaire or survey
method is the most common method of data collection used by many researchers. In the data
collection process, the researchers should also identify the best sources which contain the
required data. After collection of the required data, the data is normally recorded in data
collection tables for easier analysis of the data. The data may also be stored in data storage tables
for future references (Yamada and Wuttig, 2007, pp.824-832).
1.1 The sources of data
Before starting the experiment, the researchers should identify the available sources of the
required data. They should choose the best sources for them to have an easy time in the data
collection process. Our research aims to study the impacts of E-commerce on the behavior of
customers in business. The customers who use the internet to study about businesses and
⊘ This is a preview!⊘
Do you want full access?
Subscribe today to unlock all pages.
Trusted by 1+ million students worldwide
7
purchase their products or services over the internet can be found in malls, in businesses which
use E-commerce services, in institutions, in the social media or many other places or
organizations. Therefore, the malls, the businesses which use E-commerce services, the
institutions, and the social media will be the main sources of the data to be used in our research.
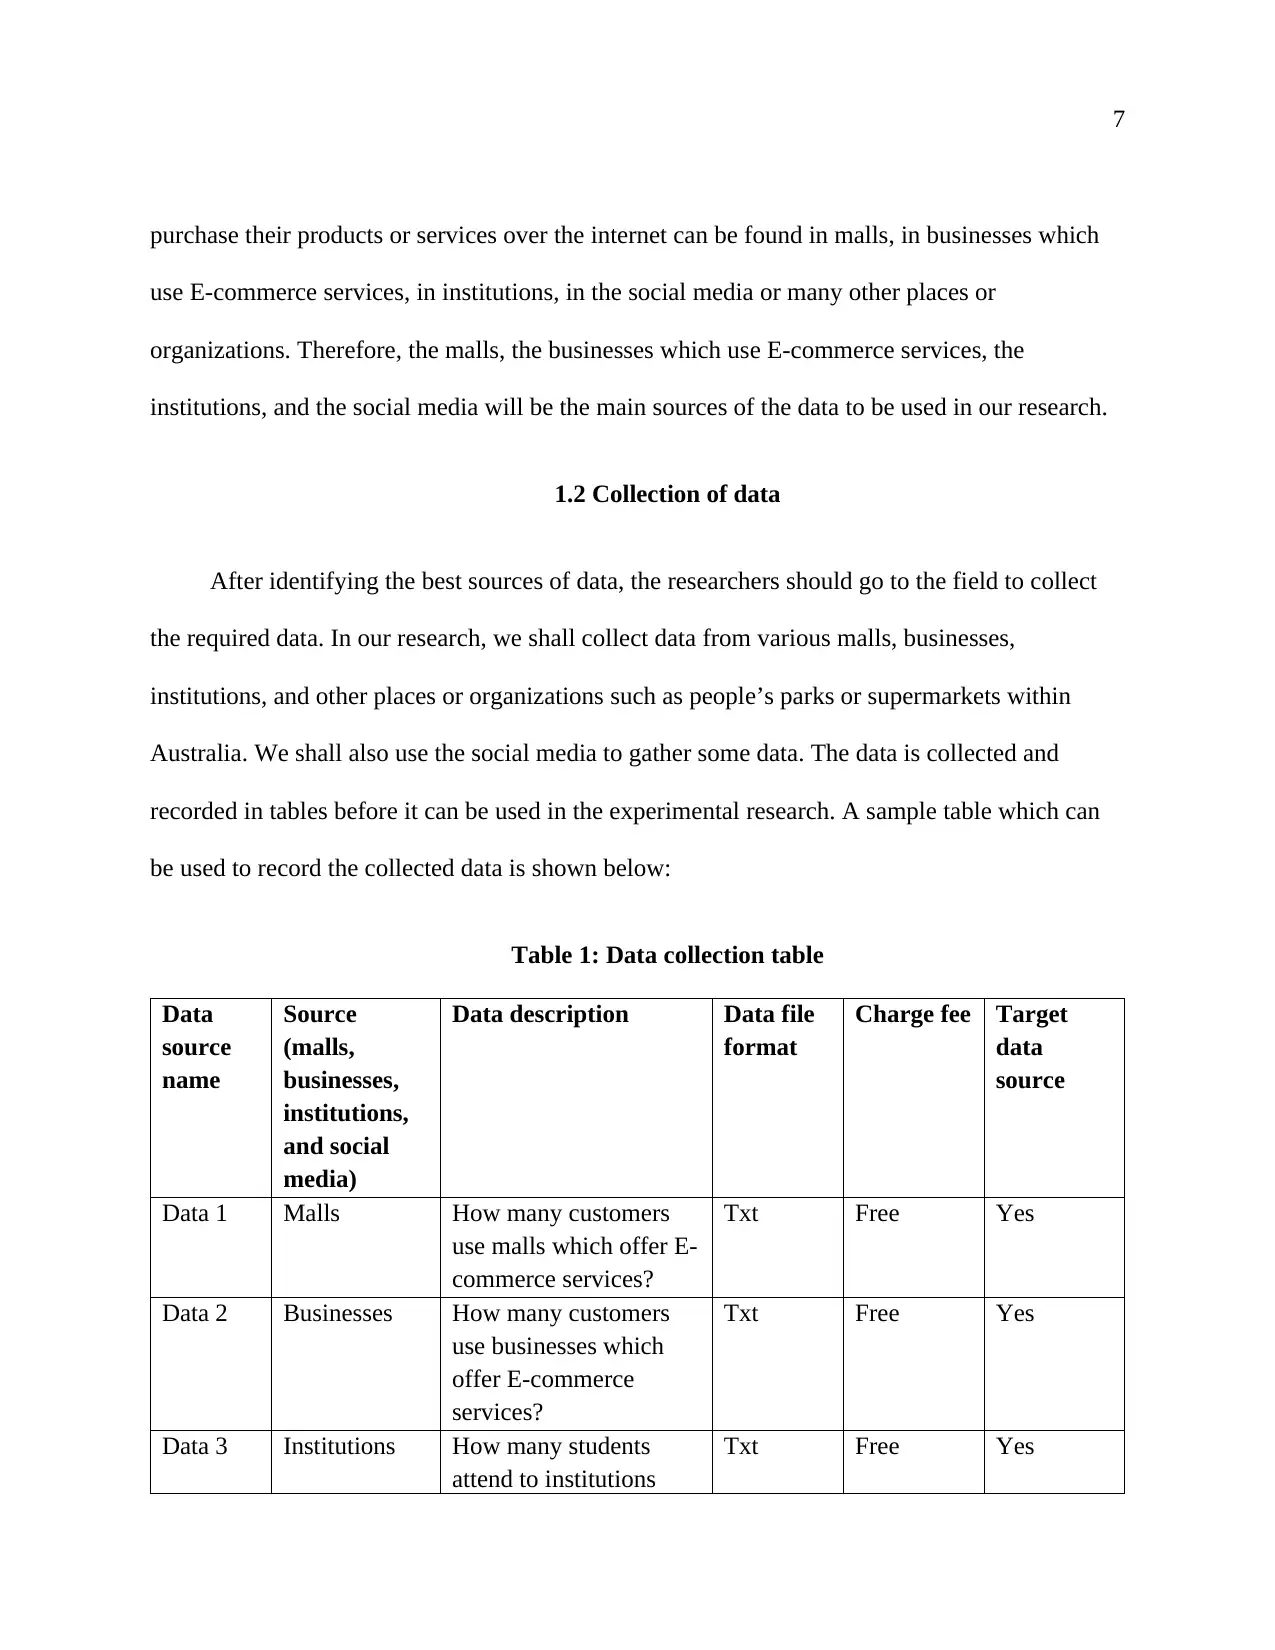
1.2 Collection of data
After identifying the best sources of data, the researchers should go to the field to collect
the required data. In our research, we shall collect data from various malls, businesses,
institutions, and other places or organizations such as people’s parks or supermarkets within
Australia. We shall also use the social media to gather some data. The data is collected and
recorded in tables before it can be used in the experimental research. A sample table which can
be used to record the collected data is shown below:
Table 1: Data collection table
Data
source
name
Source
(malls,
businesses,
institutions,
and social
media)
Data description Data file
format
Charge fee Target
data
source
Data 1 Malls How many customers
use malls which offer E-
commerce services?
Txt Free Yes
Data 2 Businesses How many customers
use businesses which
offer E-commerce
services?
Txt Free Yes
Data 3 Institutions How many students
attend to institutions
Txt Free Yes
purchase their products or services over the internet can be found in malls, in businesses which
use E-commerce services, in institutions, in the social media or many other places or
organizations. Therefore, the malls, the businesses which use E-commerce services, the
institutions, and the social media will be the main sources of the data to be used in our research.
1.2 Collection of data
After identifying the best sources of data, the researchers should go to the field to collect
the required data. In our research, we shall collect data from various malls, businesses,
institutions, and other places or organizations such as people’s parks or supermarkets within
Australia. We shall also use the social media to gather some data. The data is collected and
recorded in tables before it can be used in the experimental research. A sample table which can
be used to record the collected data is shown below:
Table 1: Data collection table
Data
source
name
Source
(malls,
businesses,
institutions,
and social
media)
Data description Data file
format
Charge fee Target
data
source
Data 1 Malls How many customers
use malls which offer E-
commerce services?
Txt Free Yes
Data 2 Businesses How many customers
use businesses which
offer E-commerce
services?
Txt Free Yes
Data 3 Institutions How many students
attend to institutions
Txt Free Yes
Paraphrase This Document
Need a fresh take? Get an instant paraphrase of this document with our AI Paraphraser
8
which offer E-
commerce services?
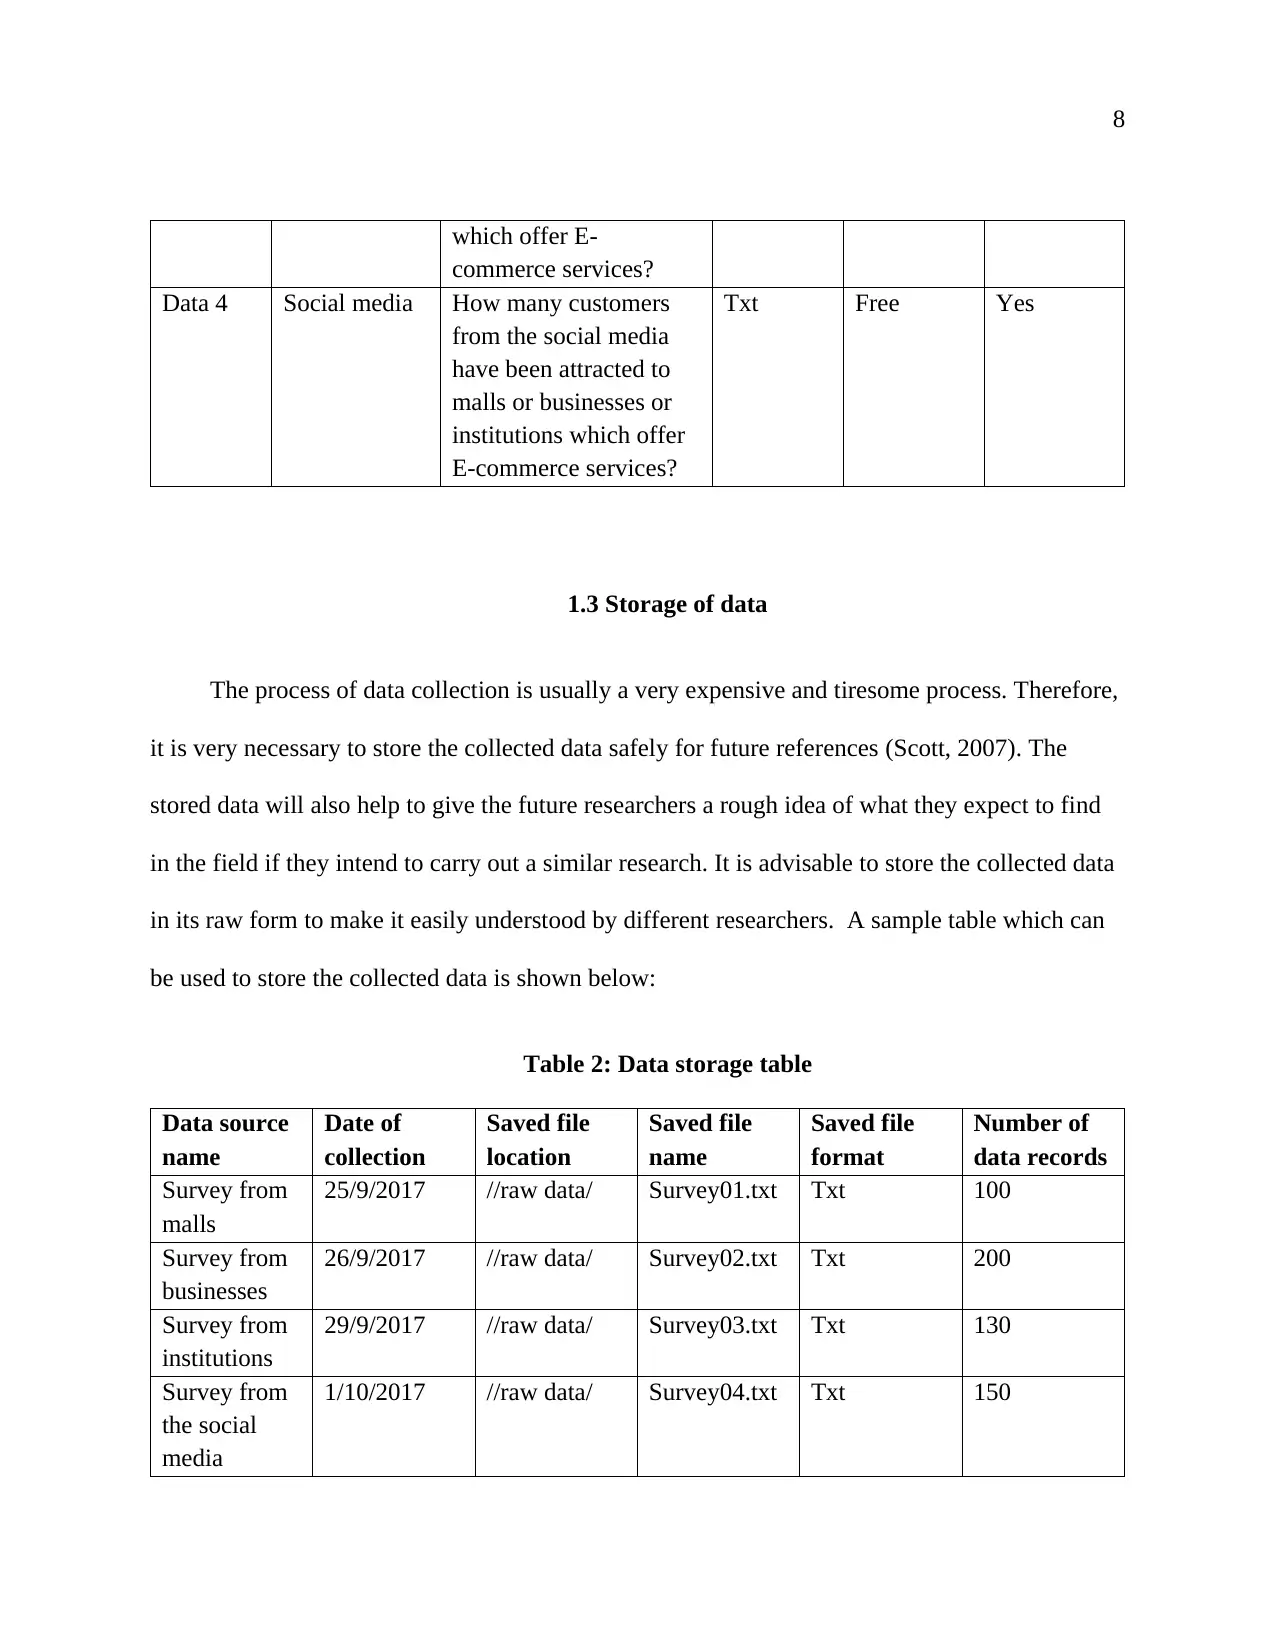
Data 4 Social media How many customers
from the social media
have been attracted to
malls or businesses or
institutions which offer
E-commerce services?
Txt Free Yes
1.3 Storage of data
The process of data collection is usually a very expensive and tiresome process. Therefore,
it is very necessary to store the collected data safely for future references (Scott, 2007). The
stored data will also help to give the future researchers a rough idea of what they expect to find
in the field if they intend to carry out a similar research. It is advisable to store the collected data
in its raw form to make it easily understood by different researchers. A sample table which can
be used to store the collected data is shown below:
Table 2: Data storage table
Data source
name
Date of
collection
Saved file
location
Saved file
name
Saved file
format
Number of
data records
Survey from
malls
25/9/2017 //raw data/ Survey01.txt Txt 100
Survey from
businesses
26/9/2017 //raw data/ Survey02.txt Txt 200
Survey from
institutions
29/9/2017 //raw data/ Survey03.txt Txt 130
Survey from
the social
media
1/10/2017 //raw data/ Survey04.txt Txt 150
which offer E-
commerce services?
Data 4 Social media How many customers
from the social media
have been attracted to
malls or businesses or
institutions which offer
E-commerce services?
Txt Free Yes
1.3 Storage of data
The process of data collection is usually a very expensive and tiresome process. Therefore,
it is very necessary to store the collected data safely for future references (Scott, 2007). The
stored data will also help to give the future researchers a rough idea of what they expect to find
in the field if they intend to carry out a similar research. It is advisable to store the collected data
in its raw form to make it easily understood by different researchers. A sample table which can
be used to store the collected data is shown below:
Table 2: Data storage table
Data source
name
Date of
collection
Saved file
location
Saved file
name
Saved file
format
Number of
data records
Survey from
malls
25/9/2017 //raw data/ Survey01.txt Txt 100
Survey from
businesses
26/9/2017 //raw data/ Survey02.txt Txt 200
Survey from
institutions
29/9/2017 //raw data/ Survey03.txt Txt 130
Survey from
the social
media
1/10/2017 //raw data/ Survey04.txt Txt 150
9
2.0 Experiment design and implementation
Before implementing the actual experiment, the researchers are required to do a complete
design of the experiment. In the design process, the researcher plans how he or she will carry out
the whole experiment and identifies all the requirements of the experiment. He/she also makes
sure all the materials needed for the experiment are available and ready to be used in the
experiment. He/she goes further to specify all the variables which will be used in the experiment.
The design process is meant to prepare the researcher to conduct the experiment smoothly
without many obstacles (Taylor, Stouffer, and Meehl, 2012). In the implementation of the
experiment, the researcher carries out the actual experimental process for him/her to obtain the
results of the research or experiment process. The design and implementation of the research is a
major stage any experiment, and we have many activities associated with this stage. Some of the
major activities done in the design and implementation of experiment or research include data
pre-processing, feature selection or dimension reduction, and analysis of the results either
manually or by use of some special computer software such as SPSS or Ms. Excel. We have
many other activities meant to achieve the best results from the research or experimental process
(Mancini, Mansart, and Pagano, 2012, pp.113-122).
2.1 Data pre-processing
Data pre-processing involves modifying the collected data to obtain the required format
and type of data needed for the experiment to be conducted. We have various techniques which
are used in data pre-processing. The most commonly used pre-processing techniques include
data reduction, data cleaning, data integration and data transformation (Delen and Olson, 2008).
⊘ This is a preview!⊘
Do you want full access?
Subscribe today to unlock all pages.
Trusted by 1+ million students worldwide
10
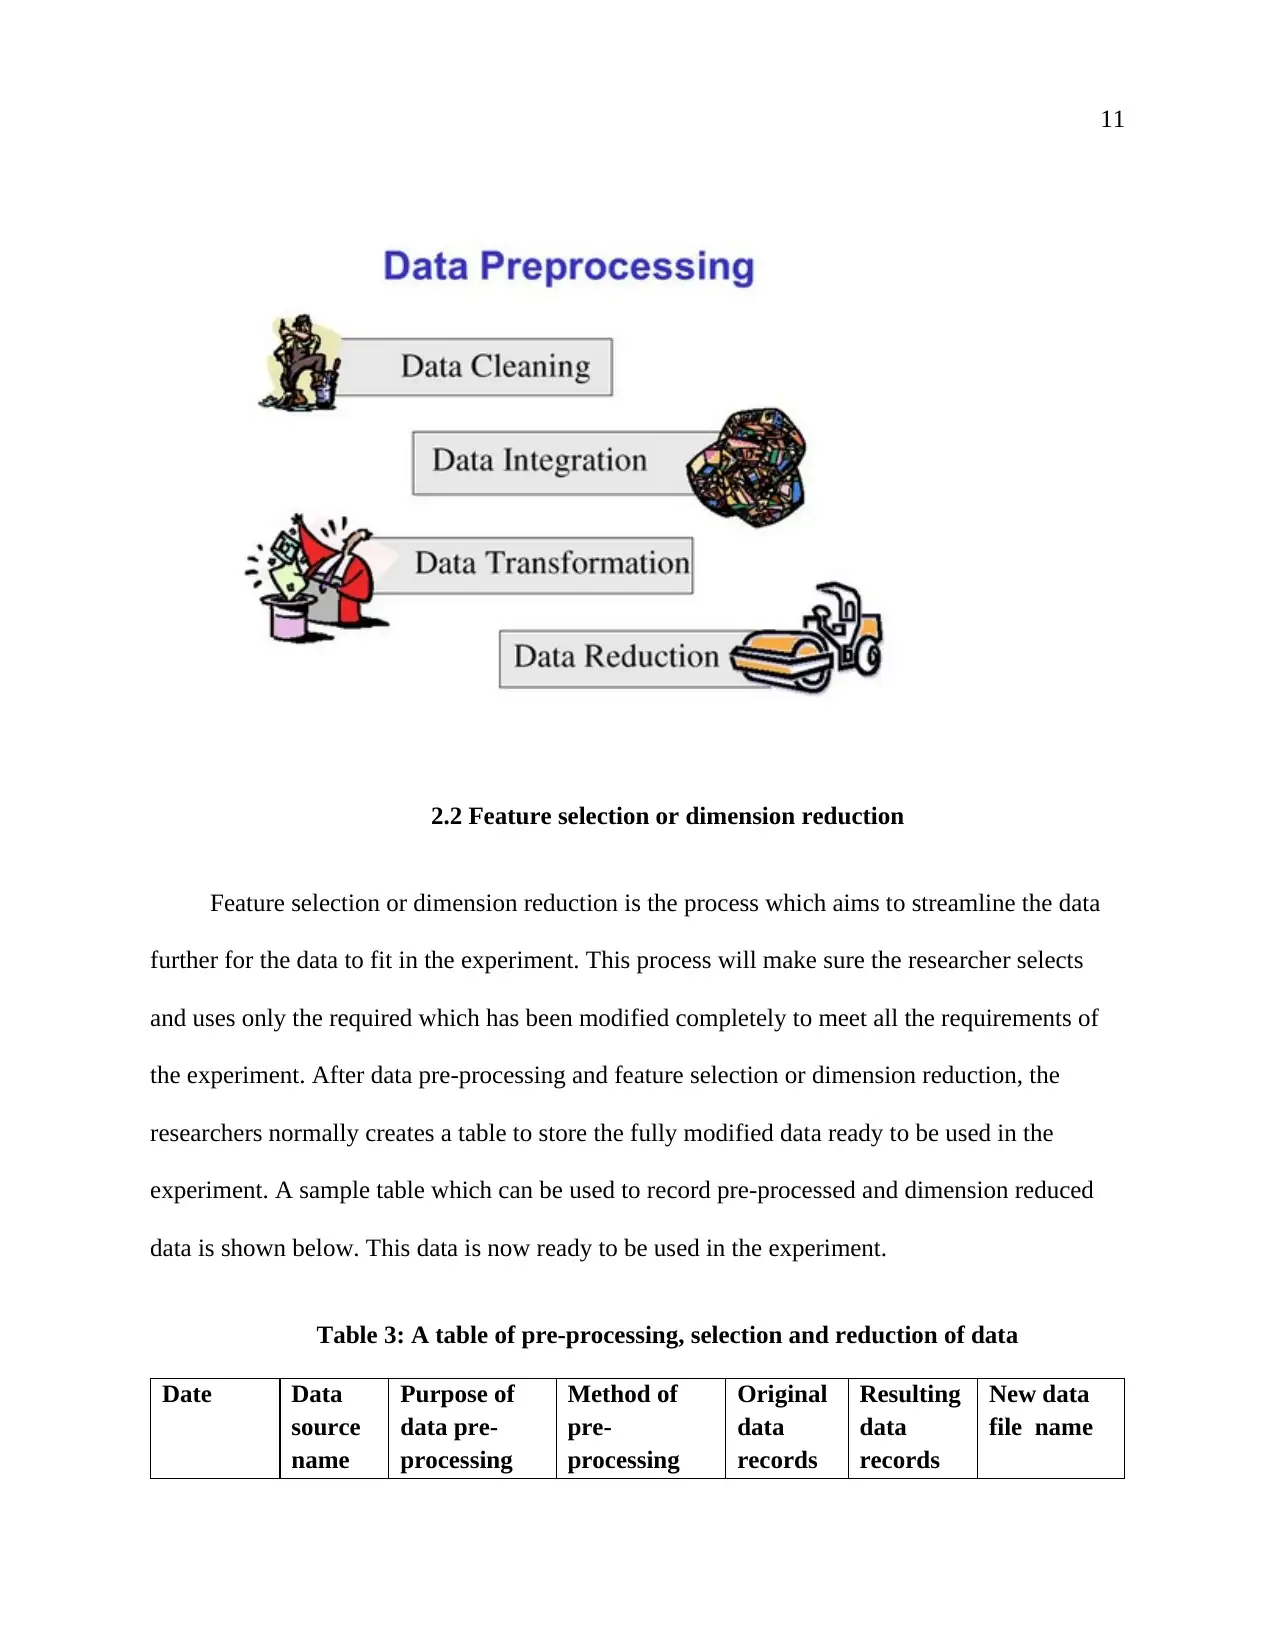
Data reduction is done to remove the unnecessary data which could have been collected. It
also helps in removing redundancy in the collected data. Data cleaning is done to cleanse and
polish the data to make it suitable for use in the experiment. Data cleaning may involve filling of
the missing data, smoothening of the noisy data or resolving of some inconsistency issues in
some sets of data (Dallachiesa, Ebaid, and Eldawy, 2013, pp.541-552).
Data integration is the process of combining different sets of data which have some
differences in their representations. Combining the different sets of data helps to solve the
differences between the data sets easily, and by doing so, the combined data sets can be used
together without any problems. Data transformation involves aggregation, normalization, and
generalization of the data to improve its usability in experiments or researches.
Figure 1: Diagrammatic representation of data pre-processing techniques
Paraphrase This Document
Need a fresh take? Get an instant paraphrase of this document with our AI Paraphraser
11
2.2 Feature selection or dimension reduction
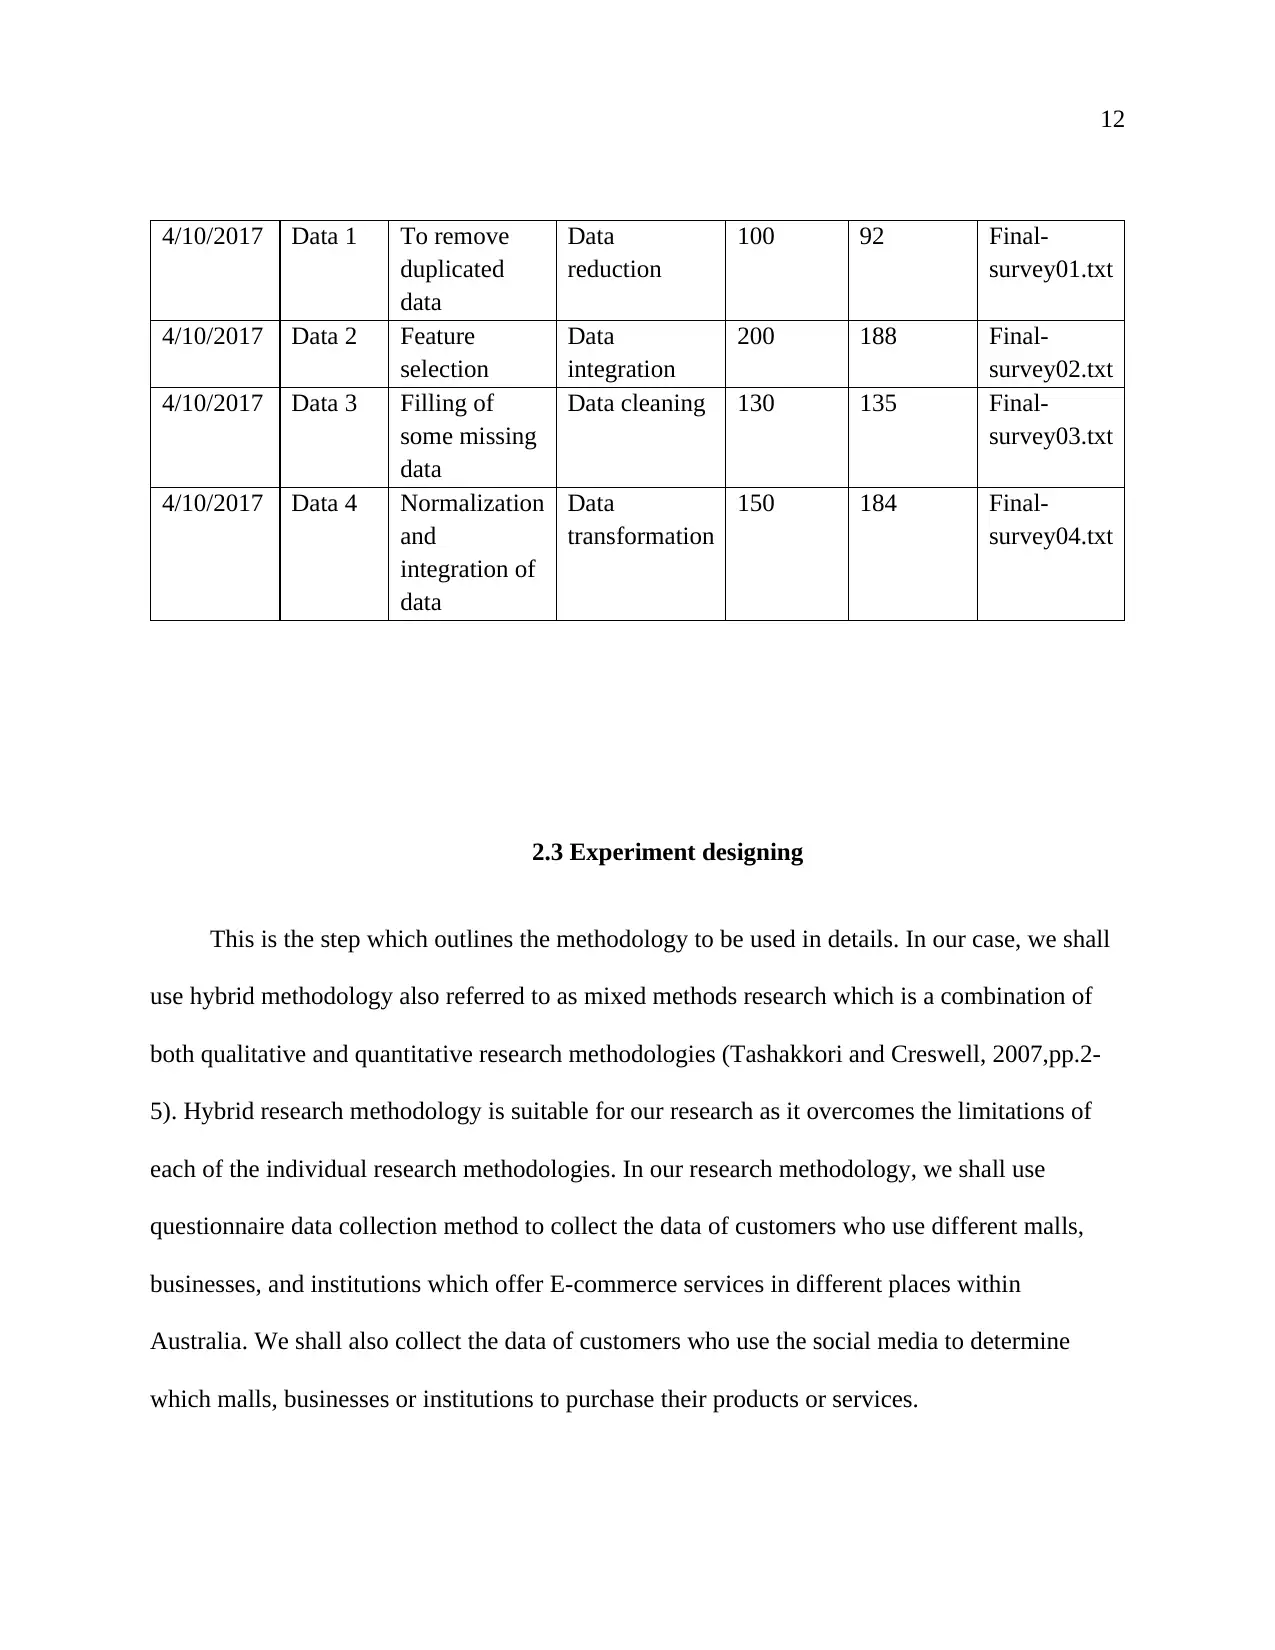
Feature selection or dimension reduction is the process which aims to streamline the data
further for the data to fit in the experiment. This process will make sure the researcher selects
and uses only the required which has been modified completely to meet all the requirements of
the experiment. After data pre-processing and feature selection or dimension reduction, the
researchers normally creates a table to store the fully modified data ready to be used in the
experiment. A sample table which can be used to record pre-processed and dimension reduced
data is shown below. This data is now ready to be used in the experiment.
Table 3: A table of pre-processing, selection and reduction of data
Date Data
source
name
Purpose of
data pre-
processing
Method of
pre-
processing
Original
data
records
Resulting
data
records
New data
file name
2.2 Feature selection or dimension reduction
Feature selection or dimension reduction is the process which aims to streamline the data
further for the data to fit in the experiment. This process will make sure the researcher selects
and uses only the required which has been modified completely to meet all the requirements of
the experiment. After data pre-processing and feature selection or dimension reduction, the
researchers normally creates a table to store the fully modified data ready to be used in the
experiment. A sample table which can be used to record pre-processed and dimension reduced
data is shown below. This data is now ready to be used in the experiment.
Table 3: A table of pre-processing, selection and reduction of data
Date Data
source
name
Purpose of
data pre-
processing
Method of
pre-
processing
Original
data
records
Resulting
data
records
New data
file name
12
4/10/2017 Data 1 To remove
duplicated
data
Data
reduction
100 92 Final-
survey01.txt
4/10/2017 Data 2 Feature
selection
Data
integration
200 188 Final-
survey02.txt
4/10/2017 Data 3 Filling of
some missing
data
Data cleaning 130 135 Final-
survey03.txt
4/10/2017 Data 4 Normalization
and
integration of
data
Data
transformation
150 184 Final-
survey04.txt
2.3 Experiment designing
This is the step which outlines the methodology to be used in details. In our case, we shall
use hybrid methodology also referred to as mixed methods research which is a combination of
both qualitative and quantitative research methodologies (Tashakkori and Creswell, 2007,pp.2-
5). Hybrid research methodology is suitable for our research as it overcomes the limitations of
each of the individual research methodologies. In our research methodology, we shall use
questionnaire data collection method to collect the data of customers who use different malls,
businesses, and institutions which offer E-commerce services in different places within
Australia. We shall also collect the data of customers who use the social media to determine
which malls, businesses or institutions to purchase their products or services.
⊘ This is a preview!⊘
Do you want full access?
Subscribe today to unlock all pages.
Trusted by 1+ million students worldwide
1 out of 29
Related Documents


Your All-in-One AI-Powered Toolkit for Academic Success.
+13062052269
info@desklib.com
Available 24*7 on WhatsApp / Email
![[object Object]](/_next/static/media/star-bottom.7253800d.svg)
Unlock your academic potential
Copyright © 2020–2026 A2Z Services. All Rights Reserved. Developed and managed by ZUCOL.