Factors Impacting Mental Health Treatment: SPSS Analysis Report
VerifiedAdded on 2020/07/22
|18
|4076
|66
Report
AI Summary
This report presents an analysis of factors influencing mental health treatment using SPSS. The study employs logistic regression to identify predictors of whether individuals with mental health issues receive treatment. The analysis considers demographic, lifestyle, and medical variables. Key findings include the identification of significant predictors like sex, marital status, regions, and lifestyle factors. The report also examines the characteristics of groups with the highest odds of needing treatment but not receiving it, comparing demographic features of included and excluded individuals. The study highlights the model's accuracy and discusses the impact of various factors on treatment access, offering valuable insights for healthcare research and policy.

SPSS
Paraphrase This Document
Need a fresh take? Get an instant paraphrase of this document with our AI Paraphraser
TABLE OF CONTENTS
INTRODUCTION...........................................................................................................................1
Methods used in research study, any variable created and decisions made to include exlcude
the variables from analysis..........................................................................................................1
Descriptive statistics logistic regression......................................................................................2
Way in which odds for needing mental health treatment in 12 months but not receiving it are
influenced by variables in model.................................................................................................4
Identification of characteristics of group of people who have highest odd of needing mental
health treatment but not receiving it............................................................................................4
Demographic feature of people included and exluded from model............................................5
Cohort of people having high probability of exlusion.................................................................5
Comparison of proportion of cohort of people exluded from model and same of white hispanic
male..............................................................................................................................................5
CONCLUSION................................................................................................................................5
REFERENCES................................................................................................................................7
APPENDIX......................................................................................................................................8
INTRODUCTION
Healthcare is the one of important sector to which most of nations of the world give due
importance. Analytics is the one of field that have wide scope across all industries of the world
and same is used in healthcare sector to make varied sort of decisions. In current report main aim
is to identify predictors that have significent impact or play an important role in cretion of
thought that someone is suffered from mental problem but do not receive any sort of treatment.
In present research study logistic regression will be applied on data set and prediction will be
made whether an individual will suffered be in condition where it is suffered from mental disease
and not receive treatment or vice verse. Apart from this, in second part of the report proportion
of missing values is identified and on that basis useful facts are identified. At end of the report,
conclusion section is prepared on the basis of analysis of facts and figures.
Methods used in research study, any variable created and decisions made to include exlcude the
variables from analysis
In the present research study logistic regression model is used to make prediction. It is
one of the important tool that is used to make prediction. In case of logistic regression there is
single dependent variable that is of categorical in nature and multiple independent variables
which may be continuous or categorical in nature (Dhingra and et.al., 2010). There is difference
between both sort of variables which is that in case of categorical variable there are different
classifications of variable and in case of continuous variable there are no categories and different
values in respect to variables are observed in data set. Logistic regression is used to make
prediction whether person thought they need mental health treatment receive or did not receive
it. In this regard some of predictors are taken in to account. These predictors can be classified in
to demographic factor, lifestyle factor, medical variables and attitudinal variables. By using
logistic regression it is identified whether inclusion of to demographic factor, lifestyle factor,
medical variables and attitudinal variables have any impact on dependent categorical variable (4
Lifestyle changes that will boost your mental health, 2015).
No new variable is created and old one are used and under this age, gender, marital status
and education. In case of lifestyle variables two variables are taken in to account for analysis
purpose like SNMOV5Y2 and SUMYR. SNMOV5Y2 reflect number of times individual moved
in past 5 years and SUMYR reflect illicit drug used in past years. Apart from this, as predictors
1 | P a g e
⊘ This is a preview!⊘
Do you want full access?
Subscribe today to unlock all pages.
Trusted by 1+ million students worldwide
in case of medical variables asthma and depression variables which are LIFASMA and LIFDAB
are taken in to account.
In same way no variable is exluded from the model because missing values are there in
few variables. Moreover, proportion of these missing values are very low in variable data. Due to
this reason none of variable is removed from the model. Usually, in practice of analytics specific
variable is excluded or not considered in model when percentage of missing values are high in
data set. Same thing is not observed in data set and due to this reason no variable is removed
from model.
On the basis of coding that is done in SPSS Syntax editor prediction is made whether an
individual will suffered be in condition where it is suffered from mental disease and not receive
treatment or vice verse. In this regard some parameters or funtions are used and lots of things are
specified within them. Functions that are used in SPSS Syntax editor are logistic regression
variables, categorical, method, save and criteria function.
In second part of the report as part of method in order to identify demographic
characteristic of exluded number of missing values were identified by generating output for each
variable. Then data of variables paste in excel and from same missing values rows were
identified and finally descriptive of same is computed. In order to make percentage comparison
cross tab function used and for relevant variable percentage is computed.
Descriptive statistics logistic regression
2 | P a g e
Paraphrase This Document
Need a fresh take? Get an instant paraphrase of this document with our AI Paraphraser
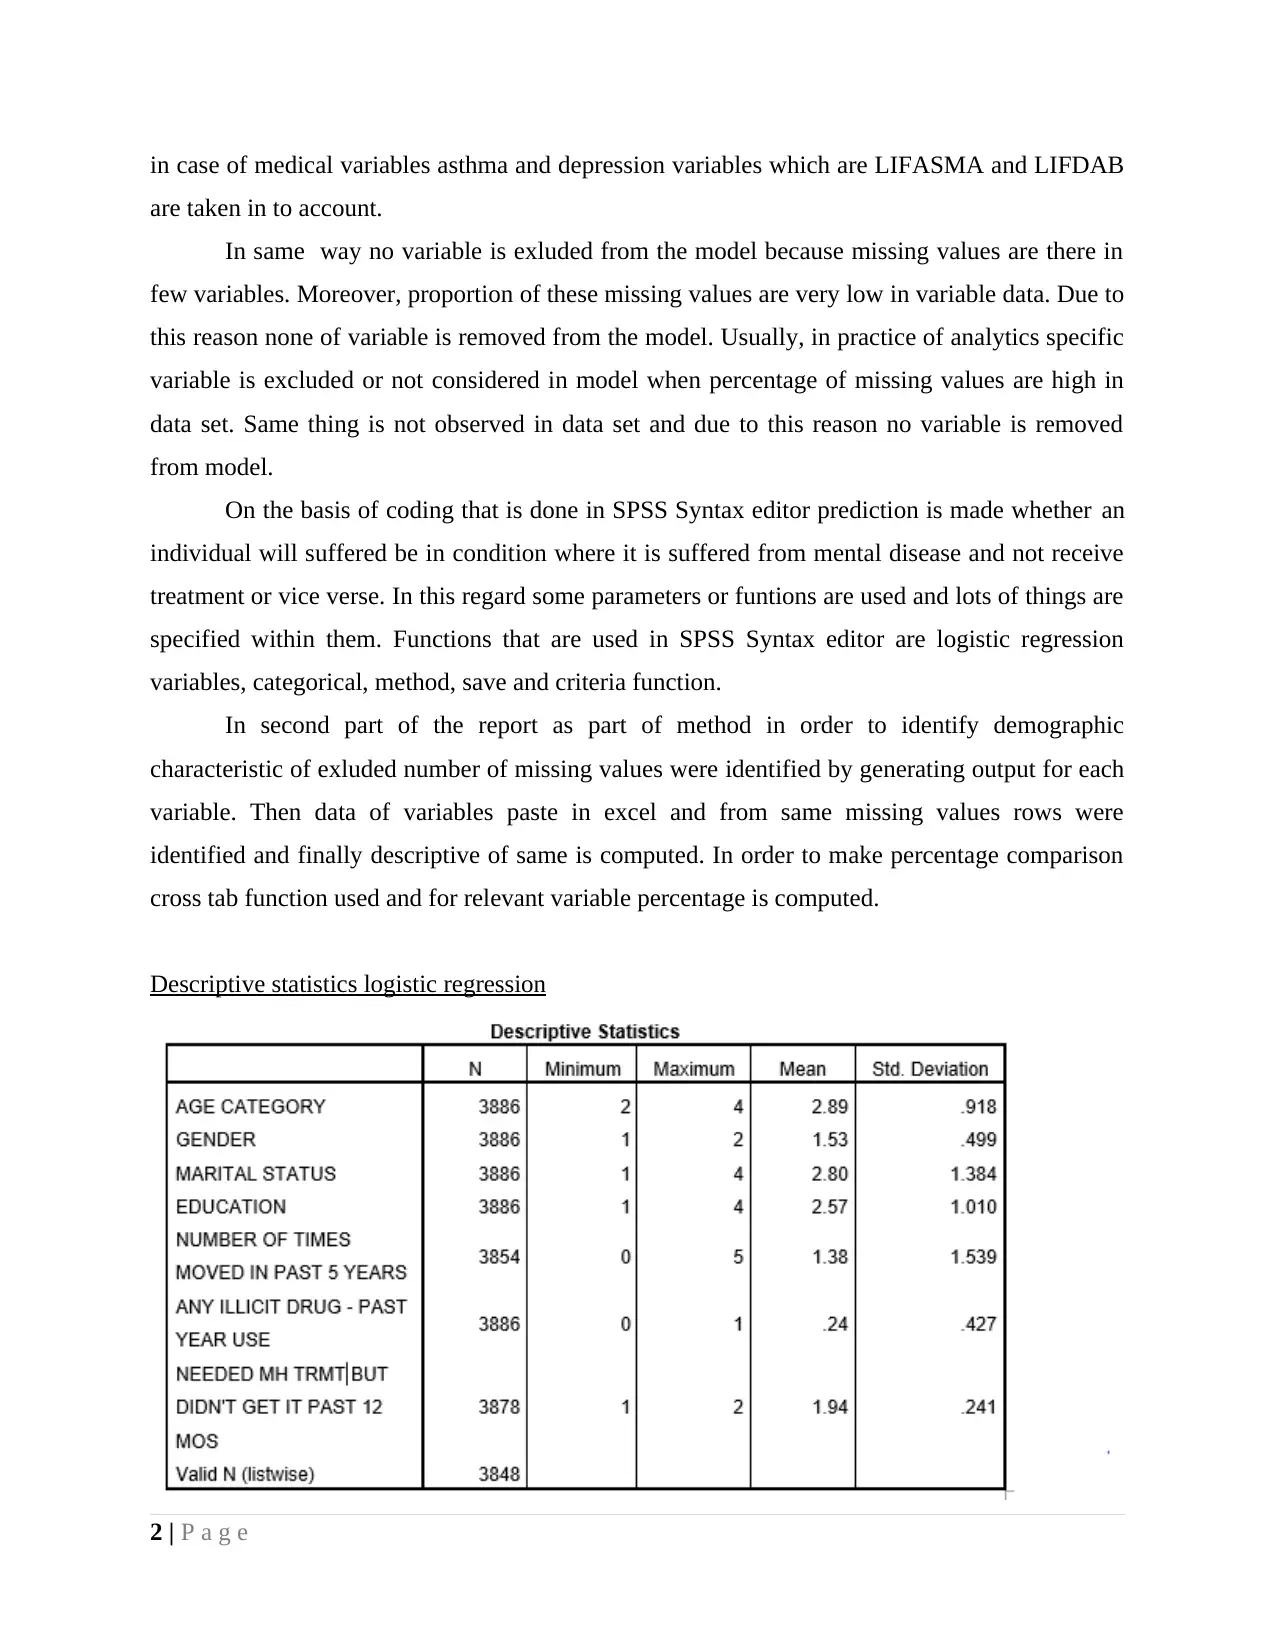
Interpretation
In case of age category mean value is 2.89 which means majority of respondents are in
age category of 26-34 age old. Mean value of gender is 1.53 and it is indicating that respondents
are female in largest number. In same way in case of marital status mean value is 2.80 which
point out that average individuals are divorced or separated from their partners. Mean value for
education is 2.57 and this means that mostly respondents are college students. In respect to
lifestyle 2 variables were taken in to account which are number of times people moved in past 5
years. Average of 1.38 is indicating that mostly people visit place two times in a year. Mean
value of illicit drug consumption is 0.24 and this is indicating that majority of respondents does
not use drug in past years. Most of respondents select no option in case of dependent variable
and this means that large number of respondents are think that statement that they are suffered
from mental disease and does not receive treatment is completely wrong.
Sample size and model accuracy
In present research study sample of 3886 people is taken that are different from each
other in terms of demographic features. There are number of variables that are included in
demographic factors like gender, age, income level and education etc. Model of logistic
regression that is prepared is best fitted model as it can be observed that model accuracy level is
93% which means that across categories of dependent variable accurate classification is made
and there are very less number of false positive and false negative misclassification in logistic
regression table.
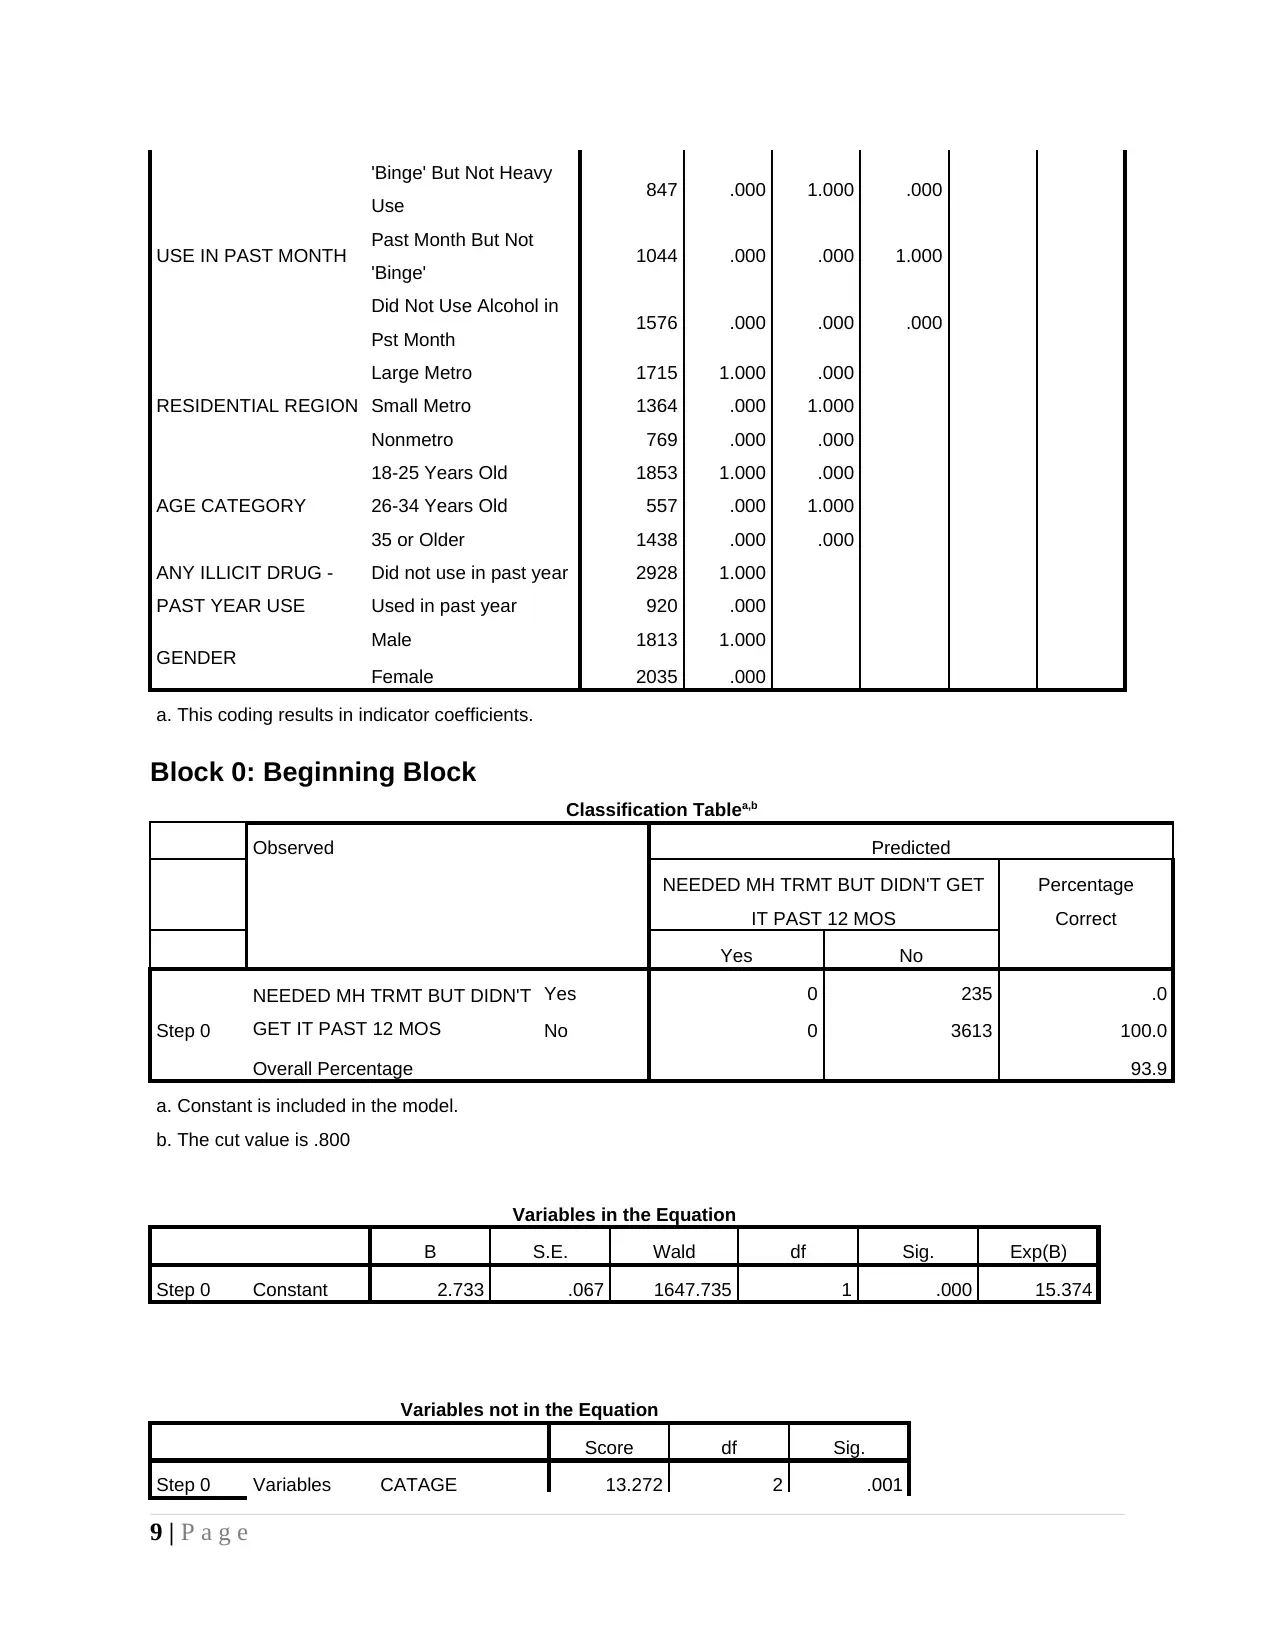
Part A
As part of summary statistics in logistic regression it can be observed that 93.9% is
accuracy rate of model which means it is making accurate prediction of classes of dependent
variable. There are only 235 respondents whose predictions are wrong out of 3886. Value of Cox
& Snell R square is 3% and same of Naglekereke is 8%. This means that dependent variable
deviation may be 3% or 8% as explained by model.
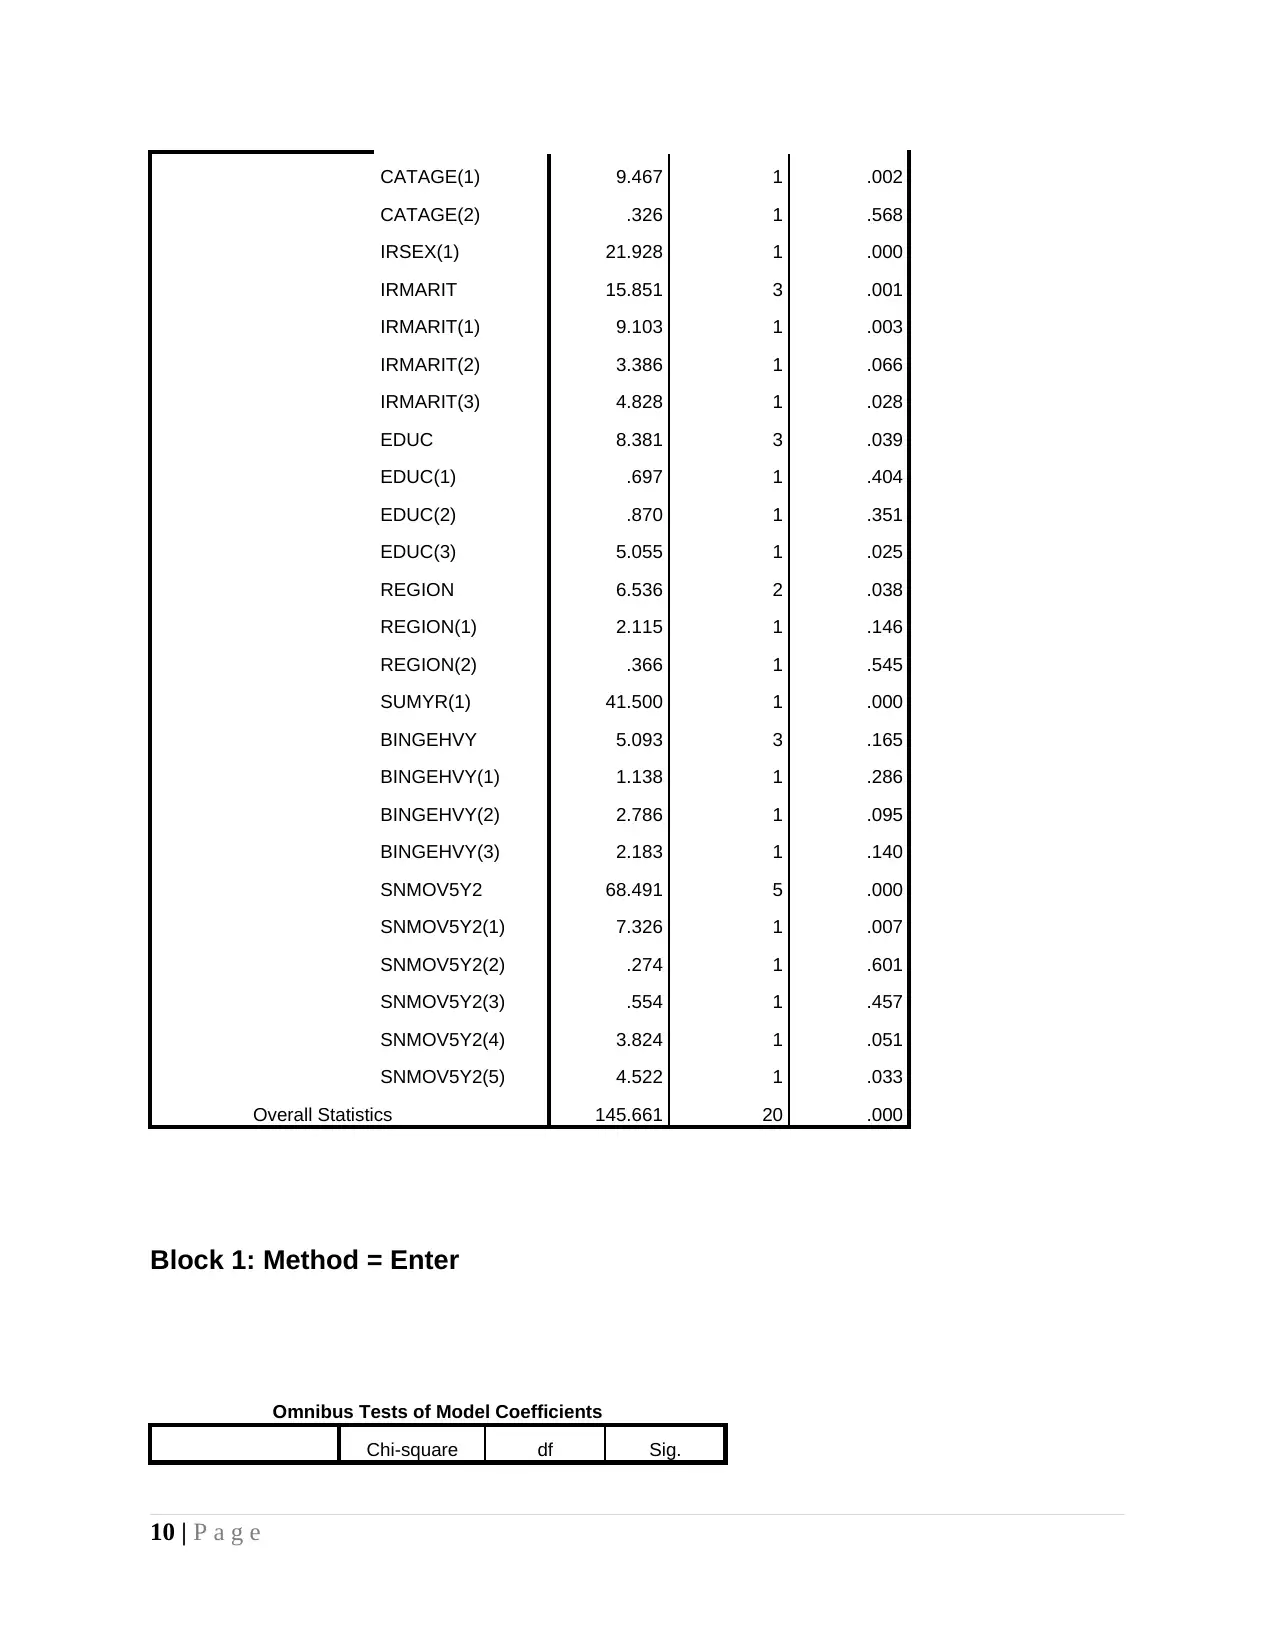
In table variable in equation of logistic regression level of significance is 0.00 for sex,
0.05 for marital status, 0.022 for regions, 0.00 for SUMYR, and 0.00 for all components of
SNMOV5Y2. These facts reflect that sex, marital status, regions and two lifestyle factors are
significant predictor of model. Education and remaining other variables cannot be considered
3 | P a g e
In case of age category mean value is 2.89 which means majority of respondents are in
age category of 26-34 age old. Mean value of gender is 1.53 and it is indicating that respondents
are female in largest number. In same way in case of marital status mean value is 2.80 which
point out that average individuals are divorced or separated from their partners. Mean value for
education is 2.57 and this means that mostly respondents are college students. In respect to
lifestyle 2 variables were taken in to account which are number of times people moved in past 5
years. Average of 1.38 is indicating that mostly people visit place two times in a year. Mean
value of illicit drug consumption is 0.24 and this is indicating that majority of respondents does
not use drug in past years. Most of respondents select no option in case of dependent variable
and this means that large number of respondents are think that statement that they are suffered
from mental disease and does not receive treatment is completely wrong.
Sample size and model accuracy
In present research study sample of 3886 people is taken that are different from each
other in terms of demographic features. There are number of variables that are included in
demographic factors like gender, age, income level and education etc. Model of logistic
regression that is prepared is best fitted model as it can be observed that model accuracy level is
93% which means that across categories of dependent variable accurate classification is made
and there are very less number of false positive and false negative misclassification in logistic
regression table.
Part A
As part of summary statistics in logistic regression it can be observed that 93.9% is
accuracy rate of model which means it is making accurate prediction of classes of dependent
variable. There are only 235 respondents whose predictions are wrong out of 3886. Value of Cox
& Snell R square is 3% and same of Naglekereke is 8%. This means that dependent variable
deviation may be 3% or 8% as explained by model.
In table variable in equation of logistic regression level of significance is 0.00 for sex,
0.05 for marital status, 0.022 for regions, 0.00 for SUMYR, and 0.00 for all components of
SNMOV5Y2. These facts reflect that sex, marital status, regions and two lifestyle factors are
significant predictor of model. Education and remaining other variables cannot be considered
3 | P a g e
significant predictor of dependent variable which is someone is suffered from mental problem
but do not receive any sort of treatment.
Part B
On analysis of part B results it can be said that on some variables demographic features
of those included and excluded from model are different. These variables are education, race and
lifestyle variable which is number of times moving in year.
Way in which odds for needing mental health treatment in 12 months but not receiving it are
influenced by variables in model
On analysis of facts it can be observed that about 99% are in class where they are
suffered from any mental disease and are receiving treatment. Hence, it can be said that in the
nation if any person is suffered from mental illness same is referred to Doctor or hospital
immediately. There are few variables that have impact on the variable that individual is suffered
from mental illness and not received treatment. Relevant variables are sex, marital status, regions
and two lifestyle factors (Spoont and et.al., 2010). These factors have huge impact on the
dependent variable because marital status have significant impact on the situation where one is
suffered from mental disease and not received treatment. This is because if any individual is
married then in that case same is more aware about self and other health. In such kind of cases if
one is suffered from mental disease then in that case treatment is provided to same immediately.
Thus, in this way odds for needing mental health treatment in 12 months and receiving it are
influenced by variables in model. In contrary to this, it can be said that if an individual is
unmarried then probability of needing mental health but not receive treatment is high. Region
wise also different trends are observed as it can be seen that across different region on same topic
people have different perceptions (Roberts and et.al., 2011). Same concept applied in this case
also it is possible that region wise people may have different thinking in respect to fact that if
someone is suffered from mental health issue then treatment must not be give or vice versa. This
is because most of times when symptom of mental illness comes in existence people ignore.
Moreover, in metropolitan cities there are large number of people that are suffered from disease.
In such kind of areas when someone come to know about disease treatment is given to it
immediately. Thus, region factor highly affect outcome of dependent variable.
4 | P a g e
⊘ This is a preview!⊘
Do you want full access?
Subscribe today to unlock all pages.
Trusted by 1+ million students worldwide
Identification of characteristics of group of people who have highest odd of needing mental
health treatment but not receiving it
In respect to relevant group of respondents it can be observed that mean value for age
group is 2.4 and same for sex is 1.83. This means that majority of respondents in this category
are 18-25 years old and mostly are female respondents in mentioned category. Marital status
mean value is 3.38 and same of education is 2.4 which means that most of respondents are
divorced or separated and are high school gradates. In case of lifestyle variable SNOMY5Y2
mean value is 4.5 and 0.86 in case of other lifestyle variable. This means that four times people
moved in past 5 years and most of respondents does not make use of illicit drugs in past couple
of years. This is demographic and lifestyle charactertic of people have highest odd of needing
mental health but treatment not given to them.
Demographic feature of people included and exluded from model
In case of two groups of respondents that are included and excluded from the model any
big difference is not observed. This is because excluded respondents percentage is very small.
However, in case of education, race and lifestyle factor SNMOV5Y2 difference in demographic
factors is observed between included and excluded people. Education mean value is 1.9 for
excluded group but same is 2.5 for included group. In case of race mean value for excluded
group is 3.2 and same for included group is 2.42.
Cohort of people having high probability of exlusion
These are not significant predictors and due to this reason difference in results have no
impact of actual results. Entire cohort of people that have missing values have highest
probability of exclusion from model because logistic regression does not consider missing values
in calculation.
Comparison of proportion of cohort of people exluded from model and same of white hispanic
male
Predicted proportion of non-Hispanic white males aged 35 years and have college
graduation is 52.6% as can be seen from cross tab sheet that is in output. It can be said that such
kind of people have high proportion in sample size. If we compare proportion of such kind of
people with those that are excluded from the model then in that case it is identified that portion
5 | P a g e
Paraphrase This Document
Need a fresh take? Get an instant paraphrase of this document with our AI Paraphraser
of non-Hispanic white males having college education is high then those that were excluded
from model.
CONCLUSION
On the basis of above discussion it is identified that often those who are suffered from
mental illness get treatment. This means that behing suicidal thoughts that comes in people brain
there is no role of mentioned dependent variable. Thus, while designing campaign for relevant
group of people factor people are mentally ill and not receiving treatment must not be considered
by advertisers. It is also concluded that demographic profile of people that are included and
exluded from model to some extent is different. Means that people are different from each other
in terms of characteristics in sample.
6 | P a g e
REFERENCES
Books and journal
Dhingra, S.S. and et.al., 2010. Determining prevalence and correlates of psychiatric treatment
with Andersen's behavioral model of health services use. Psychiatric Services. 61(5).
pp.524-528.
Roberts, A.L. and et.al., 2011. Race/ethnic differences in exposure to traumatic events,
development of post-traumatic stress disorder, and treatment-seeking for post-traumatic
stress disorder in the United States. Psychological medicine. 41(1). pp.71-83.
Spoont, M.R. and et.al., 2010. Treatment receipt by veterans after a PTSD diagnosis in PTSD,
mental health, or general medical clinics. Psychiatric Services. 61(1). pp.58-63.
Online
4 Lifestyle changes that will boost your mental health, 2015. [Online]. Available through:<
https://www.psychologytoday.com/blog/where-science-meets-the-steps/201504/4-lifestyle-
changes-will-boost-your-mental-health>. [Accessed on 9th September 2017].
7 | P a g e
⊘ This is a preview!⊘
Do you want full access?
Subscribe today to unlock all pages.
Trusted by 1+ million students worldwide
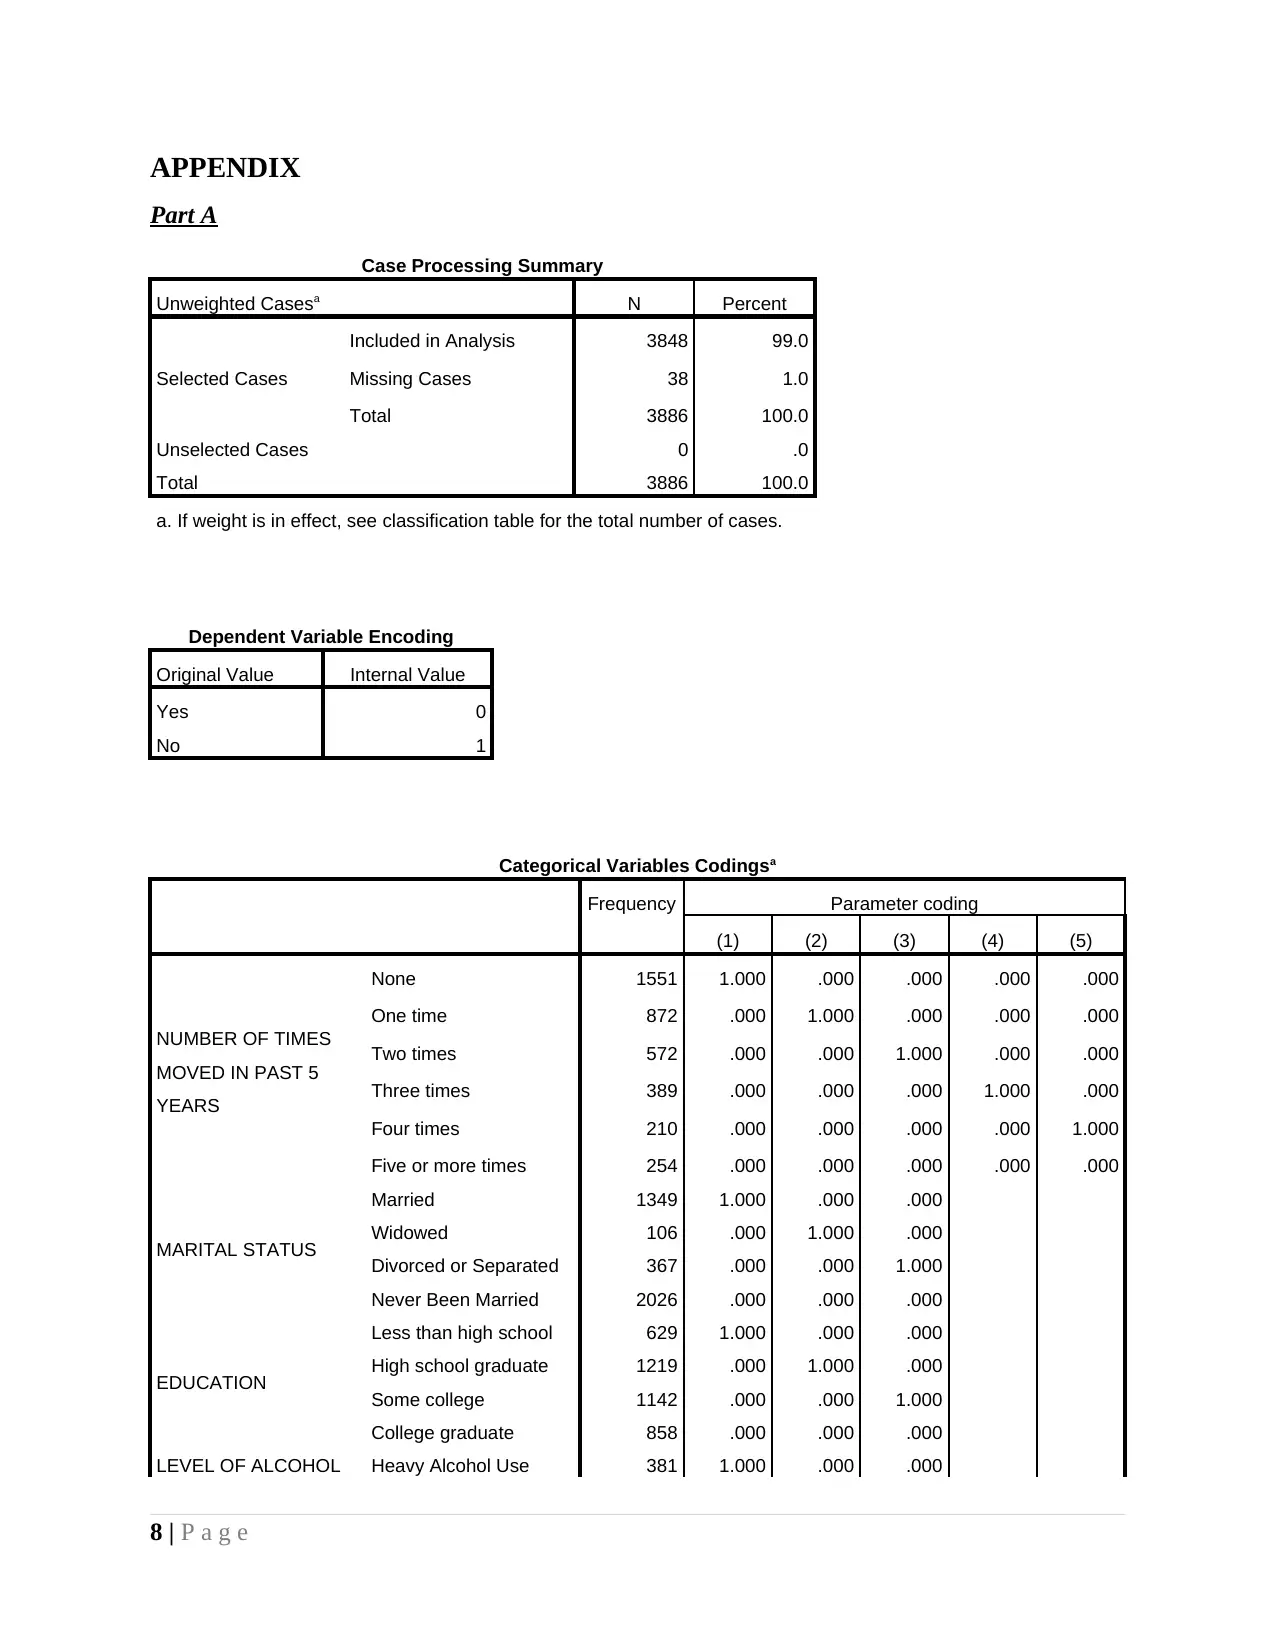
APPENDIX
Part A
Case Processing Summary
Unweighted Casesa N Percent
Selected Cases
Included in Analysis 3848 99.0
Missing Cases 38 1.0
Total 3886 100.0
Unselected Cases 0 .0
Total 3886 100.0
a. If weight is in effect, see classification table for the total number of cases.
Dependent Variable Encoding
Original Value Internal Value
Yes 0
No 1
Categorical Variables Codingsa
Frequency Parameter coding
(1) (2) (3) (4) (5)
NUMBER OF TIMES
MOVED IN PAST 5
YEARS
None 1551 1.000 .000 .000 .000 .000
One time 872 .000 1.000 .000 .000 .000
Two times 572 .000 .000 1.000 .000 .000
Three times 389 .000 .000 .000 1.000 .000
Four times 210 .000 .000 .000 .000 1.000
Five or more times 254 .000 .000 .000 .000 .000
MARITAL STATUS
Married 1349 1.000 .000 .000
Widowed 106 .000 1.000 .000
Divorced or Separated 367 .000 .000 1.000
Never Been Married 2026 .000 .000 .000
EDUCATION
Less than high school 629 1.000 .000 .000
High school graduate 1219 .000 1.000 .000
Some college 1142 .000 .000 1.000
College graduate 858 .000 .000 .000
LEVEL OF ALCOHOL Heavy Alcohol Use 381 1.000 .000 .000
8 | P a g e
Paraphrase This Document
Need a fresh take? Get an instant paraphrase of this document with our AI Paraphraser
USE IN PAST MONTH
'Binge' But Not Heavy
Use 847 .000 1.000 .000
Past Month But Not
'Binge' 1044 .000 .000 1.000
Did Not Use Alcohol in
Pst Month 1576 .000 .000 .000
RESIDENTIAL REGION
Large Metro 1715 1.000 .000
Small Metro 1364 .000 1.000
Nonmetro 769 .000 .000
AGE CATEGORY
18-25 Years Old 1853 1.000 .000
26-34 Years Old 557 .000 1.000
35 or Older 1438 .000 .000
ANY ILLICIT DRUG -
PAST YEAR USE
Did not use in past year 2928 1.000
Used in past year 920 .000
GENDER Male 1813 1.000
Female 2035 .000
a. This coding results in indicator coefficients.
Block 0: Beginning Block
Classification Tablea,b
Observed Predicted
NEEDED MH TRMT BUT DIDN'T GET
IT PAST 12 MOS
Percentage
Correct
Yes No
Step 0
NEEDED MH TRMT BUT DIDN'T
GET IT PAST 12 MOS
Yes 0 235 .0
No 0 3613 100.0
Overall Percentage 93.9
a. Constant is included in the model.
b. The cut value is .800
Variables in the Equation
B S.E. Wald df Sig. Exp(B)
Step 0 Constant 2.733 .067 1647.735 1 .000 15.374
Variables not in the Equation
Score df Sig.
Step 0 Variables CATAGE 13.272 2 .001
9 | P a g e
CATAGE(1) 9.467 1 .002
CATAGE(2) .326 1 .568
IRSEX(1) 21.928 1 .000
IRMARIT 15.851 3 .001
IRMARIT(1) 9.103 1 .003
IRMARIT(2) 3.386 1 .066
IRMARIT(3) 4.828 1 .028
EDUC 8.381 3 .039
EDUC(1) .697 1 .404
EDUC(2) .870 1 .351
EDUC(3) 5.055 1 .025
REGION 6.536 2 .038
REGION(1) 2.115 1 .146
REGION(2) .366 1 .545
SUMYR(1) 41.500 1 .000
BINGEHVY 5.093 3 .165
BINGEHVY(1) 1.138 1 .286
BINGEHVY(2) 2.786 1 .095
BINGEHVY(3) 2.183 1 .140
SNMOV5Y2 68.491 5 .000
SNMOV5Y2(1) 7.326 1 .007
SNMOV5Y2(2) .274 1 .601
SNMOV5Y2(3) .554 1 .457
SNMOV5Y2(4) 3.824 1 .051
SNMOV5Y2(5) 4.522 1 .033
Overall Statistics 145.661 20 .000
Block 1: Method = Enter
Omnibus Tests of Model Coefficients
Chi-square df Sig.
10 | P a g e
⊘ This is a preview!⊘
Do you want full access?
Subscribe today to unlock all pages.
Trusted by 1+ million students worldwide
1 out of 18
Related Documents


Your All-in-One AI-Powered Toolkit for Academic Success.
+13062052269
info@desklib.com
Available 24*7 on WhatsApp / Email
![[object Object]](/_next/static/media/star-bottom.7253800d.svg)
Unlock your academic potential
Copyright © 2020–2026 A2Z Services. All Rights Reserved. Developed and managed by ZUCOL.