Managing Financial Performance: A Report on ARM Holdings Plc
VerifiedAdded on 2020/01/07
|21
|3561
|160
Report
AI Summary
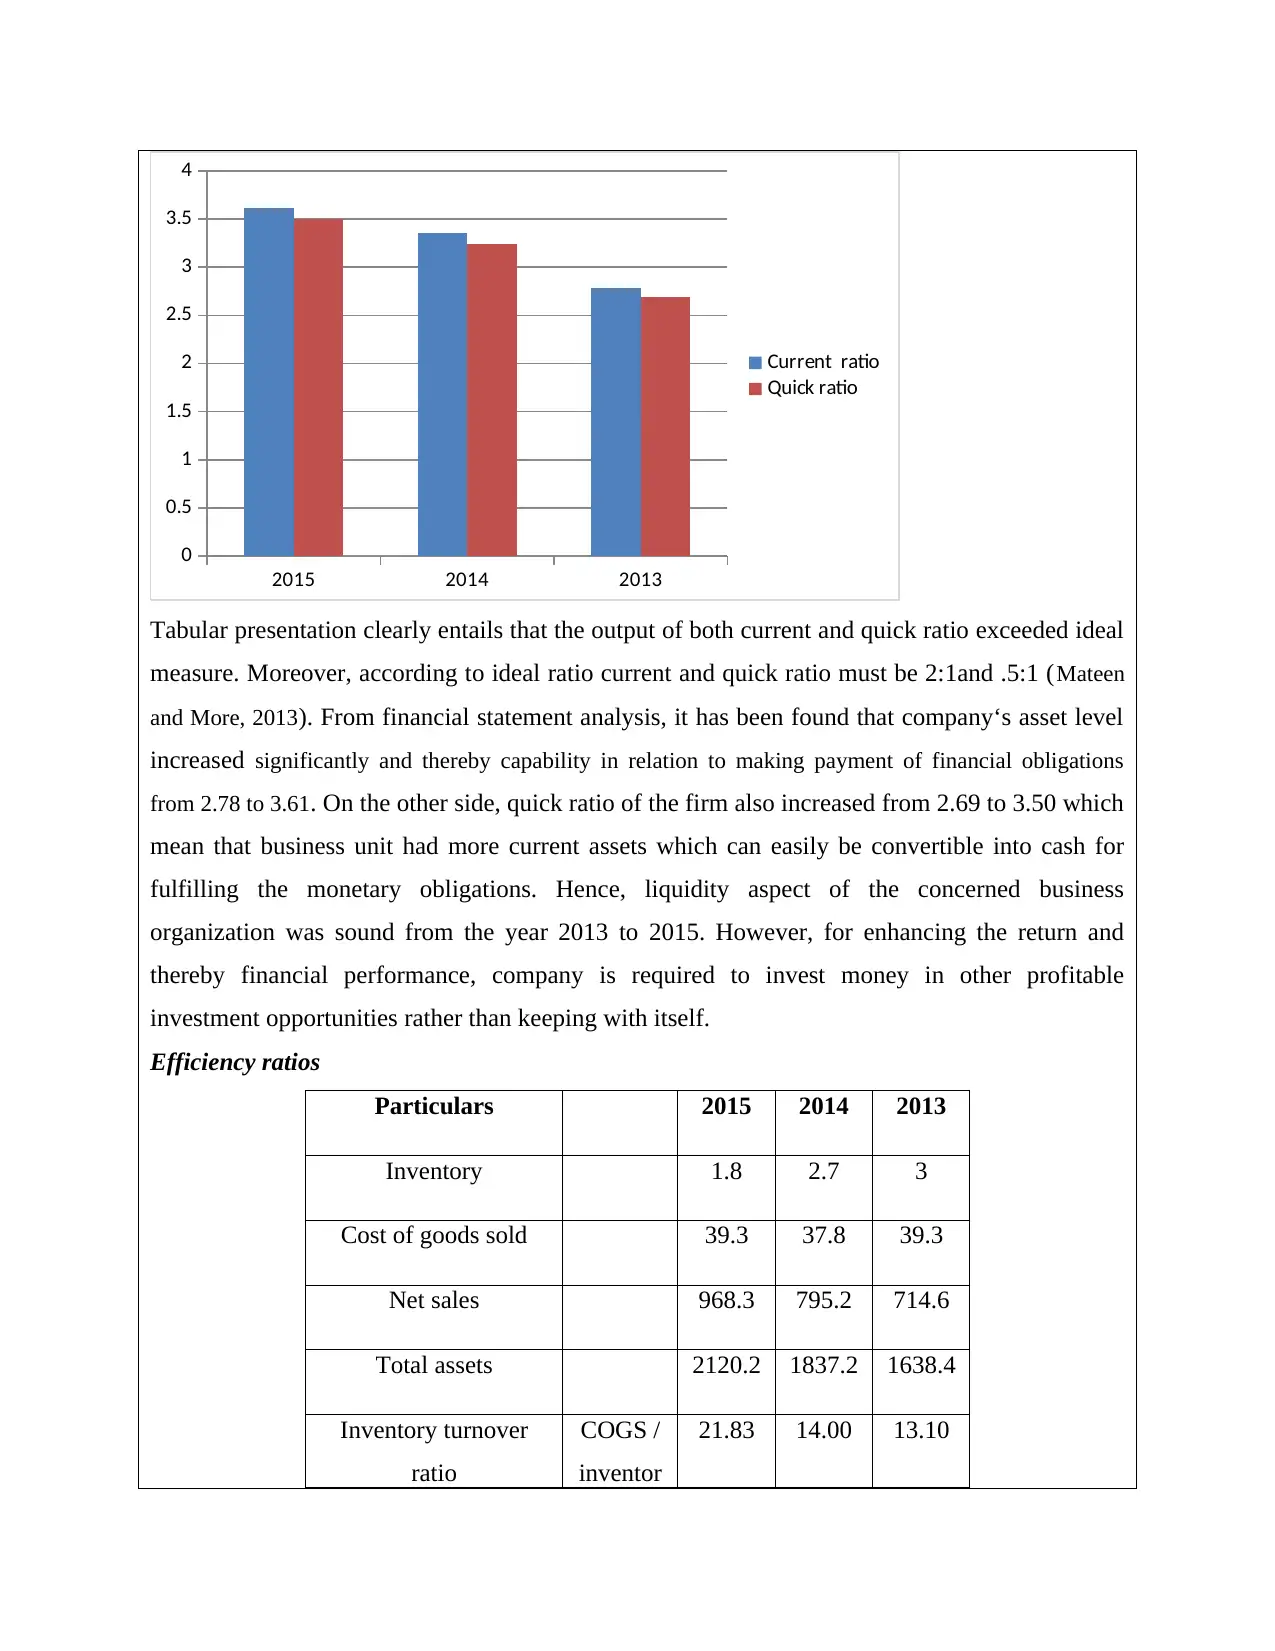
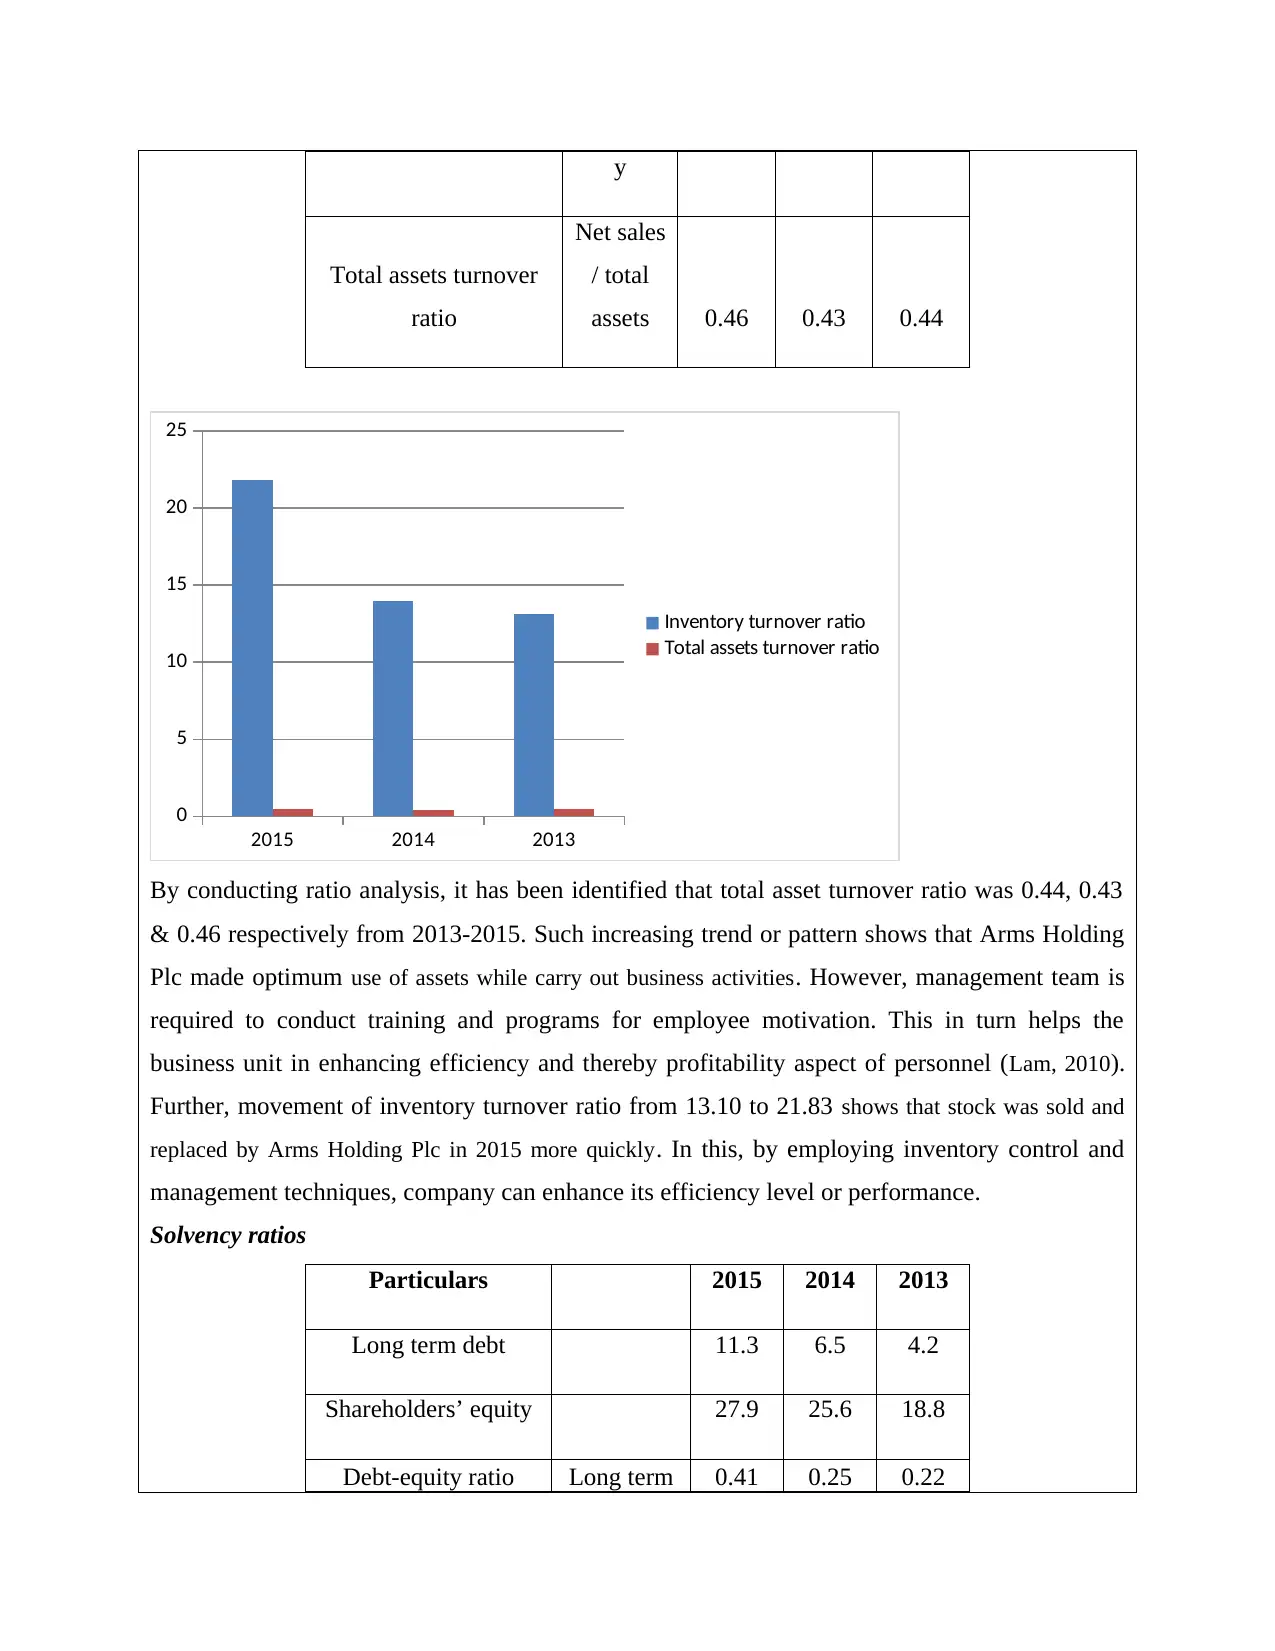
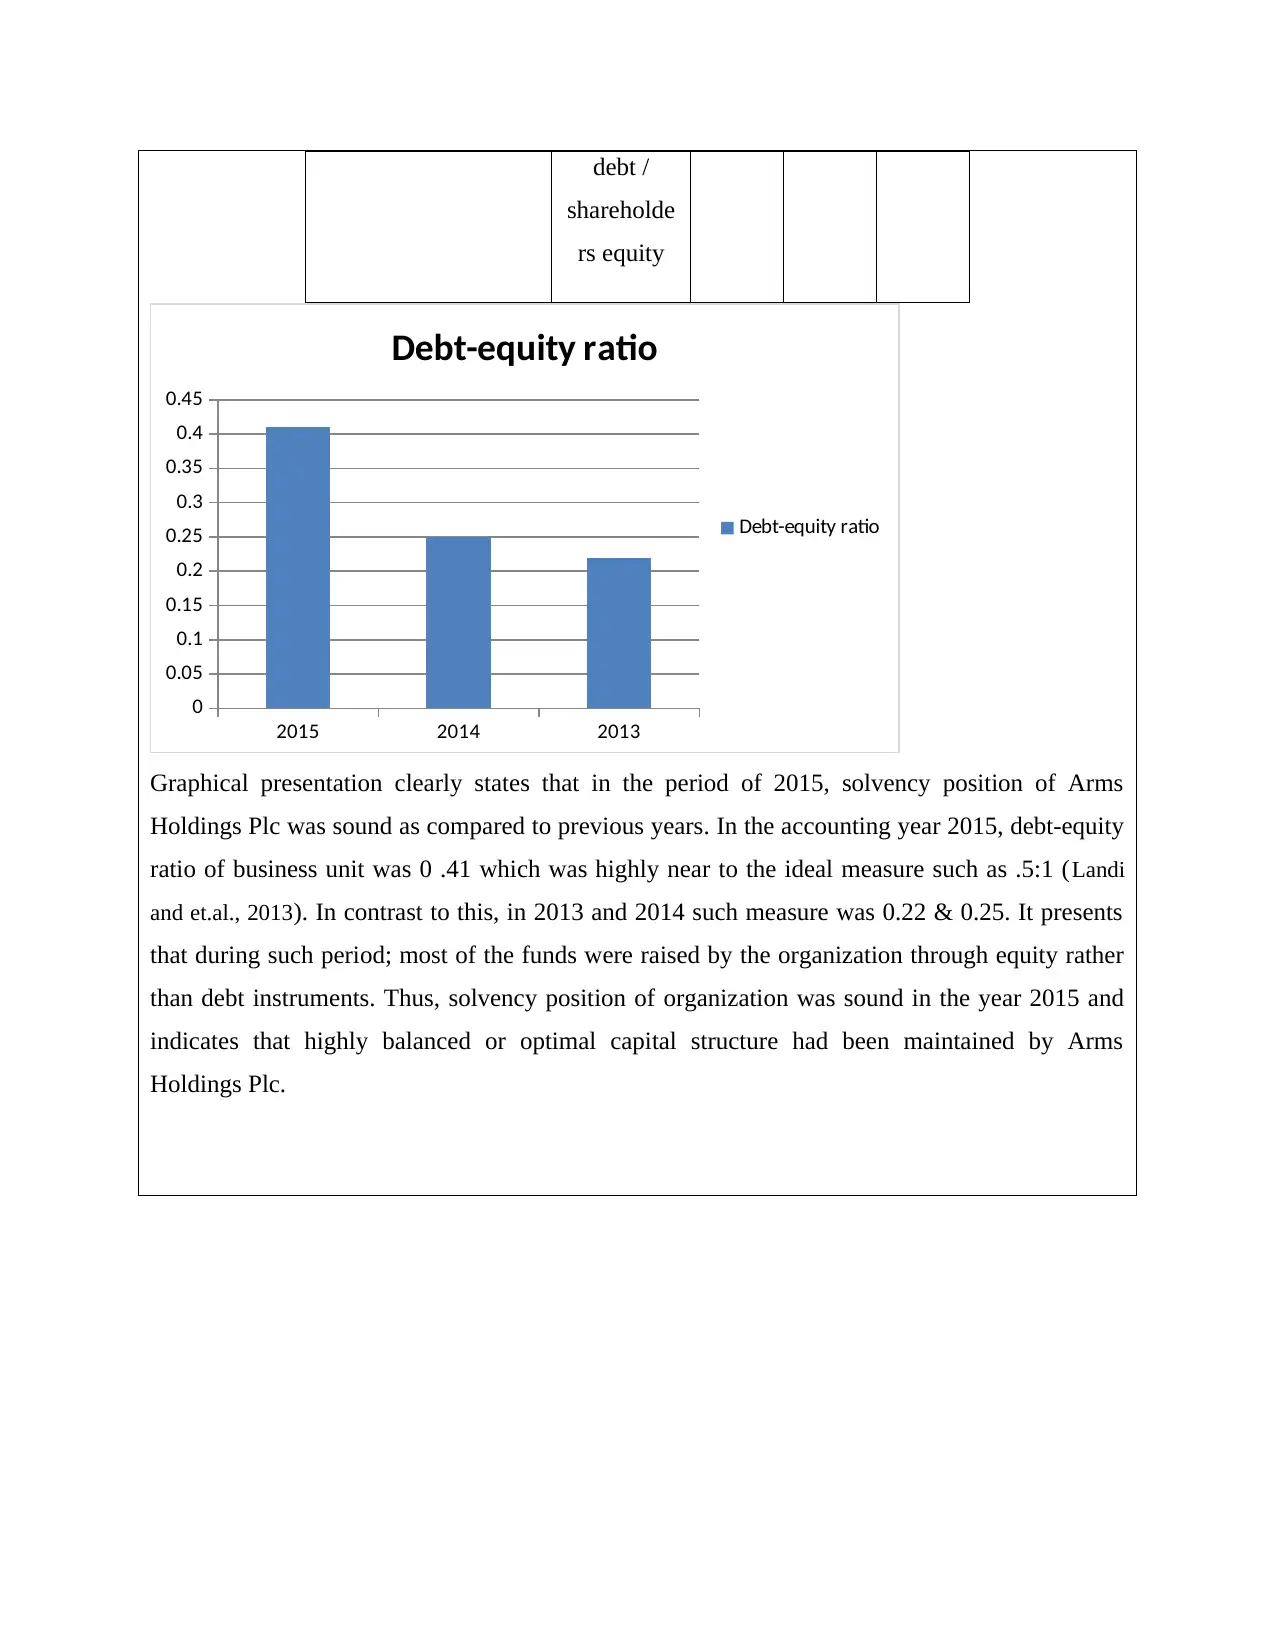
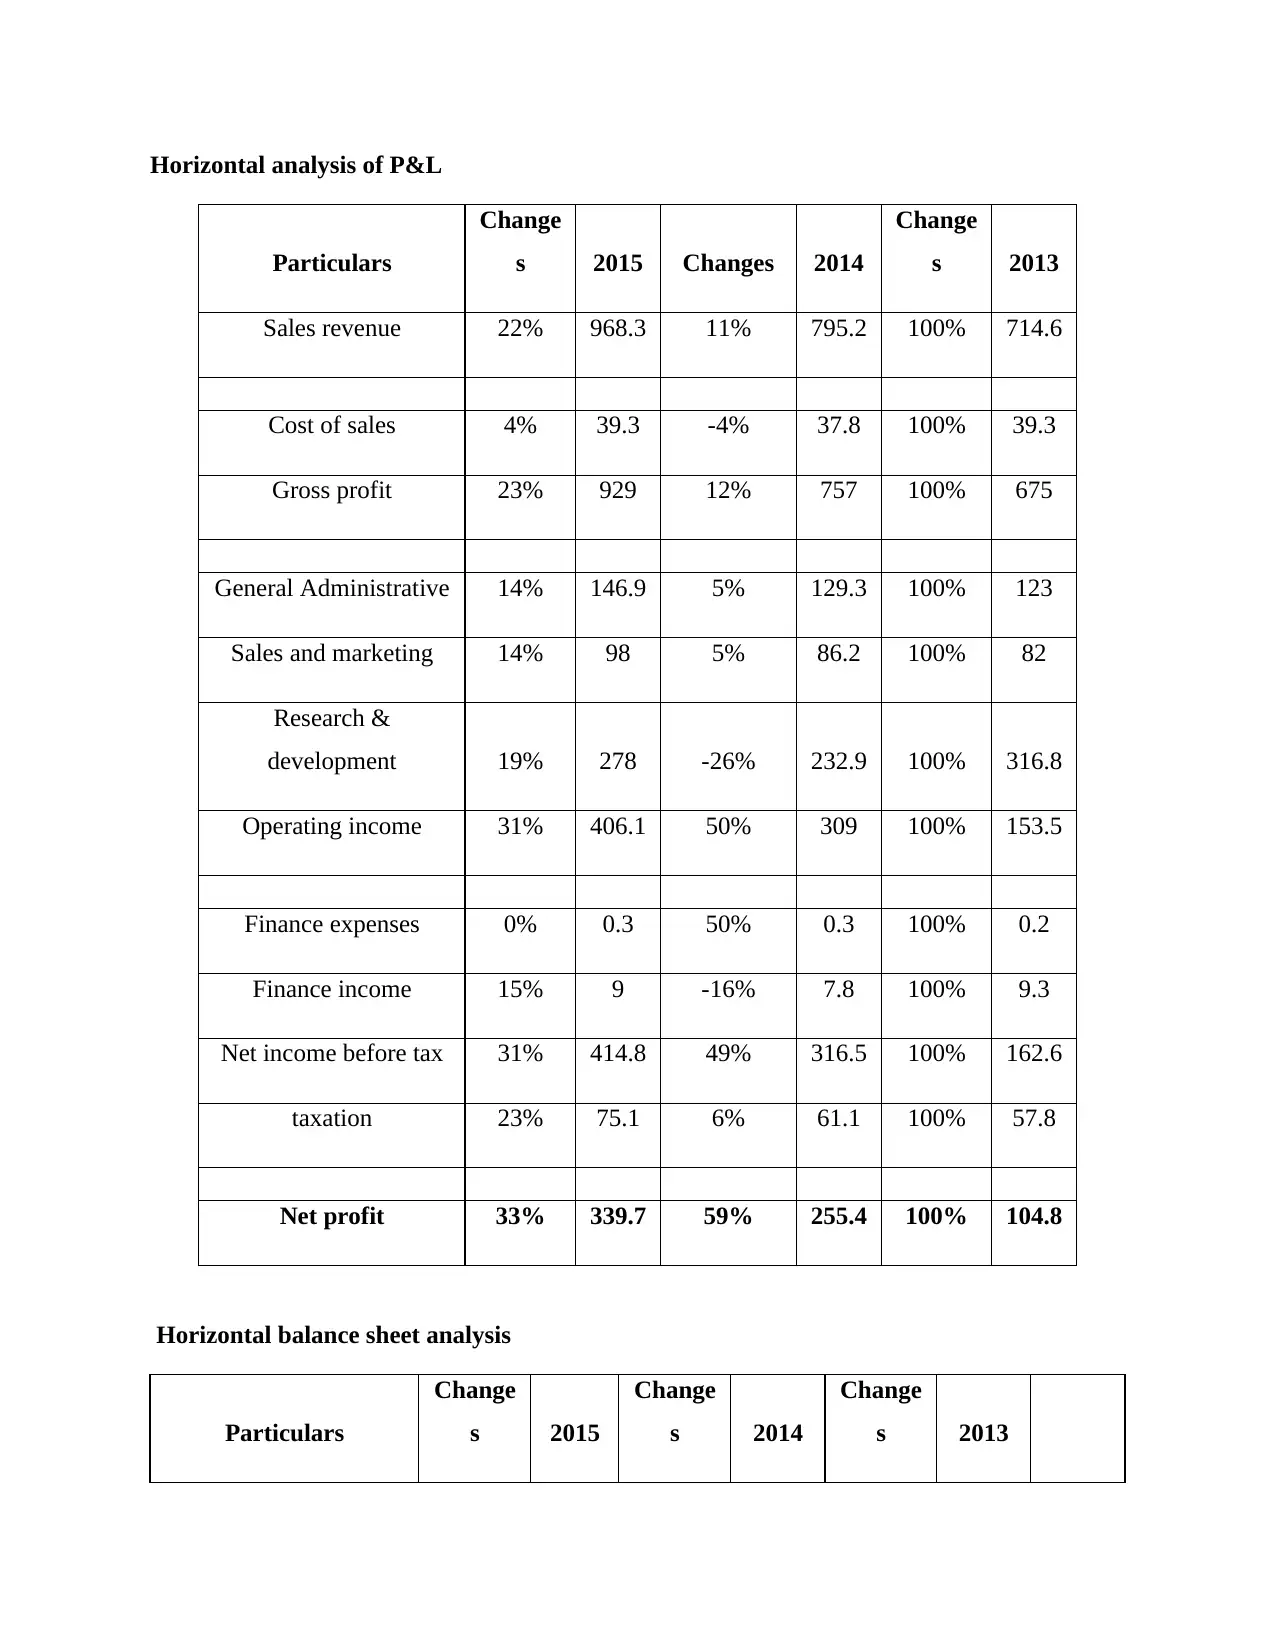
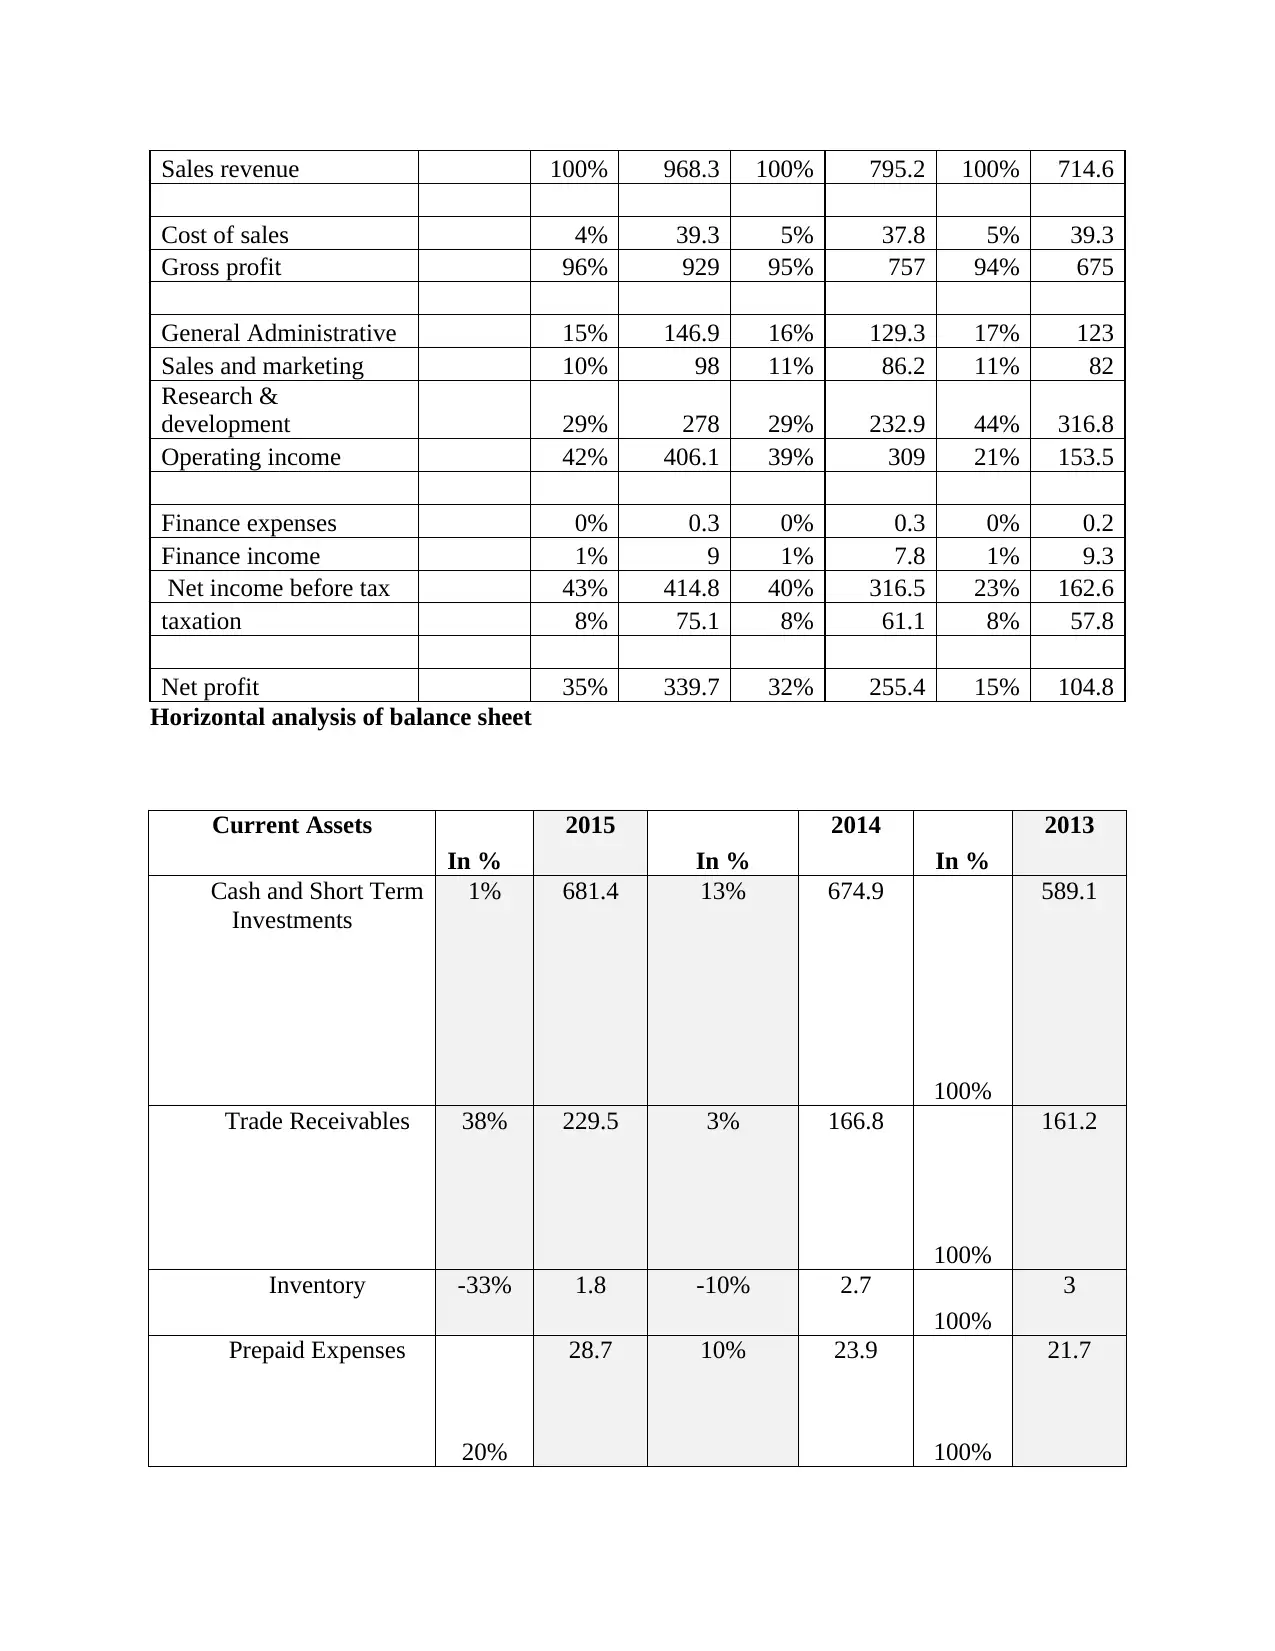
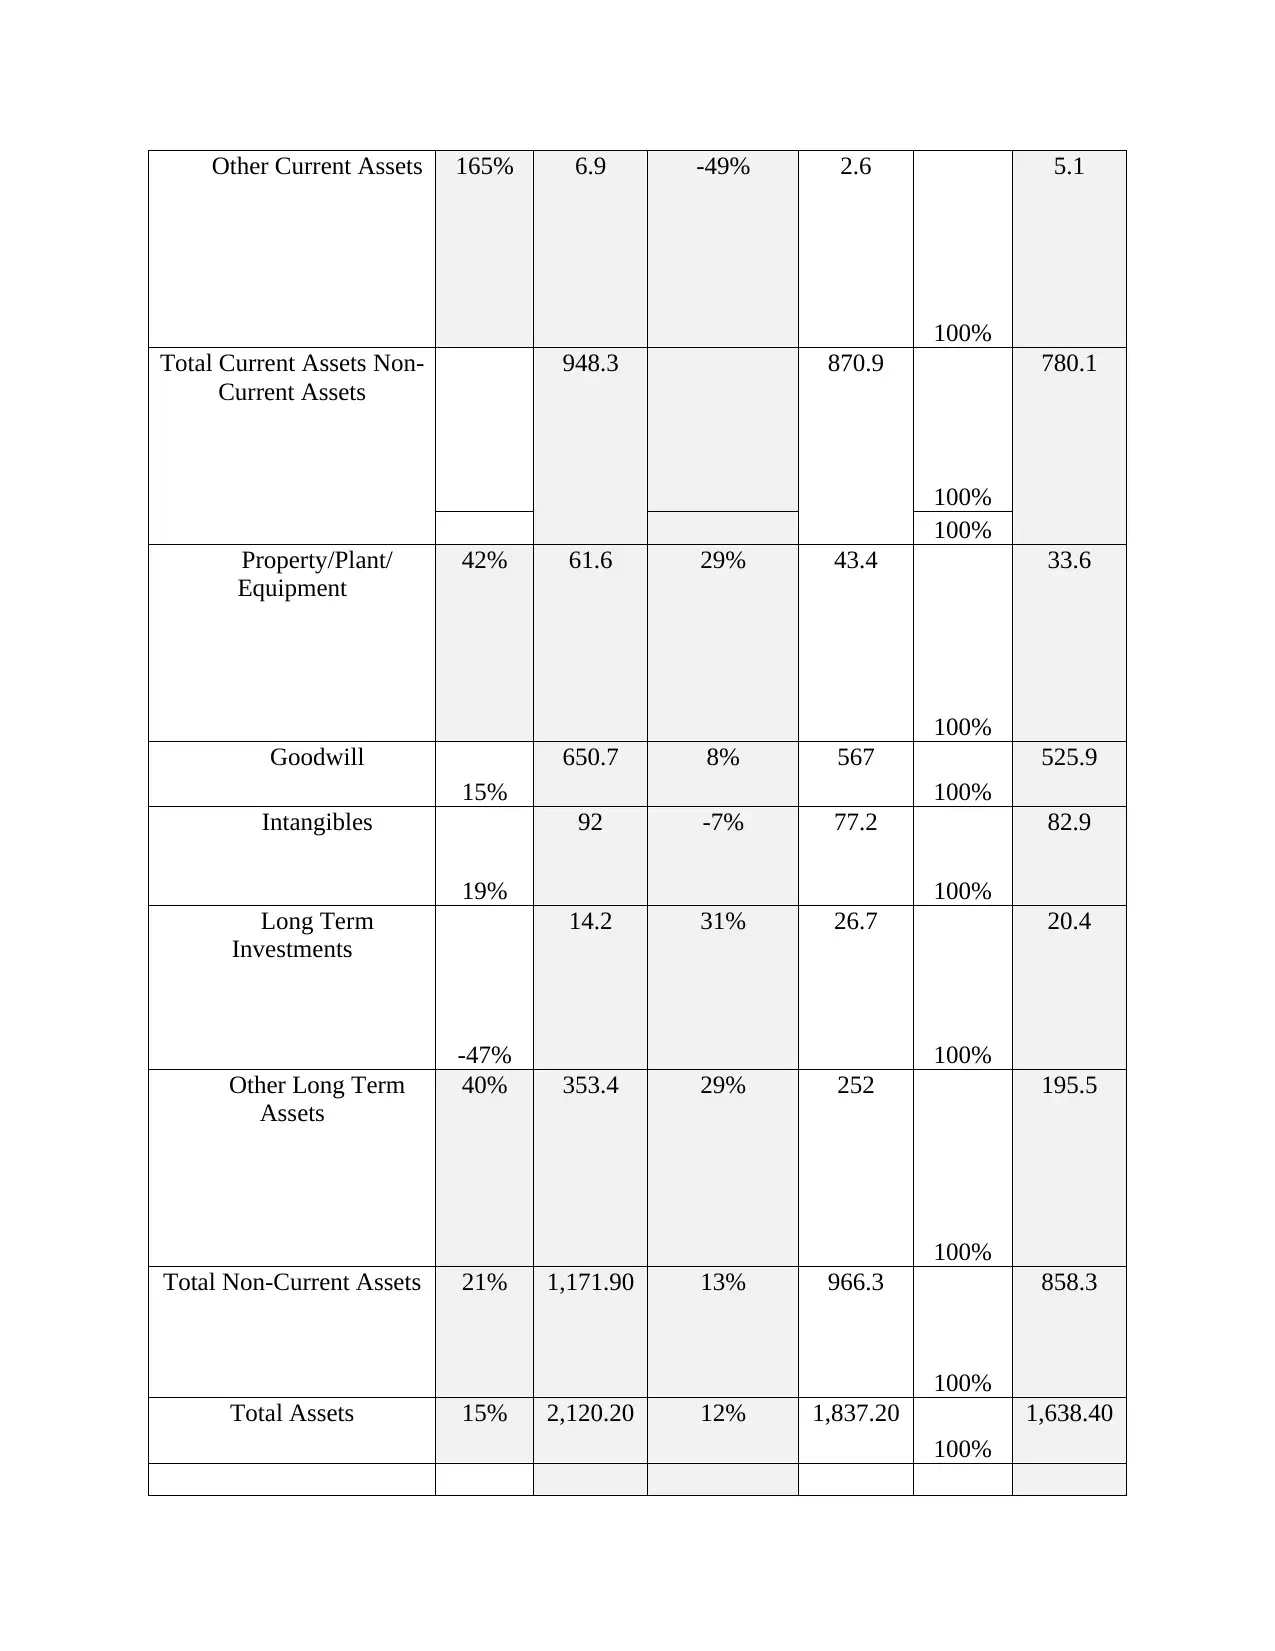
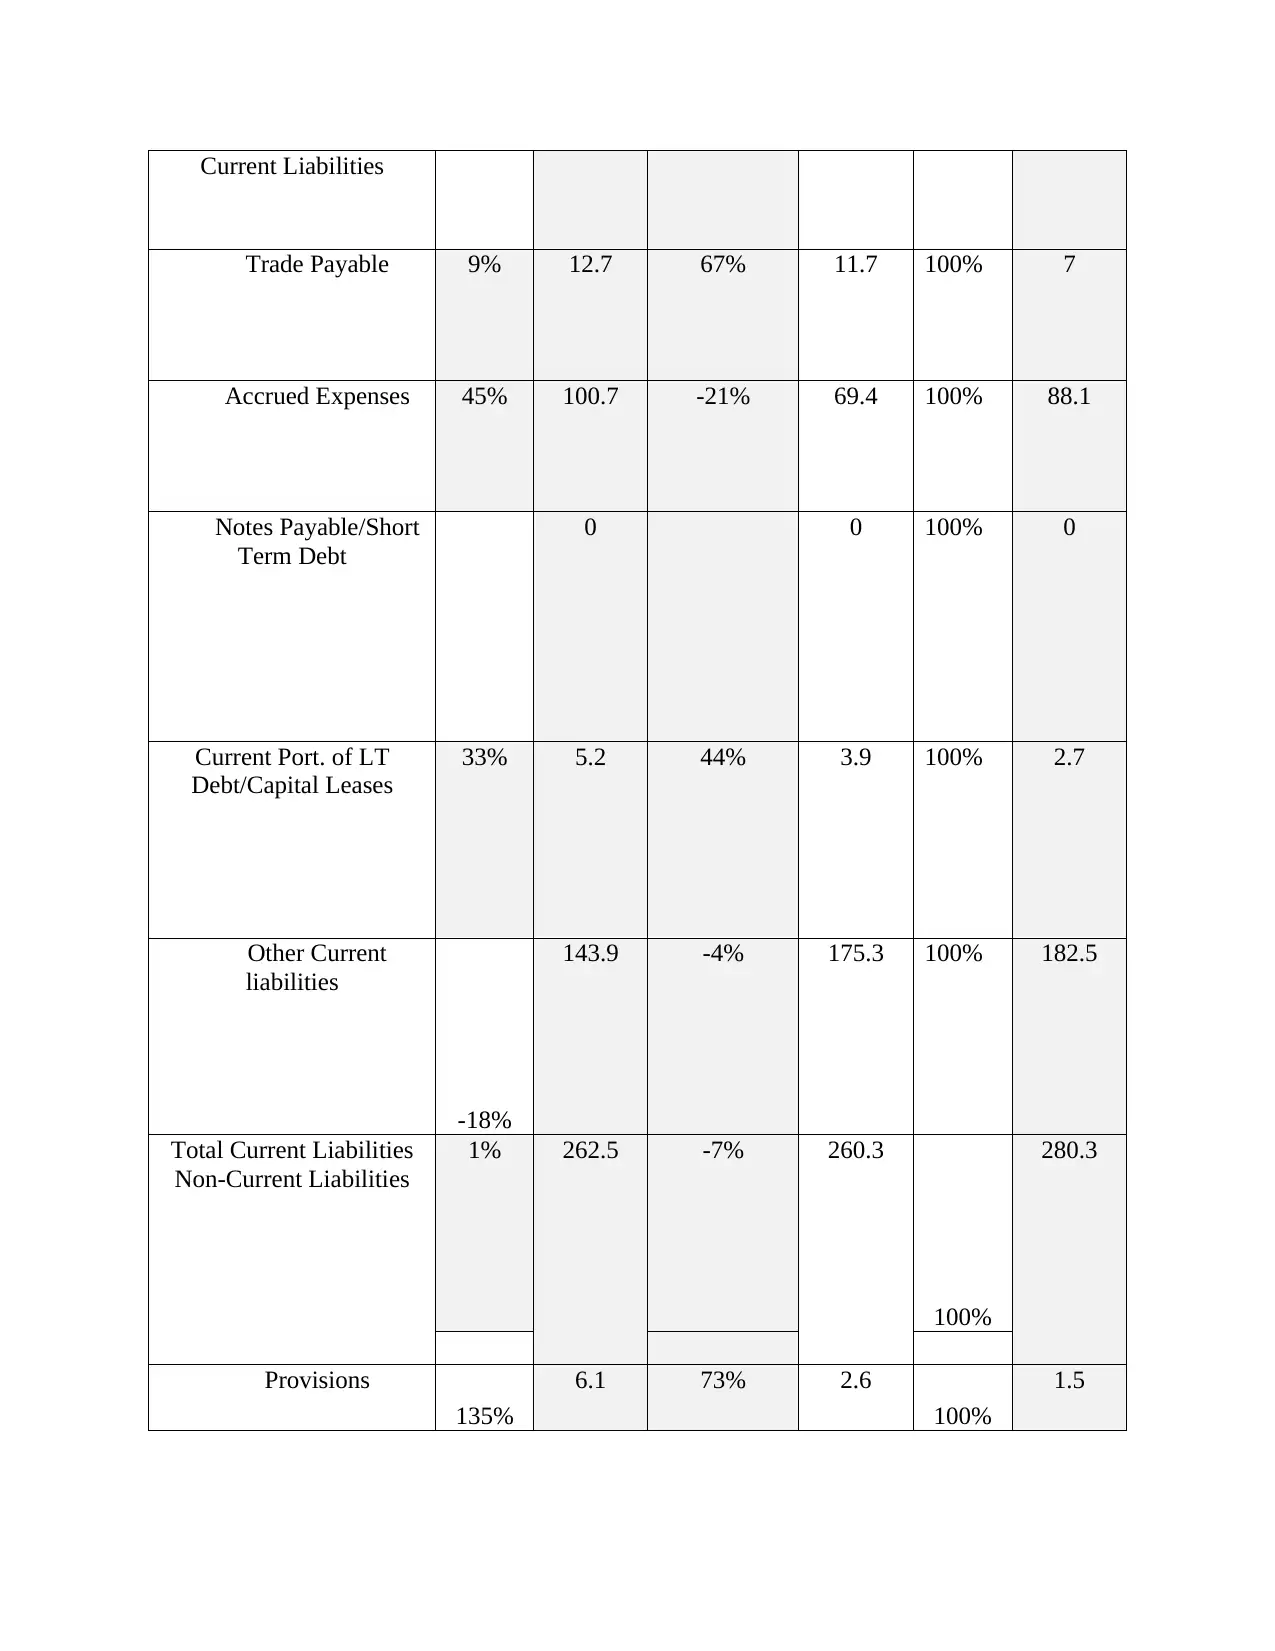
This report provides a comprehensive financial performance analysis of ARM Holdings Plc, evaluating its performance from 2013 to 2015. The analysis employs various financial ratios, including profitability, liquidity, efficiency, and solvency ratios, to assess the company's financial health. The report includes detailed calculations and interpretations of these ratios, comparing them across the specified years. Furthermore, it incorporates horizontal and vertical analyses of the income statement and balance sheet to identify trends and significant changes in financial metrics. The case study also explores potential business expansion strategies for a restaurant chain, Tuesday, evaluating different scenarios and their financial implications. The report's findings offer insights into ARM Holdings Plc's financial management and provide a framework for strategic decision-making, highlighting areas of strength and potential improvement.

1 out of 21
Related Documents


Your All-in-One AI-Powered Toolkit for Academic Success.
+13062052269
info@desklib.com
Available 24*7 on WhatsApp / Email
![[object Object]](/_next/static/media/star-bottom.7253800d.svg)
Copyright © 2020–2026 A2Z Services. All Rights Reserved. Developed and managed by ZUCOL.