Materials Selection Report for Playground Ladder Component
VerifiedAdded on 2022/09/26
|7
|1886
|20
Report
AI Summary
This report focuses on the materials selection process for a playground ladder, emphasizing the importance of analyzing mechanical properties. It begins by examining the stress-strain graph of an unknown material, calculating key parameters like Young's Modulus, yield stress, ultimate stress, ductility, and modulus of toughness to identify it as aluminum. The report then explores various materials suitable for ladder construction, including fiberglass, wood, and aluminum, based on design requirements and industry standards. A detailed comparison of these materials, considering factors like toughness, weight, corrosion resistance, and sustainability, leads to the conclusion that aluminum is the best overall choice for its cost-effectiveness, durability, and recyclability. The report underscores the significance of a comprehensive material analysis for ensuring the performance, durability, and safety of playground equipment.
Materials Selection 1
MATERIALS SELECTION
Name
Course
Professor
University
City/state
Date
MATERIALS SELECTION
Name
Course
Professor
University
City/state
Date
Paraphrase This Document
Need a fresh take? Get an instant paraphrase of this document with our AI Paraphraser
Materials Selection 2
Materials Selection
1. Aim, scope and significance
The main aim of this assessment task is to investigate mechanical properties of materials so as to select
materials that meet specific design criteria of the proposed component for the playground equipment –
the ladder. The task comprises of using experimental data to analyze mechanical properties of the
material, identify the unknown material, determine a range of suitable materials that can be used to
manufacture the component, and select the best material based on various design criteria and
requirements. This task ascertains the importance of examining mechanical properties of materials so as
to select the best materials that has the capacity to perform the intended function effectively and
efficiently.
2. Part 1: Mechanical properties
Stress= Force
Cross sectional area
Cross sectional area, A = πr2 = π x (4mm)2 = 50.2655mm2
Strain= Extension
Original length CITATION Shand3 \l 1033 (Sharma, (n.d.))
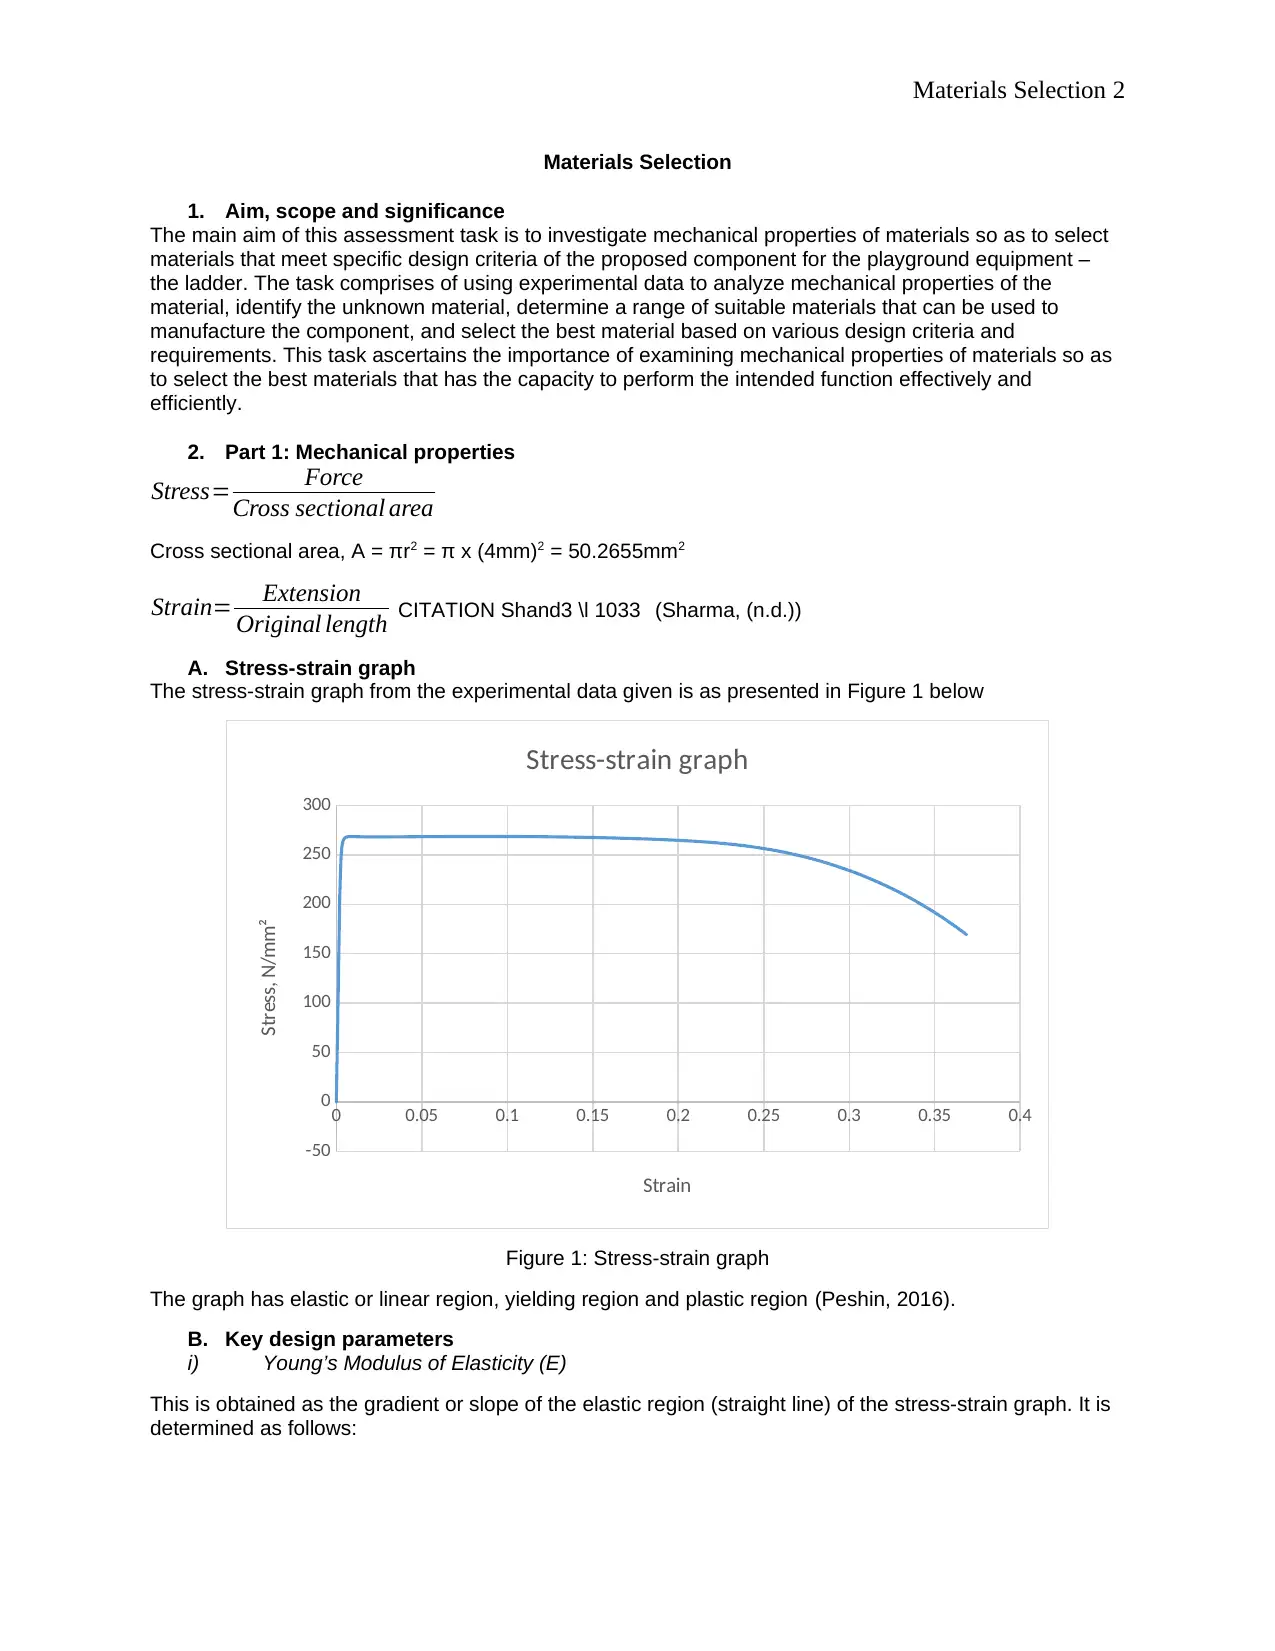
A. Stress-strain graph
The stress-strain graph from the experimental data given is as presented in Figure 1 below
0 0.05 0.1 0.15 0.2 0.25 0.3 0.35 0.4
-50
0
50
100
150
200
250
300
Stress-strain graph
Strain
Stress, N/mm²
Figure 1: Stress-strain graph
The graph has elastic or linear region, yielding region and plastic region (Peshin, 2016).
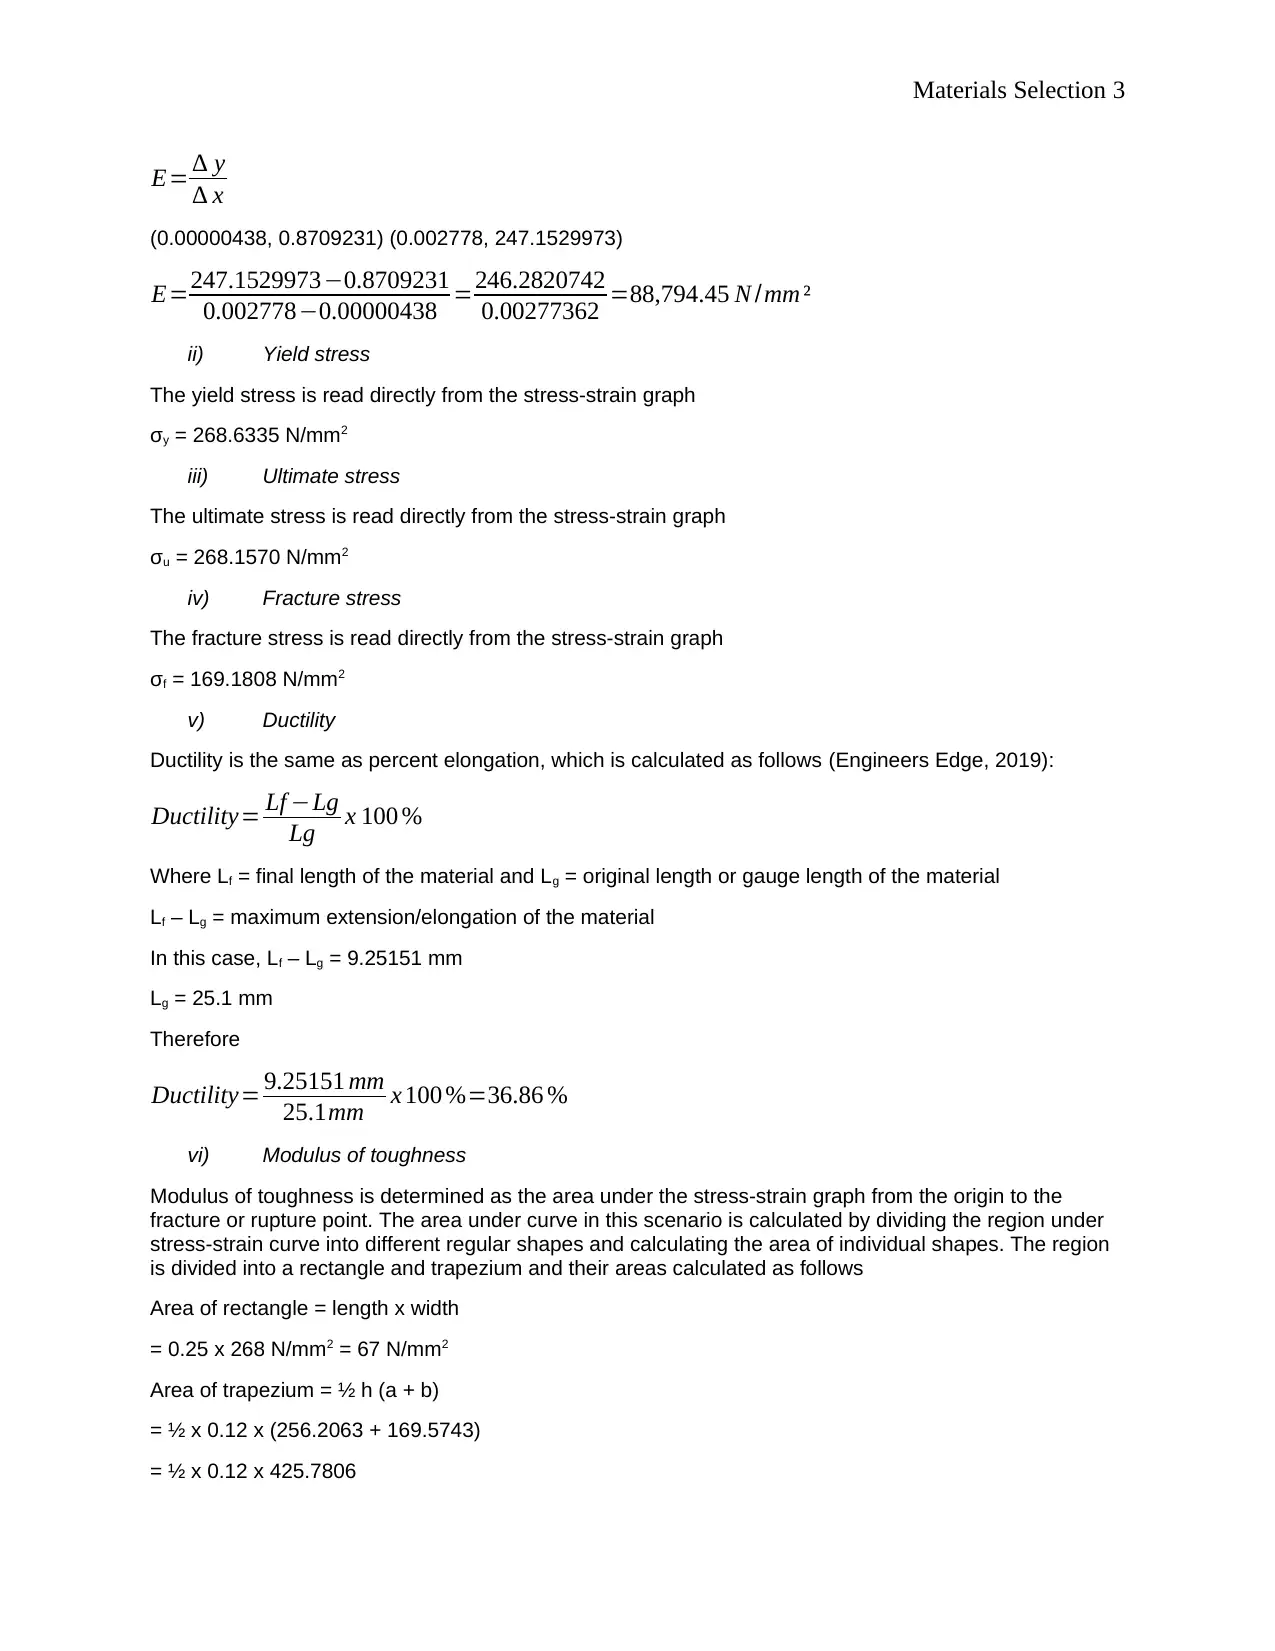
B. Key design parameters
i) Young’s Modulus of Elasticity (E)
This is obtained as the gradient or slope of the elastic region (straight line) of the stress-strain graph. It is
determined as follows:
Materials Selection
1. Aim, scope and significance
The main aim of this assessment task is to investigate mechanical properties of materials so as to select
materials that meet specific design criteria of the proposed component for the playground equipment –
the ladder. The task comprises of using experimental data to analyze mechanical properties of the
material, identify the unknown material, determine a range of suitable materials that can be used to
manufacture the component, and select the best material based on various design criteria and
requirements. This task ascertains the importance of examining mechanical properties of materials so as
to select the best materials that has the capacity to perform the intended function effectively and
efficiently.
2. Part 1: Mechanical properties
Stress= Force
Cross sectional area
Cross sectional area, A = πr2 = π x (4mm)2 = 50.2655mm2
Strain= Extension
Original length CITATION Shand3 \l 1033 (Sharma, (n.d.))
A. Stress-strain graph
The stress-strain graph from the experimental data given is as presented in Figure 1 below
0 0.05 0.1 0.15 0.2 0.25 0.3 0.35 0.4
-50
0
50
100
150
200
250
300
Stress-strain graph
Strain
Stress, N/mm²
Figure 1: Stress-strain graph
The graph has elastic or linear region, yielding region and plastic region (Peshin, 2016).
B. Key design parameters
i) Young’s Modulus of Elasticity (E)
This is obtained as the gradient or slope of the elastic region (straight line) of the stress-strain graph. It is
determined as follows:
Materials Selection 3
E= ∆ y
∆ x
(0.00000438, 0.8709231) (0.002778, 247.1529973)
E=247.1529973−0.8709231
0.002778−0.00000438 =246.2820742
0.00277362 =88,794.45 N /mm ²
ii) Yield stress
The yield stress is read directly from the stress-strain graph
σy = 268.6335 N/mm2
iii) Ultimate stress
The ultimate stress is read directly from the stress-strain graph
σu = 268.1570 N/mm2
iv) Fracture stress
The fracture stress is read directly from the stress-strain graph
σf = 169.1808 N/mm2
v) Ductility
Ductility is the same as percent elongation, which is calculated as follows (Engineers Edge, 2019):
Ductility= Lf −Lg
Lg x 100 %
Where Lf = final length of the material and Lg = original length or gauge length of the material
Lf – Lg = maximum extension/elongation of the material
In this case, Lf – Lg = 9.25151 mm
Lg = 25.1 mm
Therefore
Ductility= 9.25151 mm
25.1mm x 100 %=36.86 %
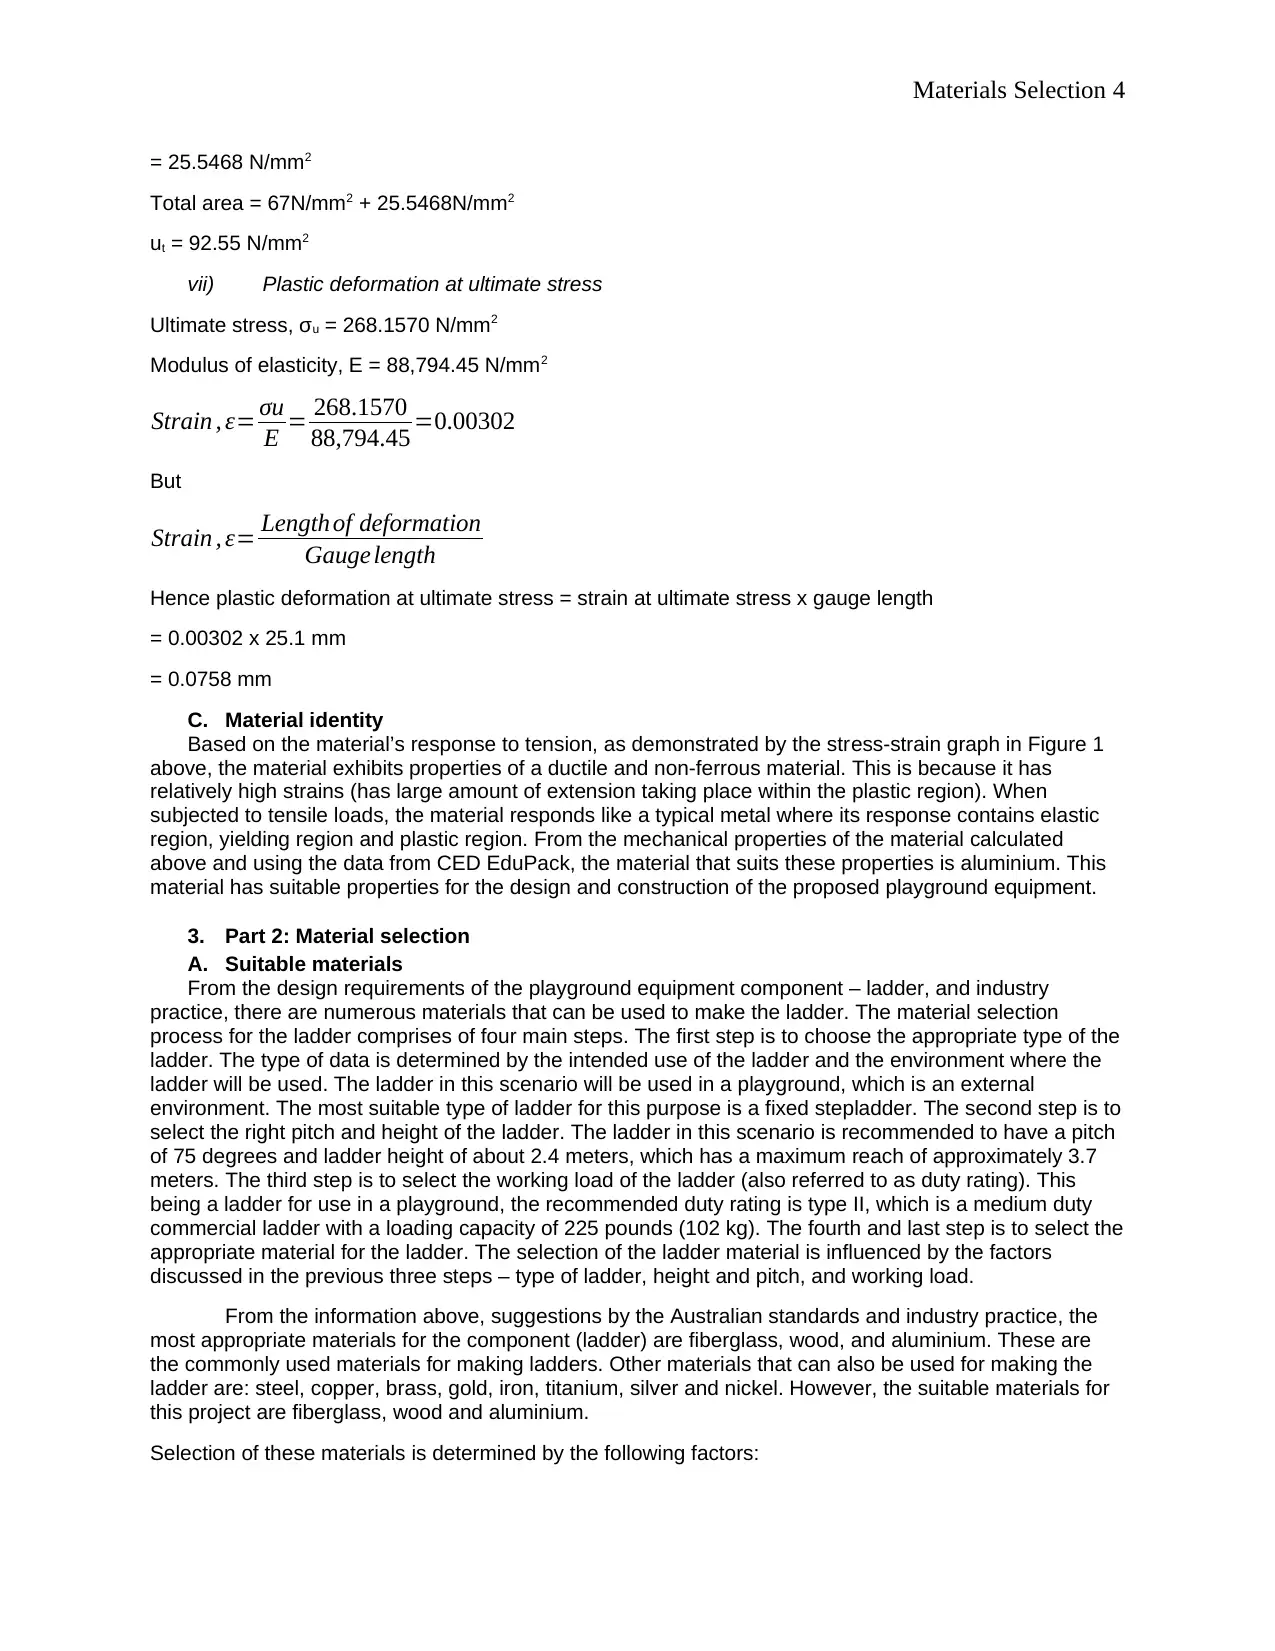
vi) Modulus of toughness
Modulus of toughness is determined as the area under the stress-strain graph from the origin to the
fracture or rupture point. The area under curve in this scenario is calculated by dividing the region under
stress-strain curve into different regular shapes and calculating the area of individual shapes. The region
is divided into a rectangle and trapezium and their areas calculated as follows
Area of rectangle = length x width
= 0.25 x 268 N/mm2 = 67 N/mm2
Area of trapezium = ½ h (a + b)
= ½ x 0.12 x (256.2063 + 169.5743)
= ½ x 0.12 x 425.7806
E= ∆ y
∆ x
(0.00000438, 0.8709231) (0.002778, 247.1529973)
E=247.1529973−0.8709231
0.002778−0.00000438 =246.2820742
0.00277362 =88,794.45 N /mm ²
ii) Yield stress
The yield stress is read directly from the stress-strain graph
σy = 268.6335 N/mm2
iii) Ultimate stress
The ultimate stress is read directly from the stress-strain graph
σu = 268.1570 N/mm2
iv) Fracture stress
The fracture stress is read directly from the stress-strain graph
σf = 169.1808 N/mm2
v) Ductility
Ductility is the same as percent elongation, which is calculated as follows (Engineers Edge, 2019):
Ductility= Lf −Lg
Lg x 100 %
Where Lf = final length of the material and Lg = original length or gauge length of the material
Lf – Lg = maximum extension/elongation of the material
In this case, Lf – Lg = 9.25151 mm
Lg = 25.1 mm
Therefore
Ductility= 9.25151 mm
25.1mm x 100 %=36.86 %
vi) Modulus of toughness
Modulus of toughness is determined as the area under the stress-strain graph from the origin to the
fracture or rupture point. The area under curve in this scenario is calculated by dividing the region under
stress-strain curve into different regular shapes and calculating the area of individual shapes. The region
is divided into a rectangle and trapezium and their areas calculated as follows
Area of rectangle = length x width
= 0.25 x 268 N/mm2 = 67 N/mm2
Area of trapezium = ½ h (a + b)
= ½ x 0.12 x (256.2063 + 169.5743)
= ½ x 0.12 x 425.7806
⊘ This is a preview!⊘
Do you want full access?
Subscribe today to unlock all pages.
Trusted by 1+ million students worldwide
Materials Selection 4
= 25.5468 N/mm2
Total area = 67N/mm2 + 25.5468N/mm2
ut = 92.55 N/mm2
vii) Plastic deformation at ultimate stress
Ultimate stress, σu = 268.1570 N/mm2
Modulus of elasticity, E = 88,794.45 N/mm2
Strain , ε= σu
E = 268.1570
88,794.45 =0.00302
But
Strain , ε= Length of deformation
Gaugelength
Hence plastic deformation at ultimate stress = strain at ultimate stress x gauge length
= 0.00302 x 25.1 mm
= 0.0758 mm
C. Material identity
Based on the material’s response to tension, as demonstrated by the stress-strain graph in Figure 1
above, the material exhibits properties of a ductile and non-ferrous material. This is because it has
relatively high strains (has large amount of extension taking place within the plastic region). When
subjected to tensile loads, the material responds like a typical metal where its response contains elastic
region, yielding region and plastic region. From the mechanical properties of the material calculated
above and using the data from CED EduPack, the material that suits these properties is aluminium. This
material has suitable properties for the design and construction of the proposed playground equipment.
3. Part 2: Material selection
A. Suitable materials
From the design requirements of the playground equipment component – ladder, and industry
practice, there are numerous materials that can be used to make the ladder. The material selection
process for the ladder comprises of four main steps. The first step is to choose the appropriate type of the
ladder. The type of data is determined by the intended use of the ladder and the environment where the
ladder will be used. The ladder in this scenario will be used in a playground, which is an external
environment. The most suitable type of ladder for this purpose is a fixed stepladder. The second step is to
select the right pitch and height of the ladder. The ladder in this scenario is recommended to have a pitch
of 75 degrees and ladder height of about 2.4 meters, which has a maximum reach of approximately 3.7
meters. The third step is to select the working load of the ladder (also referred to as duty rating). This
being a ladder for use in a playground, the recommended duty rating is type II, which is a medium duty
commercial ladder with a loading capacity of 225 pounds (102 kg). The fourth and last step is to select the
appropriate material for the ladder. The selection of the ladder material is influenced by the factors
discussed in the previous three steps – type of ladder, height and pitch, and working load.
From the information above, suggestions by the Australian standards and industry practice, the
most appropriate materials for the component (ladder) are fiberglass, wood, and aluminium. These are
the commonly used materials for making ladders. Other materials that can also be used for making the
ladder are: steel, copper, brass, gold, iron, titanium, silver and nickel. However, the suitable materials for
this project are fiberglass, wood and aluminium.
Selection of these materials is determined by the following factors:
Paraphrase This Document
Need a fresh take? Get an instant paraphrase of this document with our AI Paraphraser
Materials Selection 5
Toughness: the materials must have high strength and resilient enough to withstand significant
amount of load.
Weight: the materials should have a high strength to volume ratio (lightweight).
Moisture resistance: the materials should resist moisture penetration and not prone to rot when
exposed to water.
Corrosion resistance: the materials should resist corrosion when exposed to conditions that
facilitate the same.
Thermal conductivity: the materials should not allow excessive penetration of heat when exposed
to high temperature.
Constructionability: the materials should be easy to manufacture, construct or assemble using
available tools and equipment.
Customizability: the materials should be flexible enough to allow customization into different
shapes, sizes, texture and colour.
Reparability: the materials should be easy to repair when they deteriorate.
Maintenance: the materials should be easy to maintain. Its maintenance requirements and cost
should be low.
Availability: the materials should be locally available to reduce cost and environmental impacts
associated with long-distance transportation.
Aesthetics: the materials should have a high aesthetics value (attractive) either naturally or
through customization and different finishes.
Sustainability: the materials should also be sustainable economically, socially and
environmentally. The material has to be recycled or reused at the end of the component’s useful life.
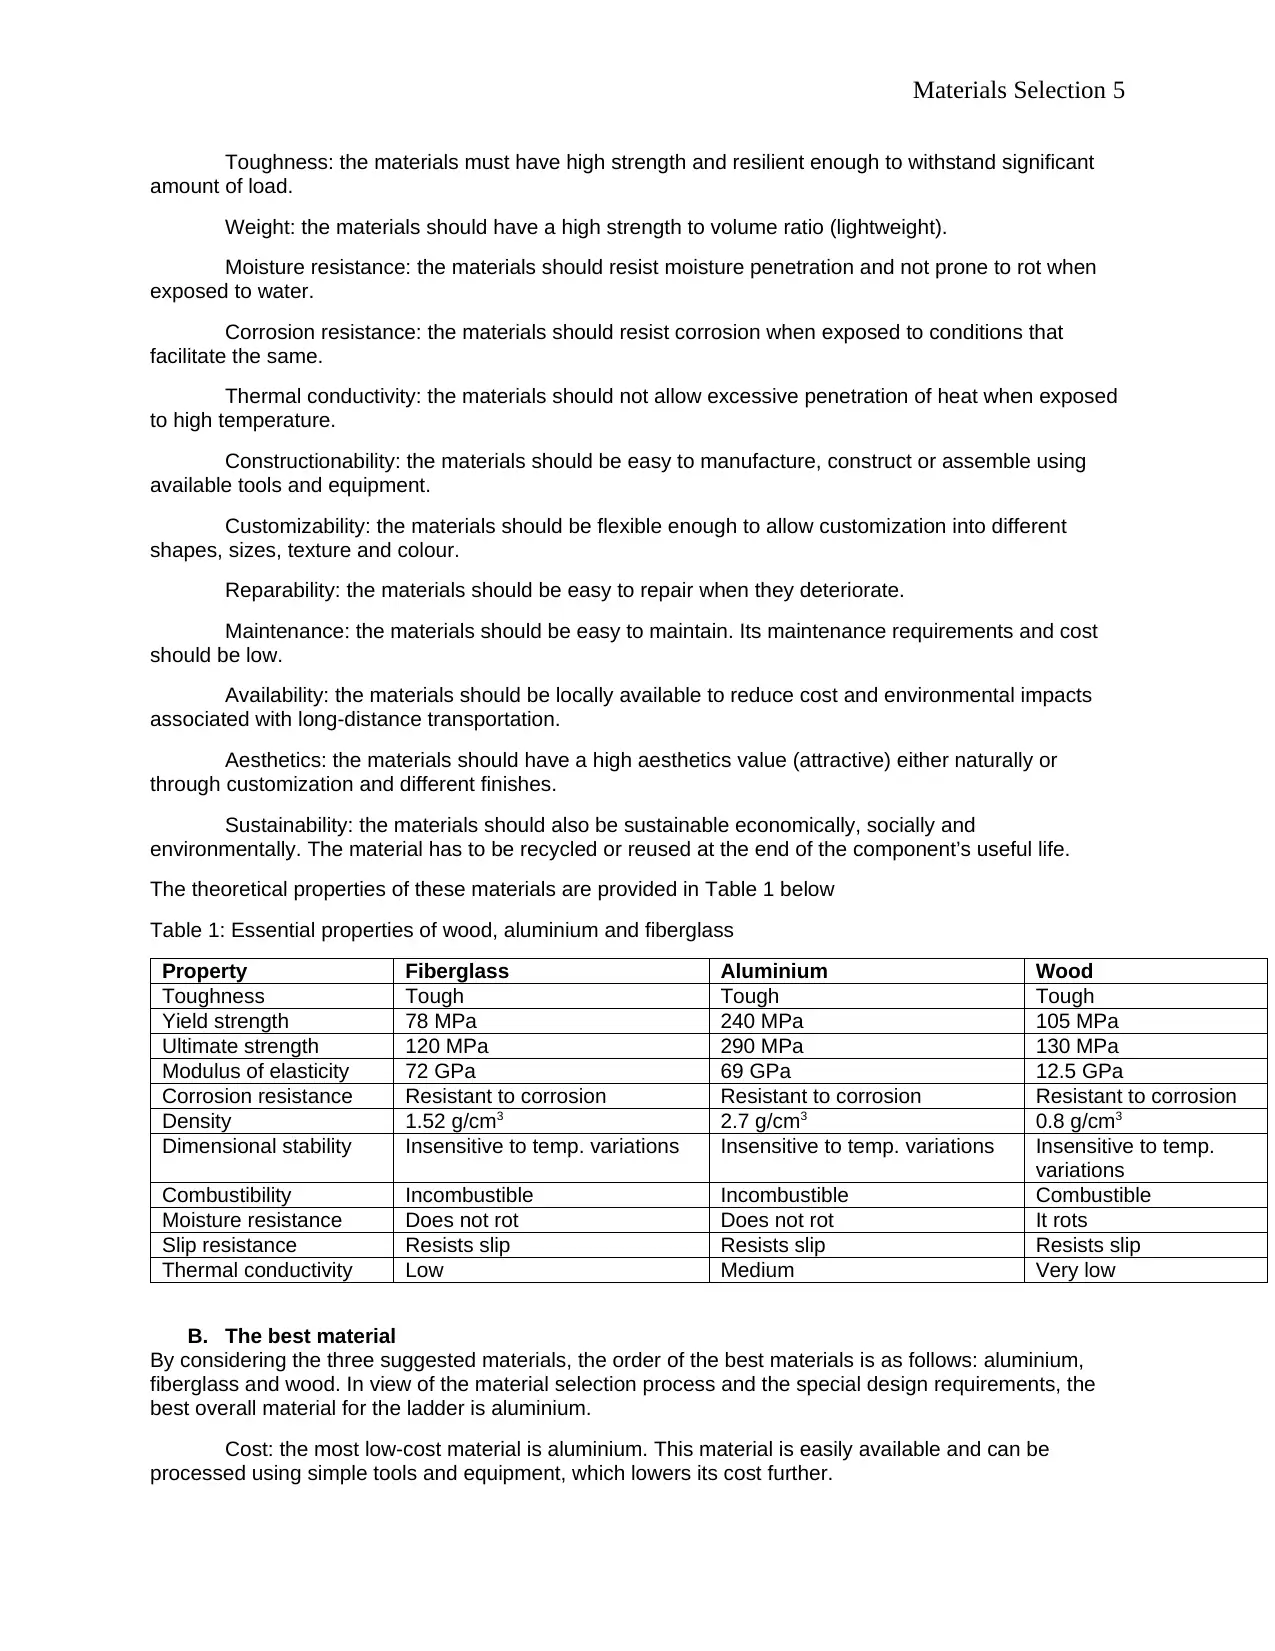
The theoretical properties of these materials are provided in Table 1 below
Table 1: Essential properties of wood, aluminium and fiberglass
Property Fiberglass Aluminium Wood
Toughness Tough Tough Tough
Yield strength 78 MPa 240 MPa 105 MPa
Ultimate strength 120 MPa 290 MPa 130 MPa
Modulus of elasticity 72 GPa 69 GPa 12.5 GPa
Corrosion resistance Resistant to corrosion Resistant to corrosion Resistant to corrosion
Density 1.52 g/cm3 2.7 g/cm3 0.8 g/cm3
Dimensional stability Insensitive to temp. variations Insensitive to temp. variations Insensitive to temp.
variations
Combustibility Incombustible Incombustible Combustible
Moisture resistance Does not rot Does not rot It rots
Slip resistance Resists slip Resists slip Resists slip
Thermal conductivity Low Medium Very low
B. The best material
By considering the three suggested materials, the order of the best materials is as follows: aluminium,
fiberglass and wood. In view of the material selection process and the special design requirements, the
best overall material for the ladder is aluminium.
Cost: the most low-cost material is aluminium. This material is easily available and can be
processed using simple tools and equipment, which lowers its cost further.
Toughness: the materials must have high strength and resilient enough to withstand significant
amount of load.
Weight: the materials should have a high strength to volume ratio (lightweight).
Moisture resistance: the materials should resist moisture penetration and not prone to rot when
exposed to water.
Corrosion resistance: the materials should resist corrosion when exposed to conditions that
facilitate the same.
Thermal conductivity: the materials should not allow excessive penetration of heat when exposed
to high temperature.
Constructionability: the materials should be easy to manufacture, construct or assemble using
available tools and equipment.
Customizability: the materials should be flexible enough to allow customization into different
shapes, sizes, texture and colour.
Reparability: the materials should be easy to repair when they deteriorate.
Maintenance: the materials should be easy to maintain. Its maintenance requirements and cost
should be low.
Availability: the materials should be locally available to reduce cost and environmental impacts
associated with long-distance transportation.
Aesthetics: the materials should have a high aesthetics value (attractive) either naturally or
through customization and different finishes.
Sustainability: the materials should also be sustainable economically, socially and
environmentally. The material has to be recycled or reused at the end of the component’s useful life.
The theoretical properties of these materials are provided in Table 1 below
Table 1: Essential properties of wood, aluminium and fiberglass
Property Fiberglass Aluminium Wood
Toughness Tough Tough Tough
Yield strength 78 MPa 240 MPa 105 MPa
Ultimate strength 120 MPa 290 MPa 130 MPa
Modulus of elasticity 72 GPa 69 GPa 12.5 GPa
Corrosion resistance Resistant to corrosion Resistant to corrosion Resistant to corrosion
Density 1.52 g/cm3 2.7 g/cm3 0.8 g/cm3
Dimensional stability Insensitive to temp. variations Insensitive to temp. variations Insensitive to temp.
variations
Combustibility Incombustible Incombustible Combustible
Moisture resistance Does not rot Does not rot It rots
Slip resistance Resists slip Resists slip Resists slip
Thermal conductivity Low Medium Very low
B. The best material
By considering the three suggested materials, the order of the best materials is as follows: aluminium,
fiberglass and wood. In view of the material selection process and the special design requirements, the
best overall material for the ladder is aluminium.
Cost: the most low-cost material is aluminium. This material is easily available and can be
processed using simple tools and equipment, which lowers its cost further.
Materials Selection 6
Durability: aluminium is the most durable material because it can withstand greater impact and is
more resistant to corrosion and other environmental conditions than fiberglass and wood.
Sustainability: considering the lifecycle costs, environmental impacts, including carbon dioxide
footprint, recyclability and reusability of these materials, aluminium is the most sustainable material.
Aluminium component can be reused directly or recycled into new products at the end of the service life
of the component.
High-tech: the most innovative material or the one associated with cutting edge-technology out of
the three is fiberglass. This is one of the state-of-the-art materials in the manufacture of ladders and other
products (Li, et al., 2013). It is characterized by high performance, low weight and resistance to corrosion
(Lamberson, 2015).
4. Summary
The performance, durability and safety of a system, such as playground equipment, significantly
depends on the type and mechanical properties of the materials of individual components. This report has
found that it is very important to comprehensively examine mechanical properties of materials before
selecting the most suitable material for a playground component. This involves subjecting the sample
materials to appropriate tests so as to obtain relevant mechanical properties. The appropriate materials
that can be used to manufacture the ladder for the playground are fiberglass, wood and aluminium. Based
on the selection process discussed in this report and by considering other factors such as cost, durability,
sustainability and high-tech, the best material for the ladder is aluminium.
⊘ This is a preview!⊘
Do you want full access?
Subscribe today to unlock all pages.
Trusted by 1+ million students worldwide
Materials Selection 7
References
Engineers Edge, 2019. Ductility - Strength (Mechanics) of Materials. [Online]
Available at: https://www.engineersedge.com/material_science/ductility.htm
[Accessed 16 August 2019].
Lamberson, L., 2015. Investigations of High Performance Fiberglass Impact Using a Combustionless
Two-stage Light-gas Gun. Procedia Engineering, 103(1), pp. 341-348.
Li, H., Richards, C. & Watson, J., 2013. High-Performance Glass Fiber Development for Composite
Applications. International Journal of Applied Glass Science, 5(1), pp. 65-81.
Peshin, A., 2016. What is the stress-strain curve?. [Online]
Available at: https://www.scienceabc.com/innovation/what-is-the-stress-strain-curve.html
[Accessed 16 August 2019].
Sharma, S., (n.d.). Mechanical Properties. [Online]
Available at: https://nptel.ac.in/courses/Webcourse-contents/IIT-ROORKEE/strength%20of%20materials/
lects%20&%20picts/image/lect11/lecture11.htm
[Accessed 16 August 2019].
1 out of 7


Your All-in-One AI-Powered Toolkit for Academic Success.
+13062052269
info@desklib.com
Available 24*7 on WhatsApp / Email
![[object Object]](/_next/static/media/star-bottom.7253800d.svg)
Unlock your academic potential
Copyright © 2020–2026 A2Z Services. All Rights Reserved. Developed and managed by ZUCOL.