Analysis of Statistical Data: MATH 1P98 Practical Assignment 1
VerifiedAdded on 2020/04/07
|15
|867
|302
Homework Assignment
AI Summary
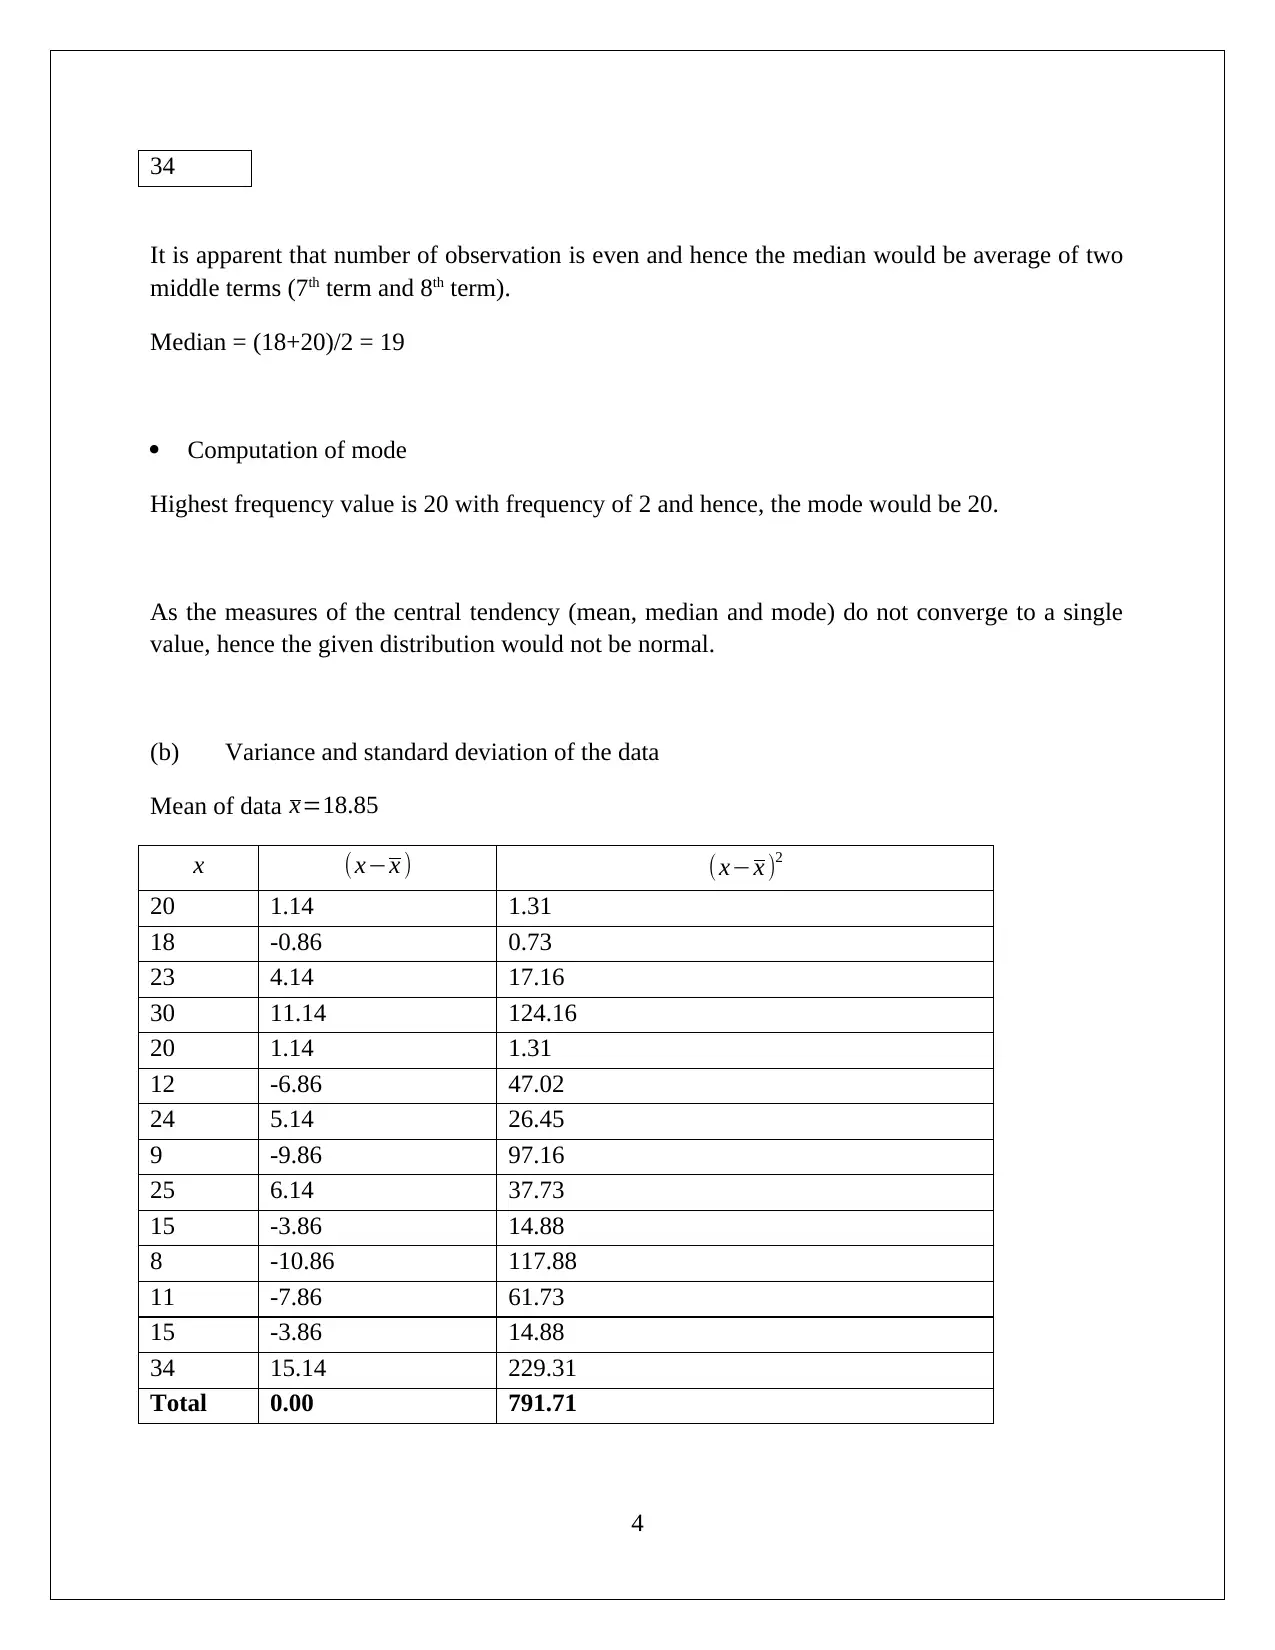
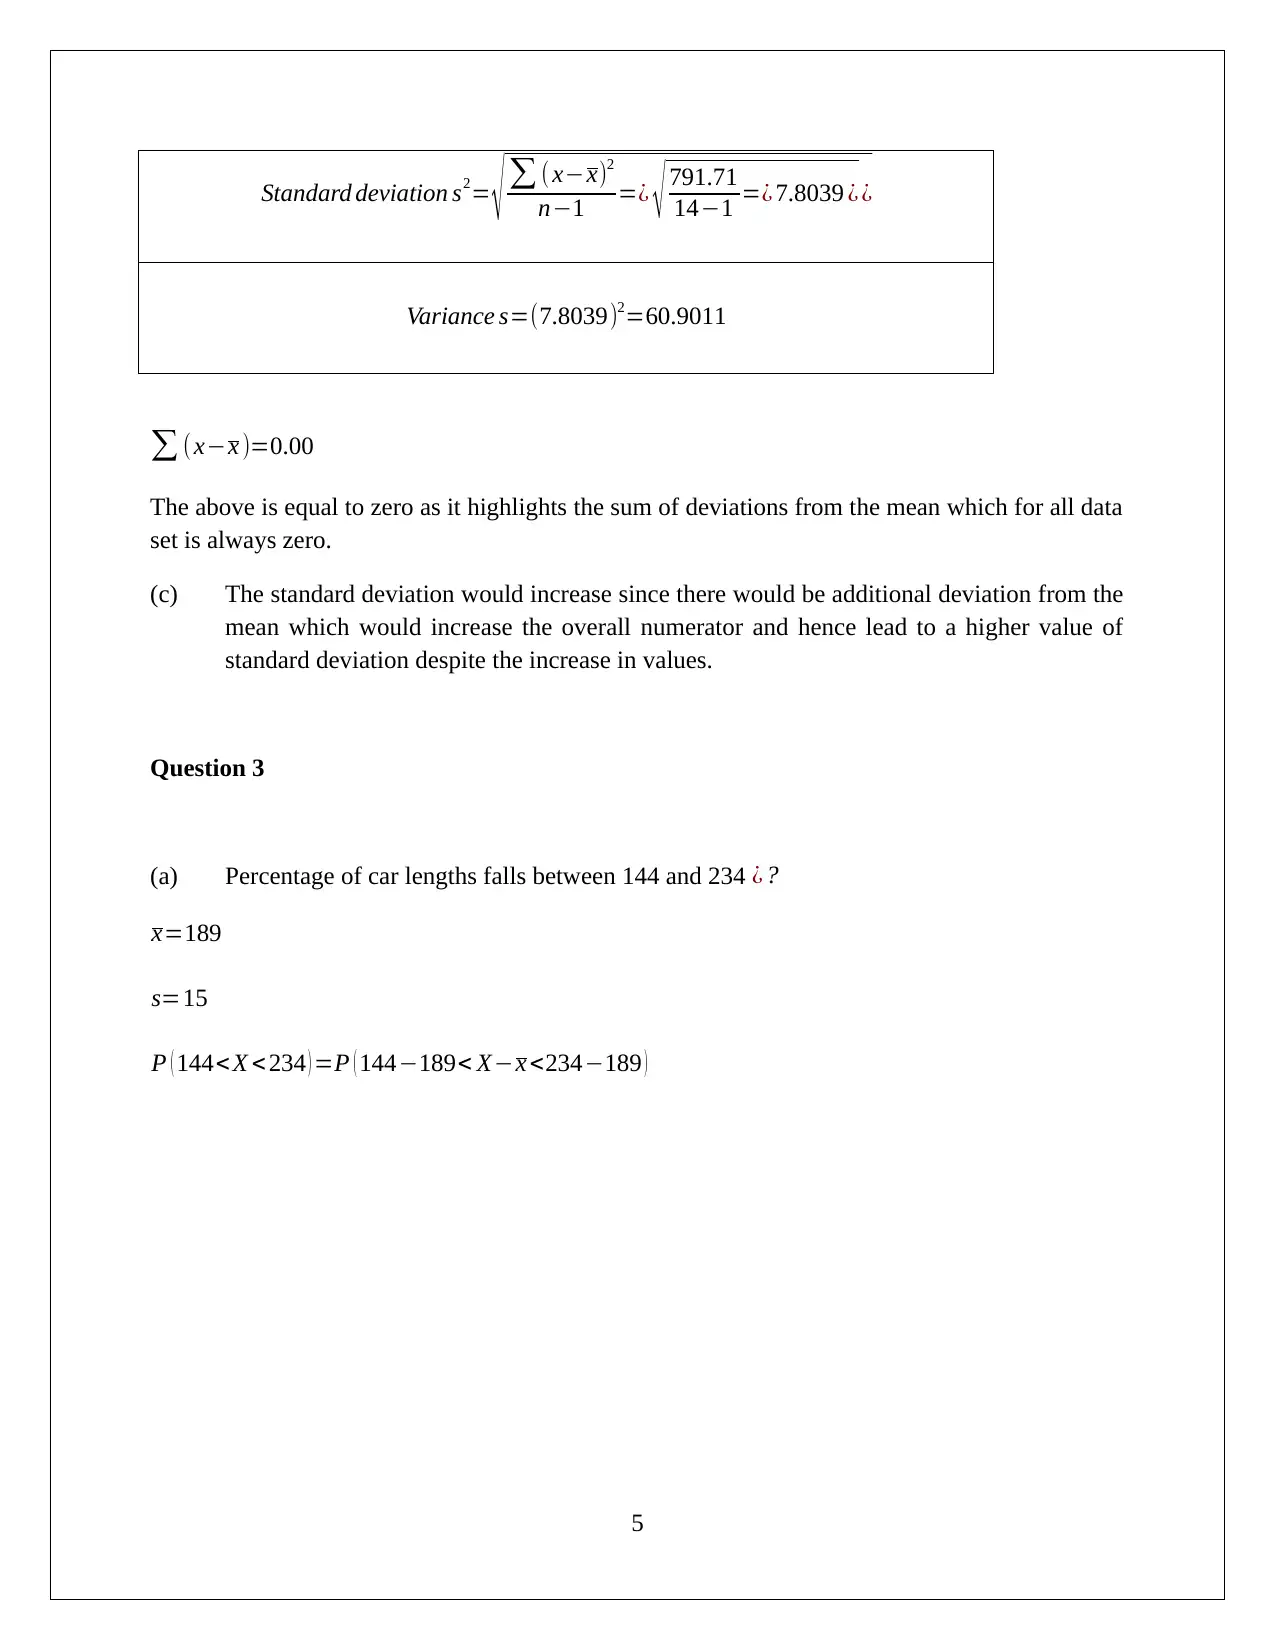
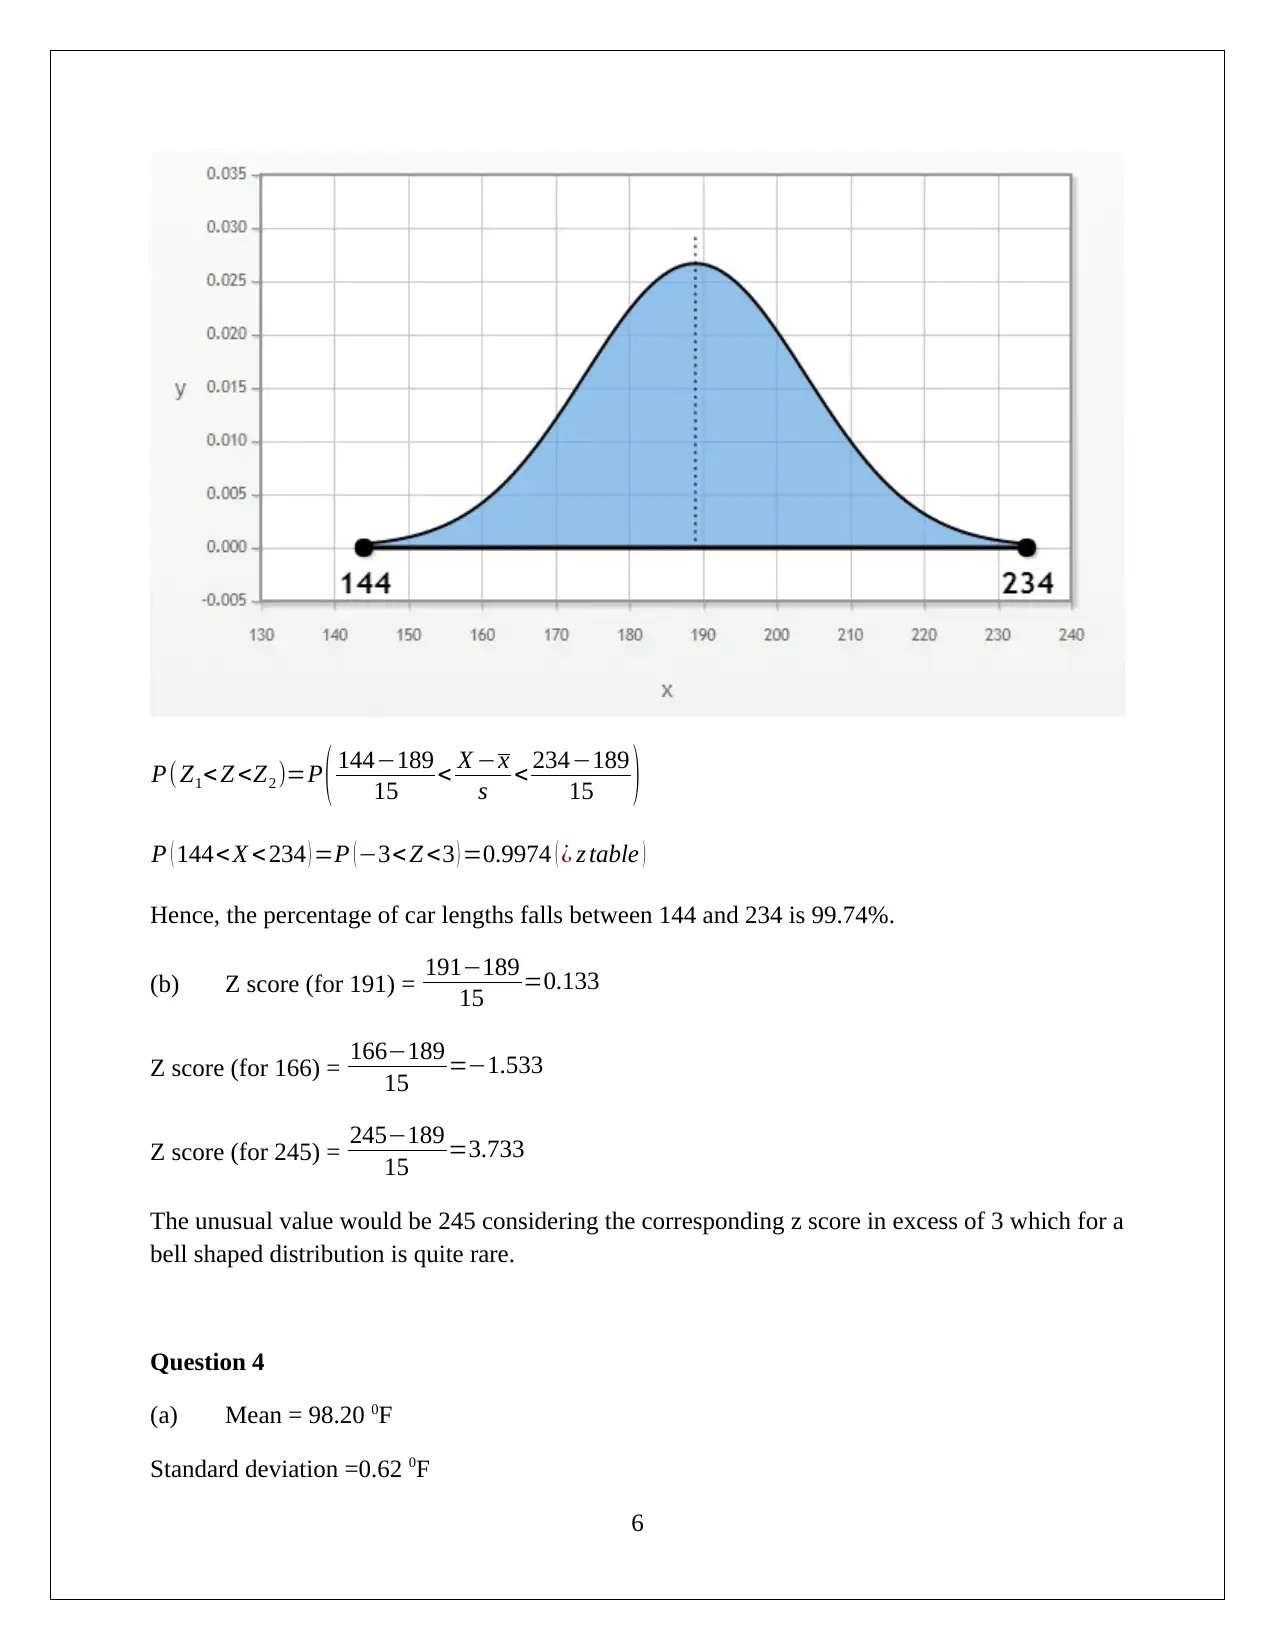
This document provides a detailed solution to a MATH 1P98 Practical Statistics assignment. It includes a frequency distribution table and histogram analysis for length data, calculating percentages, and identifying outliers. The assignment further computes mean, median, and mode for firefighter fatality data and assesses the normality of the distribution. It also addresses Z-scores, percentiles, and the application of the empirical rule and Chebyshev's theorem. Additionally, the solution covers the five-number summary, box plots, and analysis of stock price volatility, including calculations of mean, median, and standard deviation. The document offers comprehensive statistical analysis and data interpretation.
1 out of 15
Related Documents


Your All-in-One AI-Powered Toolkit for Academic Success.
+13062052269
info@desklib.com
Available 24*7 on WhatsApp / Email
![[object Object]](/_next/static/media/star-bottom.7253800d.svg)
Copyright © 2020–2026 A2Z Services. All Rights Reserved. Developed and managed by ZUCOL.